Abstract
With the increase complexity of bearings’ processing algorithms and the growing trend of using computationally demanding algorithms, it is advantageous to provide analysts with a simple to use and implement algorithm. In this spirit, this paper combines simple functions to provide machine condition analysts with the capacity to diagnose bearing faults without all the complexity and jargon that comes with existing methods. The paper proposes a simplified surveillance and diagnostic algorithm for diagnosing localized faults in rolling element bearings using measured raw vibration signals. The proposed algorithm is based on analyzing the frequency content obtained from applying a median filter on the squared derivative signal (first or higher derivatives) of the vibration signal. The combination of signal differencing and median filters provides a squared envelope signal, which can be used directly to diagnose faults. Signal differencing gives a measure of jerk forces and lifts the high frequency content of the signal. To select the optimum order of differentiation, Kurtosis and maximum correlated kurtosis (MCK) are proposed. Median filter usage represents a better alternative of normal low pass filtration. This completely suppresses impulses with large magnitudes, which may interfere with the diagnosis. The length of the median filter (odd number 3, 5, 7 etc.) is selected as such to include the first 10 harmonics of the defect frequency. Simulated signals are used to demonstrate the efficiency of the proposed algorithm and give insights into the choices of the differentiation and smoothening orders. The proposed processing algorithm gives a first measure (surveillance) for detecting localized faults in rolling element bearings in a very simple way and can be employed in online learning and diagnosis systems. Results obtained from applying the algorithm on complex vibration signals from two types of gearboxes are compared with a well-established semi-automated technique with good correspondence.
1. Introduction
Rolling element localized faults, e.g. spall/pitting, give rise to a series of pseudo periodic (second order cyclostationary) bursts, which excites the natural frequencies of the structure [1]. The bursts (Fig. 1, [1]), which are spaced at the rate at which the ball passes over the defect, are generally masked in the low frequency region due to the presence of deterministic components and noise from other components in the system such as gears, blades, unbalance, misalignment, electrical noise, etc. The actual ball pass frequencies are generally 1-2 % in deviation from the theoretical calculated frequencies due to the slippage of the rolling elements as a result of the variation of the load angle [2]. Slippage causes a smearing in the defect frequencies and envelope analysis [2, 3] is used for fault diagnosis.
Envelope analysis, which is the basis of fault diagnosis in rolling element bearings, was first proposed in 1974 by Mechanical Technology Inc. [3]. It was originally called the high frequency resonance technique (HFRT), and is now known by further names such as amplitude demodulation, demodulated resonance analysis, narrow band envelope analysis or only as envelope analysis.
The main inspiration for envelope analysis is the concept that each time a localized defect in a rolling element bearing makes contact under load with another surface in the bearing an impulse is generated. The impulse will have short duration compared to the interval between pulses, and so its energy will be distributed across a very wide frequency range. The result is that various resonances of the bearing and the surrounding structure are excited by the successive impacts. Envelope detection was used to be carried out classically using an analogue circuit to band-pass filter the analogue vibration signal around a structural resonance (defined by spectrum comparisons) and then to use full or half wave rectification followed by a smoothing circuit to recover the approximate envelope signal. In recent years, a digital approach for envelope analysis using the Hilbert transform has been proposed by Ho and Randall [2] as illustrated in Fig. 2.
Fig. 1Typical vibration signals generated by local faults in rolling element bearings (stationary outer race) BPFO = ballpass frequency, outer race; BPFI = ballpass frequency, inner race [2]
![Typical vibration signals generated by local faults in rolling element bearings (stationary outer race) BPFO = ballpass frequency, outer race; BPFI = ballpass frequency, inner race [2]](https://static-01.extrica.com/articles/18254/18254-img1.jpg)
Prior to performing the envelope analysis, the deterministic components are usually separated from the signal to increase the visibility of the bursts. The separation is possible by a number of algorithms e.g. time synchronous averaging (TSA), discrete random separation (DRS), Autoregressive models [4], etc. In order to enhance the impulsiveness of the vibration signal, and to remove the effect of the transfer path, minimum entropy deconvolution (MED) [5] was proposed to aid bearing fault diagnosis [6]. Recently, the use of maximum correlated kurtosis (MCK) [7] has been proposed as a means obtaining an inverse filter to enhance signal impulsiveness and remove the transfer path. For rolling element bearings, a number of publications have utilized MCK, e.g. [8-11].
The best band for demodulation is usually selected by comparing the power spectrum density of the defective signal with a healthy one. In recent years a number of automated methods to select the best band for demodulation have been proposed. Among these are the Kurtogram [12] and the Protrugram [13]. Time frequency analysis has been employed to guide these selections. A comprehensive tutorial on a number of the state of art techniques is given by Antoni and Randall [1].
With the increase complexity of bearings’ pre-processing algorithms and the growing trend of using computationally demanding algorithms, there exists a need for a simple to use, yet reliable, and easy to implement approach, which targets the symptoms of bearing faults. An example on reducing the computation of decomposed signals is the work of Yongbao et al. [14], where the authors introduced the variant energy method in the Hilbert-Huang Transform, which effectively improved the computation. In this spirit, this paper combines simple methods to give analysts a quick and reliable surveillance tool without all the complexity and jargon that comes with existing methods. In addition to providing analysts with this means, the proposed algorithm can be vastly utilized in a number of online classification and learning applications. Online learning is advantageous when dealing with very large or non-stationary data. A number of approaches which present typical areas of such algorithm usage are those using support vectors and classification using neural networks and genetic algorithms, e.g. [15-18].
Fig. 2Procedure for envelope analysis using Hilbert transform technique [2]
![Procedure for envelope analysis using Hilbert transform technique [2]](https://static-01.extrica.com/articles/18254/18254-img2.jpg)
The paper is organized as follows. After the introduction presented in Section 1, Section 2 presents the processing algorithm and discusses parameter selection criteria. Section 3 presents the case of a simulated inner race bearing signal, masked by noise and low frequency deterministic signals and discusses the implementation of the proposed algorithm and the selection of the differentiation order and the median filter order based on Kurtosis and MCK. Section 4 provides a brief summary of a well-established and used algorithm for diagnosing bearing faults. Section 5 compares the results obtained from the simple algorithm to those obtained from the semi-automated algorithm to provide a benchmark. Two signals for detective bearings from a single stage gearboxe and a helicopter planetary gearbox are discussed. Summary and conclusions are discussed in Section 6 while references are listed in Section 7.
2. The basics of the processing algorithm
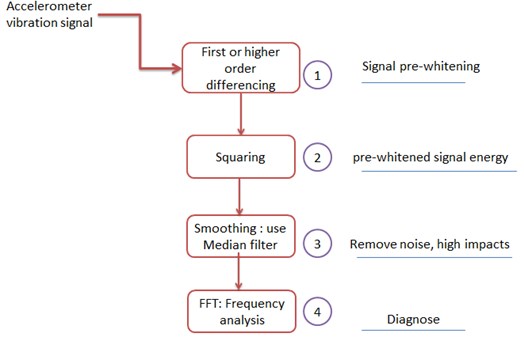
The proposed algorithm, which is illustrated schematically in Fig. 3, is intended as a first surveillance tool of the vibration signal to avoid any complex processing or pre-processing of the raw vibration signal. For its application, the measured accelerometer vibration signal is expected to have minimum speed fluctuation, so that order tracking is not required. In the proposed algorithm, the band-pass filter (around a structural resonance when using envelope analysis) is replaced by differentiating the signal (signal differencing). This process lifts the high frequency content of the signal. Further discussion on the differencing process is provided in Section 2.1. The full/half wave rectification in the envelope process is replaced by taking the square values of the differenced signal, which in fact corresponds to the energy of the signal. The envelope smoothing circuit is replaced by a median filter which has better characteristics (see Section 2.2 for further discussion) compared to a normal low pass filter. The proposed algorithm is simple, quick and easy to use with minimum user intervention. It utilizes basic functions and requires minimal parameters as can be seen from the illustrated examples.
Fig. 3Schematic presentation of the steps of the proposed simple squared envelope analysis
2.1. Signal differencing (differentiation)
The detection of defective bearing components -as discussed in the introduction (see Fig. 1) is based on detecting impacts (impulses) which results from the passage of a rolling element over a spalled region. Impacts are characterized by a sudden jump in acceleration and generally have high frequency content; as they tend to excite structural and sensor natural frequencies. To measure the rate of change in the acceleration response (Jerk forces) and to make these forces more prominent, the vibration signal is differentiated (signal differencing). This process will in fact provide a measure of the force change in the system (jerk) and thus has physics-based meaning.
For a digitized signal, time differencing (differentiation) simply refers to the process of taking the difference between two consecutive samples. Signal differencing has been recognized in the field of detecting hidden information. For instance, it has been utilized recently in the field of detecting hidden information with computer forensic analysis (steganalysis), e.g. [19, 20].
In ref [21], it is shown that for a time series of length : , First differencing () as can be seen from Eq. (1), leads to a series of length such that:
An impulsive noise or a short duration pulse tends to introduce an uncharacteristic discontinuity in a correlated signal [22]. This discontinuity becomes more detectable when the signal is differentiated and in this sense, the differentiation operation is equivalent to a decorrelation or spectral whitening process [22]. For a sinusoidal signal, as in Eq. (2):
where: – signal amplitude, – angular velocity, – phase shift.
First differencing introduces a phase shift of and changes the amplitude by as can be seen from the Eq. (3):
Signal differencing can then be seen as a “high-pass filter” for the time series; as it passes and enhances the high frequency variations and attenuates low-frequencies.
In ref [23], first differencing has been recognized as the residual (pre-whitened signal) of an Autoregressive (AR) process of an order 1 (AR (1). Sawalhi and Randall [24] showed that signal differencing and in particular the 4th derivative was found to give the highest kurtosis and clarity of detecting impulses. Bozchalooi and Liang [25] gave a very detailed analysis and description to the enhancement of the signal to interference ratio (SIR) that can be obtained by the successive differentiations of the vibration signal in the case of detecting faults in rolling element bearings. Bozchalooi and Liang [25] proposed a differentiation method to enhance the fault delectability. It is reported that the iterative application of a differentiation step can enhance the relative strength of the impulsive faulty bearing signal component with respect to the vibration interferences. This has the effect of preserving the effectiveness of amplitude demodulation and hence leads to more accurate fault detection.
As a means to select the optimum differentiation order, kurtosis Eq. (4) between one differentiation process and the other can be utilized to guide the selection process; as the ultimate aim is to enhance the impulsiveness of the signal and to enhance the ability of the detection of impacts:
where: – number of samples of signal , – mean of signal
The use of maximum correlated Kurtosis (MCK) [7] can be thought of as a better alternative to kurtosis; as it specifically enhances the impulsiveness of the fault related features. MCK of first shift can be calculated using Eq. (5), which is based on assuming a zero-mean, i.e. 0. MCK requires the knowledge of the period of impact (), which depends on the location of the spall. In this sense and as the algorithm is used for surveillance without prior use of the type of fault, kurtosis would be a better option. Correlated Kurtosis of first – shift:
2.2. Smoothening using a median filter
As the importance of detecting the faulty component in a bearing signal resides in analyzing the periodicity/frequency of the impulses, rather than the impulse high frequency content, it is necessary to low pass filter the squared enveloped signal (energy of the extracted fault impulses, which was found by the differencing method). If only periodic impulses exist in the squared envelope signal, then low pass filtering would be appropriate to use. However, due to the likelihood of having extraneous impulses with large magnitudes in the squared enveloped signal, a median filter is proposed here for a robust smoothening.
Median filters [26, 27] have been utilized in a number of fields such as image processing [28], speech analysis [29] and seismic signal processing [30]. A Median filter has been recognized as an effective processing tool for suppressing impulse noise, while keeping the edge information [30]. In its simplest utilization, a median filter takes samples of the input signal (usually is odd: 3, 5, 7, etc.) and reports the middle value of a sorted version of the samples. This process is a nonlinear operation which makes it impossible to get a system function (Hz) for a median filter in a signal processing sense [31].
Generally speaking, for a signal with sampling frequency (Hz), a median filter of length will attenuate frequency content above . As the envelope spectrum is often chosen to include at least the first five to ten harmonics of the defect frequency, the upper bound of the median filter selection can be guided by the required envelope spectrum frequency limit. For instance, to include the first 10 harmonics, the length of the Median filter can be calculated using Eq. (6) as:
where: : Recommended filter length (samples), : Defect characteristic frequency defined as: BPFI, BPFO or BSF (see Fig. 1).
As impulses’ spacing is closer in the case of the inner race defect, it is more intuitive to base Eq. (6) on the inner race defect characteristic frequency (BPFI) and thus to limit the number of samples of the median filter to one tenth of the spacing between the impact impulses. This means that the analyst can select the median filter length as one of the following: (3, 5, 7, ..., one tenth of the spacing between the impulses).
Median filter can be easily implemented using the Matlab® function “medfilt1” [32]
2.3. Surveillance and diagnosis algorithm code
The following Matlab® code shows the simplicity of the proposed code. Only two parameters are needed to run the code (: Differentiation order and : Median filter order). Only one line of code is used in the algorithm to find the squared envelope signal. Its envelope is found using a normal fft analysis.
% Input
% : time domain signal
% fs: sampling frequency
% Output
% env: Squared Enveloped signal
4; % Differentiation order based Kurtosis (see % section 2.1)
9; % Median filter order (see section 2.2, Eq. (6))
env = (medfilt1 (abs (diff (, )).^2, )); % Only line of code to find the squared % envelope
% Envelope Spectrum
NFFT = length (env);
df = NFFT/fs;
linspace (0, fs, NFFT);
XF = fft (env, NFFT);
plot (f (1: end/2), abs (XF (1: end/2))/NFFT);
title ('Envelope Spectrum of the median filtered signal'); xlabel ('Frequency (Hz)').
3. Simulated signals and choice of parameters
Table 1 summarizes the steps used to create an inner race simulated fault. A sampling frequency of 20 kHz is used. An impulse response train (8 kHz frequency and time constant of 0.0005 s) with a ball pass frequency (BPF) of 100 Hz (200 samples) was created with a slippage of 2 %. The impulse train was modulated by a 12.5 Hz frequency, scaled by 0.5 and added to two deterministic frequencies. Noise was added to the obtained signal to get a signal to noise ratio (SNR) of 20 dB. Fig. 4 shows the simulated signal Fig. 4(a) and its frequency content Fig. 4(b). Fig. 4(c) shows the frequency content in the 0-1 kHz region where the BPF is clearly present with 12.5 Hz modulation. The smearing effect is visible in higher harmonics. Fig. 4(d) shows a zoom in view around the 8 kHz resonance.
Table 1Simulated signal generation and characteristics
Steps | Equation (mathematical process) | Signal parameters/zoom in | |
1 | Create impulse response | Sampling frequency 20 kHz Impulse resonance: 8 kHz Time constant: 0.005 s Shaft rotational frequency: 12.5 Hz Ball pass frequency: BPF 100 Hz (200 samples) | |
2 | Repeat the impulse responses with 2 % fluctuation of the period | 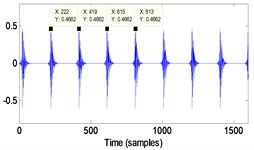 | 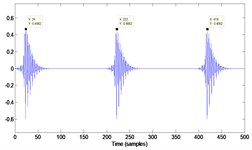 |
3 | Create modulation by shaft speed. Multiply by a hanning window of 1600 samples (corresponds to shaft speed of 12.5 Hz) | 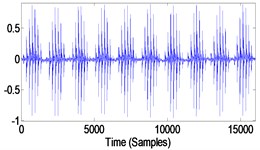 | 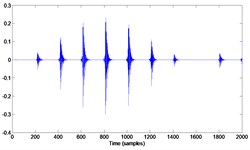 |
4 | Scale down the bearing fault obtained in 3 (Multiply by 0.5) add low frequency deterministic components (12.5 Hz (amplitude 1 and 25 Hz amplitude 0.5) Add noise (SNR = 20) | 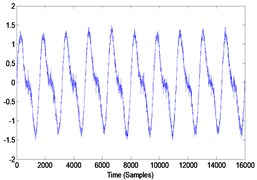 |  |
Fig. 4a) Simulated signal (SNR = 20 dB), b) frequency content of the simulated signal (0-10 kHz), c) frequency content in the low frequency region (01-1 kHz), d) zoom in around the 8 kHz resonance
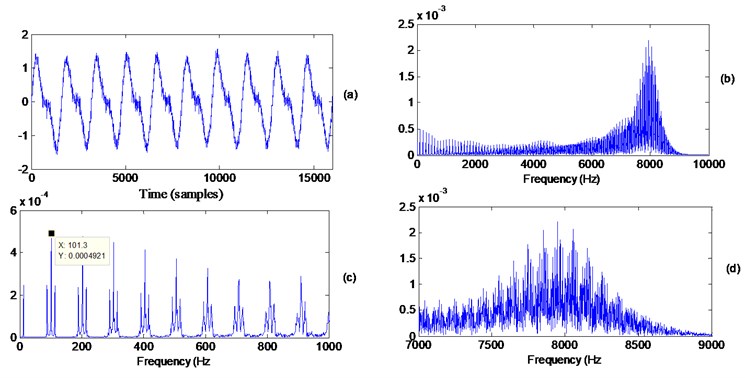
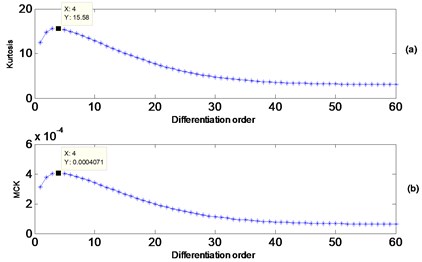
Fig. 5 presents the results of the Kurtosis and maximum correlated kurtosis for differentiations orders up to 60. Both measures produce the same behavior and give a maximum at order 4.
Fig. 5a) Kurtosis vs. differentiation order, b) maximum correlated kurtosis vs. differentiation order
Figs. 6 and 7 show the effect of differentiation on both the time and frequency content (power spectral density) respectively. The orders of differentiation are: the 1st (Figs. 6(b) and 7(b)); the 4th (Figs. 6(c) and 7(c)) and the 30th (Figs. 6(d) and 7(d)). The 4th derivative, being the optimum selected by kurtosis maximization gives the better extraction on the impacts and the best whitening for the signal’s spectrum.
Fig. 6a) Just over one rotation of the simulated signal, b) signal a differentiated once, c) signal a differentiated 4 times, d) signal a differentiated thirty times
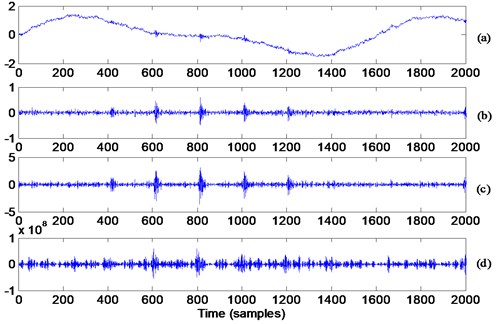
Fig. 7Power spectral density (PSD) [1.25 Hz/line] of: a) simulated signal, b) signal a differentiated once, c) signal a differentiated 4 times, d) signal a differentiated thirty times
![Power spectral density (PSD) [1.25 Hz/line] of: a) simulated signal, b) signal a differentiated once, c) signal a differentiated 4 times, d) signal a differentiated thirty times](https://static-01.extrica.com/articles/18254/18254-img13.jpg)
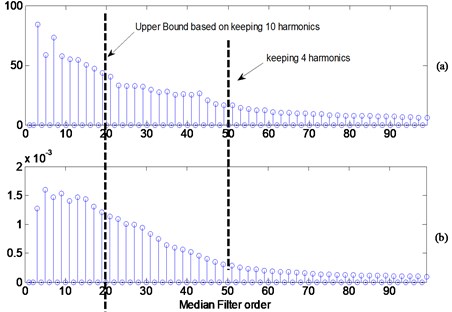
Fig. 8 illustrates the effect of applying a median filter with four different orders (3, 5, 15 and 19). Order 19 is one sample below one tenth of the spacing between the impacts. Orders 15 and 19 gave better smoothening effect as expected and as can be seen visually. The envelope spectrum as plotted in Fig. 9 shows no advantage of one filter order over the other in terms of the frequencies and the modulations. Kurtosis and MCK of the squared enveloped signal for different median filters are plotted in Fig. 10. The figure shows the bounds of keeping the 10 (medina filter order of 20) and 4th harmonic (median filter order of 50). In particular, the orders below 1/0th the spacing gives high kurtosis and MCK.
Fig. 8Median filter applied to squared amplitude of the 4th differentiated signal (squared enveloped signal): a) result with median filter of 3 samples, b) result with median filter of 5 samples, c) result with median filter of 15 samples, d) result with median filter of 19 samples
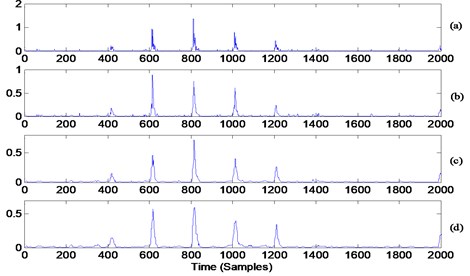
Fig. 9Envelope spectrum of the signals show in Fig. 8: a) with median filter of 3 samples, b) with median filter of 5 samples, c) with median filter of 15 samples, d) with median filter of 19 samples
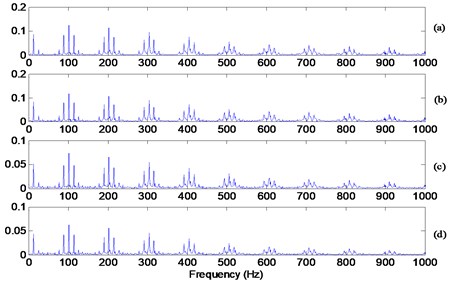
Fig. 10a) Kurtosis vs. median filter order, b) MCK vs. median filter order
4. Brief description of bearing semi-automated algorithm
A semi-automated algorithm for detecting localized faults in rolling element bearings was proposed and tested on a number of cases [33]. Before the implementation of the algorithm, the raw vibration signal is pre-processed to remove the deterministic components. Pre-processing can be achieved in a number of ways such as order tracking and subtracting of the synchronous averages for each shaft in the system, self-adaptive noise cancellation (SANC) or discrete random separation (see ref [4] for description and examples).
The semi-automated algorithm involves pre-whitening the pre-processed version of the raw signal using an autoregressive model (AR modeling). This has the effect of enhancing the weak impulsiveness event through equalizing the contribution of the different bins. This exercise was found to be of a great benefit in both fault diagnosis and prognosis. Once the signal is pre-whitened, the effect of the transfer path is removed through the use of a minimum entropy deconvolution filter (MED). MED works further on enhancing and shortening the impulse length through maximizing the kurtosis and removing the damping effect associated with the transfer path. Finally, wavelet kurtogram is applied to select the best band for envelope analysis. The filtered signal by the best filter is extracted and processed using the Hilbert transform to obtain the envelope spectrum.
5. Experimental results
The verification used in the paper has focused on using two complex signals with gears and bearing signals. These are typical cases where pre-processing of the signal is required prior to the application of envelope analysis. One case (Section 5.1) was taken from a single stage gearbox with inner and outer race faults. The second signal (Section 5.2) was measured from a helicopter gearbox with a defective planetary bearing.
5.1. Single stage gearbox
Vibration signals collected from a single stage gearbox (spur gear, 32 teeth,1:1 ratio) with a defective (seeded fault) inner race and a defective outer race bearing are used to demonstrate the effectiveness of the presented surveillance algorithm. The gearbox under consideration was run at 10 Hz and with a torque of 50 Nm. An accelerometer was placed on the top of a defective bearing and vibration signals were collected at a sampling rate of 48 kHz. The gear mesh frequency (32X10) is 320 Hz. The estimated ball pass frequency of the inner race (BPFI) is 71.2 Hz, while that of the outer race (BPFO) is 48.9 Hz. Zoom plots representing one shaft rotation of measured vibration signals, as well as their frequency content (resolution of 5.8 Hz/line) are presented in Fig. 11. The time domain signature shows clear gearmesh events with impacts (bearing defect) of high frequency nature. Gear vibrations are noticed mainly in the frequency region up to 8 kHz in the form of discrete components, while vibrations from the bearing fault are noticed to excite resonances in the high frequency region. The interaction between gears’ vibration and the localized defective bearing vibration is additive [34] in the sense that they excite different frequency bands and can be separated. This additive nature and the excitation of high resonances by the bearing spall are the main motives behind the envelope analysis (high frequency resonance technique).
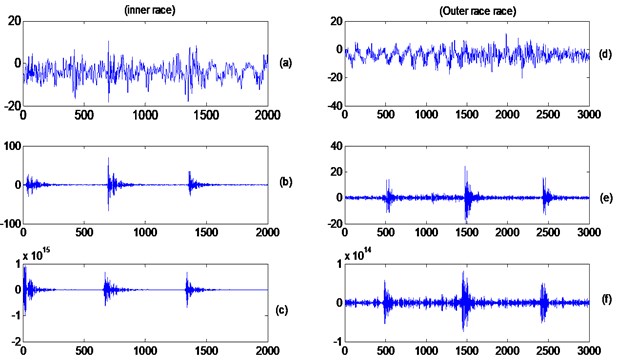
Fig. 12 shows the kurtosis values for the first one hundred orders of differentiation for both the inner race and the outer race faults. The behavior is different between the two cases, with the best results achieved around the third and fourth derivatives. In the case of the outer race fault, it is noticed that, unlike the inner race case, the kurtosis tends to decrease with the increase of differentiation order; as this seems to highlight some high frequency noise from the gears. This can be seen clearly by inspecting the differentiated signals (zoomed in around three impacts) shown in Fig. 13. The fault impacts can be clearly seen using the third/forth derivatives and no further advantage was observed when using higher order derivatives.
Fig. 11Top: raw time domain signal (0.1 seconds, which correspond to 1 shaft rotations). Bottom: power spectrum density (resolution 5.8 Hz/line). Left column: inner race, right: outer race
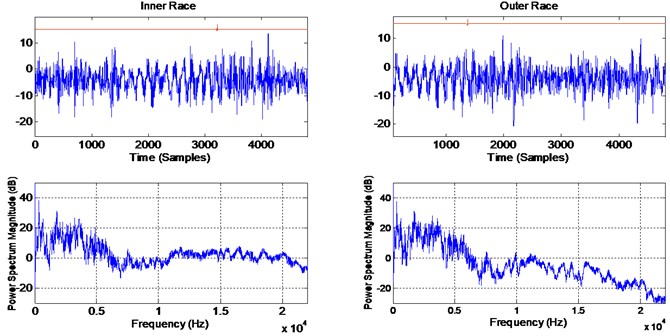
Fig. 12Kurtosis vs. differentiation order for the single stage gearbox: a) inner race, b) outer race
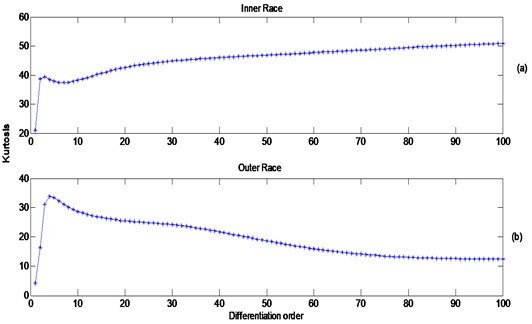
Fig. 13Left: inner race: a) raw signal, b) third differentiation, c) fiftieth differentiation. Right: outer race: d) raw signal, e) forth differentiation, f) fiftieth differentiation
In Figs. 14(a) and 14(b), the squared values of the third and fourth derivatives in the case of the inner race and outer race faults were plotted in Figs. 13(c) and 13(d) respectively. A median filter of 65 samples (approximately (48000/71×10) was used to filter signals Figs. 14(a) and 14(b) with the results shown in Figs. 14(c) and 14(d). The 65 samples filter represents roughly one tenth the spacing between two consecutive impacts. The low pass effect can be clearly seen through the removal of high frequency components and obtaining the squared envelope. Finally, the spectrum of Figs. 14(c) and 14(d) (squared envelope spectrum) was obtained and is presented in Figs. 15(a) and 15(b) respectively.
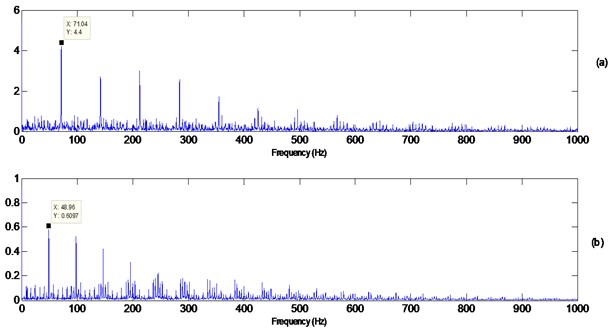
The spectra of the squared values of the differenced-median filtered signals obtained in Figs. 14(c) and 14(d) for the inner and outer races faults are plotted in Figs. 15(a) and 15(b) respectively. A clear identification of the source of the impacts is achieved through the presence of the BPFI and the BPFO. The modulation effect associated with the inner race fault is not clearly observed. There has been no established clear link (through simulations) to the effect of differentiation on signal modulation. The effect can be present due to light load and as so the signal becomes lightly modulated, Outer race fault harmonics are clear, with weak sidebands at the cage frequency. The end results of diagnosis using the proposed surveillance processing are compared to the results obtained from the semi-automated algorithm presented in section 4. The processing through the different steps are shown in Figs. 16 and 17, which identify the best band for demodulation process and provides an envelope spectrum analysis on this basis.
Fig. 14a) Squared values of signal Fig. 13(b), b) squared values of signal Fig. 13(d), c) signal Fig. 14(a) after using a median filter of order 65, d) signal Fig. 14(b) after using a median filter of order 65
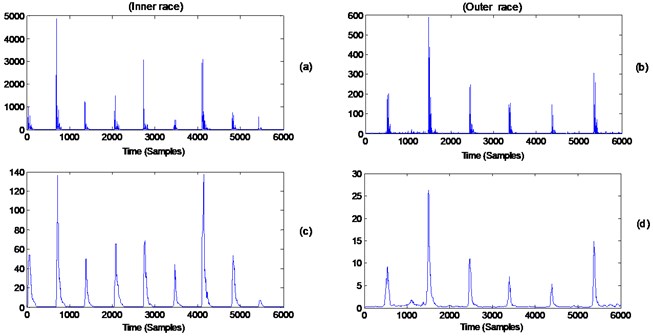
Fig. 15a) Spectrum of signal Fig. 14(c) (inner race fault), b) spectrum of signal Fig. 14(d) (outer race fault)
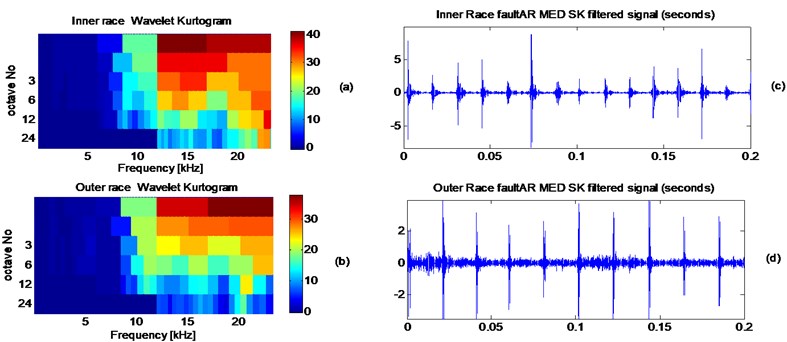
The wavelet kurtogram highlighting the excited bands of the preprocessed signals is shown in Fig. 16(a) and 16(b) for the inner and outer race respectively. Filtered signals are presented in Figs. 16(c) and 16(d). Note the correspondence between the kurtosis of the differenced signal (Fig. 12) and the kurtosis of the filtered signals after pre-processing and SK filtration.
Fig. 16a) Wavelet kurtogram of AR-MED filtered signal of the inner race fault, b) inner race AR-MED-SK filtered signal, c) wavelet kurtogram of AR-MED filtered signal of the outer race fault, d) outer race AR-MED-SK filtered signal
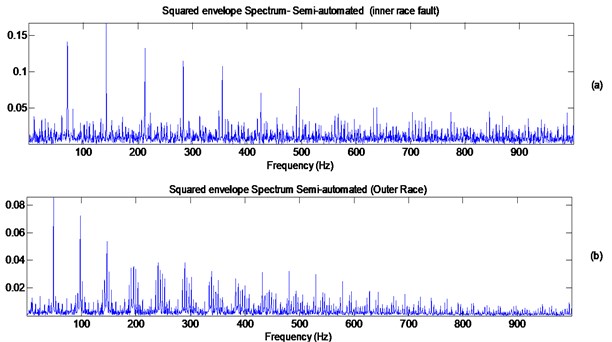
Finally, the squared envelop spectrum extracted using the semi-automated algorithm is presented in Fig. 17 and can be compared with Fig. 15 to illustrate the effectiveness. Comparisons indicate the success of the proposed algorithm in detecting and diagnosing the localized faults. The modulation of the inner race by the shaft speed is not prominent and aligns with the squared envelope result obtained in Fig. 15; thus, indicating that the load is not heavy enough to cause this modulation.
Fig. 17a) Squared envelope spectrum for the inner race faulty signal obtained using the semi-automated process using the filtered signal of Fig. 16(b), b) squared envelope spectrum for the outer race faulty signal obtained using the semi-automated process using the filtered signal of Fig. 16(d)
5.2. Inner race fault in a planetary bearing of a helicopter gearbox
The second example used to demonstrate the practicality of the proposed approach is an interesting case of a faulty planetary bearing (both inner race and roller faults) from a 3-planet gearbox. This case represents a more challenging and complicated gearbox system compared to the one presented in section 5.1. The signal analyzed was captured at a rate of 51200 Hz. The faulty planetary bearing had a severe inner race spalling and defective rolling elements. The BPFI was estimated at 117.5 Hz, BSF estimated at 37 Hz while the cage frequency was estimated at 9.81 Hz. The analysis of this case using the semi-automated approach was presented in reference [20].
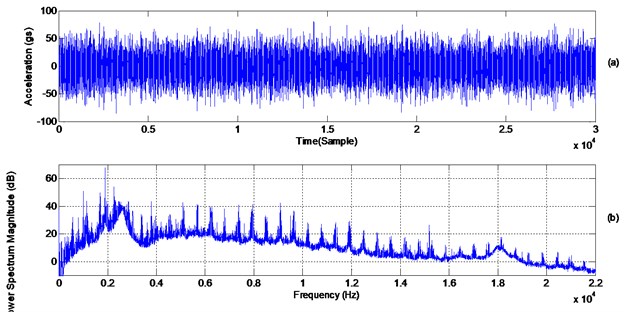
Fig. 18 presents the time domain signal and the power spectrum density of the vibration signal captured from one of the accelerometers placed on the ring. The presences of the gearmesh frequencies as well as their harmonics/sidebands are noticed over the full frequency bandwidth up to 22 kHz.
Fig. 18a) Time domain signal (just over three revolutions), b) power spectrum density (1.25 Hz/line)
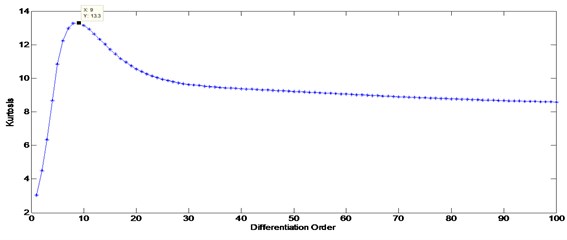
The time domain signal presented in Fig. 18 was differenced and the kurtosis values were plotted for each order. The result, as presented in Fig. 19, shows that the 9th differentiation order gives the highest kurtosis.
A zoom in, showing the first 30.000 samples (just over three rotations of the output speed), of the raw signal and its 9th differentiation order is plotted in Fig. 20. This reveals some of the hidden impacts which are attributed to the faulty bearing
Fig. 19Kurtosis vs. differentiation order for the planetary gearbox signal (maximum Kurtosis at order 9)
The effect of squaring and applying a median filter on the 9th differentiated signal of an order of 45 (one tenth the spacing between two inner race impacts) are shown in Figs. 21(a) and 21(b) respectively. Note the effect of the median filter on enhancing the impacts and making them protrude more from the background noise. The spectrum of the signal obtained in Fig. 21(b) is plotted in Fig. 22 (two zoom-in regions (a) from 0 to 100 Hz, and (b) from 90 Hz to 500 Hz). The cage frequency and the BPFI can be clearly seen (with clear four harmonics), thus provides a clear diagnosis of the fault.
The wavelet kurtogram After the removal of all shaft harmonics, signal pre-whitening and MED application is plotted in Fig. 23 [33]. This shows that the best band to enhance impulsiveness and extract fault components is present in the vicinity of the 20 kHz frequency. The result obtained from signal differencing and median filtration in Fig. 22 is very well comparable to the result of the AR-MED-SK, which is plotted in Fig. 24 [33].
Fig. 20Planetary gearbox signal: a) raw signal, b) ninth differentiation
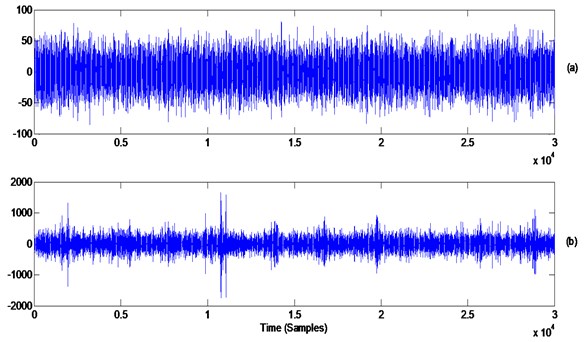
Fig. 21a) Squared values of signal Fig. 20(b), b) signal Fig. 21(a) after using a median filter of order 45
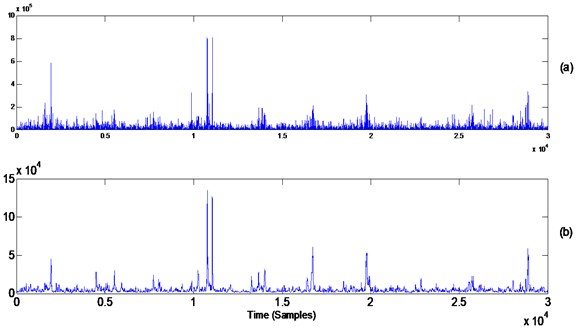
Fig. 22a) Spectrum of signal Fig. 21(b) (0-100 Hz), b) spectrum of signal Fig. 21(b) (90-500 Hz)
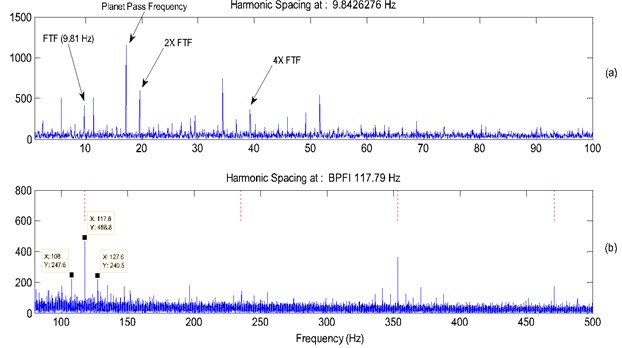
Fig. 23Wavelet kurtogram of AR-MED filtered 3-planet signal [19]
![Wavelet kurtogram of AR-MED filtered 3-planet signal [19]](https://static-01.extrica.com/articles/18254/18254-img29.jpg)
Fig. 24SK automated envelope analysis: a) squared envelope spectrum (0-100 Hz), b) squared envelope spectrum (100-500 Hz) [33]
![SK automated envelope analysis: a) squared envelope spectrum (0-100 Hz), b) squared envelope spectrum (100-500 Hz) [33]](https://static-01.extrica.com/articles/18254/18254-img30.jpg)
6. Conclusions
This paper has proposed the use of signal differencing and median filtration as a simple and very efficient first means for obtaining the squared envelope spectrum for the purpose of detecting and diagnosing the presence of a localized fault in rolling element bearings. It has been illustrated, using simulated signals and two experimental cases of defective bearings from gearboxes that the proposed method is quite simple to use and requires a minimal intervention from the analyst, with proven effectiveness when compared to an established semi-automated algorithm. Simulated signals were used to demonstrate the use of the proposed algorithm and to give insights into the selection of the order of differentiation and the median filter length. The selection of the order of differentiation has been based on maximizing the kurtosis of the differentiated signal. The use of the maximum correlated kurtosis was used and compared to kurtosis. Both measures gave same results; s this and for simplicity, kurtosis is recommended for use. The length of the median filter is recommended to be of a maximum order equivalent to one tenth of the spacing between two consecutive impacts to capture at least the first ten harmonics of the fault frequency. Simulated results examined a number of filter lengths below the one tenth of spacing and the results showed no significant difference between these orders when comparing the spectrum content and the kurtosis and maximum correlated kurtosis for different median filter lengths. Although the techniques used here are not new, their combination to provide a simple rolling element bearing detection, surveillance and diagnosis algorithm is new and has not been discussed in this sense before. The proposed processing algorithm has been tested on two different vibration signals taken from a single stage spur gearbox and a planetary helicopter gearbox. Results obtained from the proposed algorithm has been compared to a well-established semi-automated technique (includes separating bearing and gear signal and finding an optimum band for envelope analysis). The results obtained from the proposed algorithm have successfully extracted the embedded fault signature and gave a correct diagnosis results, which compares very well to an established semi-automated diagnosis algorithm.
References
-
Randall R. B., Antoni J. Rolling element bearing diagnostics – a tutorial. Mechanical Systems and Signal Processing, Vol. 25, 2011, p. 485-520.
-
Ho D., Randall R. B. Optimization of bearing diagnostic techniques using simulated and actual bearing fault signals. Mechanical Systems and Signal Processing, Vol. 14, Issue 5, 2000, p. 763-788.
-
Darlow M. S., Badgley R. H., Hogg G. W. Application of High Frequency Resonance Techniques for Bearing Diagnostics in Helicopter Gearboxes. US Army Air Mobility Research and Development Laboratory, Technical Report, 1974, p. 74-77.
-
Randall R. B., Sawalhi N., Coats M. A comparison of methods for separation of deterministic and random signals. The International Journal of Condition Monitoring, Vol. 1, Issue 1, 2011, p. 11-19.
-
Wiggins R. A. Minimum entropy deconvolution. Geoexploration, Vol. 16, 1978, p. 21-35.
-
Sawalhi N., Randall R., Endo H. The enhancement of fault detection and diagnosis in rolling element bearings using minimum entropy deconvolution combined with spectral kurtosis. Mechanical Systems and Signal Processing, Vol. 21, 2007, p. 2616-2633.
-
Geoff Mcdonald L., Qing Zhao, Ming Zuo J. Maximum correlated Kurtosis deconvolution and application on gear tooth chip fault detection. Mechanical Systems and Signal Processing, Vol. 33, 2012, p. 237-255.
-
Jia F., Lei Y., Shan H., Lin J. Early fault diagnosis of bearings using an improved spectral kurtosis by maximum correlated kurtosis deconvolution. Sensors, Vol. 15, 2015, p. 29363-29377.
-
Zhang X., Kang J., Hao L., Cai L., Zhao J. Bearing fault diagnosis and degradation analysis based on improved empirical mode decomposition and maximum correlated kurtosis deconvolution. Journal of Vibroengineering, Vol. 17, 2015, p. 243-260.
-
Miao Yonghao, Zhao Ming, Lin Jing, Lei Yaguo Application of an improved maximum correlated kurtosis deconvolution method for fault diagnosis of rolling element bearings. Mechanical Systems and Signal Processing, Vol. 92, 2017, p. 173-195.
-
Chen Xianglong, Zhang Bingzhi, Feng Fuzhou, Jiang Pengcheng Optimal resonant band demodulation based on an improved correlated kurtosis and its application in bearing fault diagnosis. Sensors (Basel), Vol. 17, 2017, p. 2-360.
-
Antoni J. Fast computation of the kurtogram for the detection of transient faults. Mechanical Systems and Signal Processing, Vol. 21, 2007, p. 108-124.
-
Barszcz T., Jabłoński A. A novel method for the optimal band selection for vibration signal demodulation and comparison with the Kurtogram. Mechanical Systems and Signal Processing, Vol. 25, 2011, p. 431-45.
-
Liu Yongbao, Wang Qiang, Liu Shuyong, He Xing Research on fault law of rolling bearing under different fault levels and loads with HHT method. Journal of Measurements in Engineering, Vol. 2, Issue 2, 2014, p. 86-94.
-
Gu Bin, Sheng Victor S., Tay Keng Yeow, Walter Romano, Li Shuo Incremental support vector learning for ordinal regression. IEEE Transactions on Neural Networks and Learning Systems, Vol. 26, Issue 7, 2015, p. 1403-1416.
-
Gu Bin, Sheng Victor S., Wang Zhijie, Ho Derek, Said Osman, Li Shuo Incremental learning for ν-support vector regression. Neural Networks, Vol. 67, 2015, p. 140-150.
-
Gu Bin, Sheng Victor S. A robust regularization path algorithm for ν-support vector classification. IEEE Transactions on Neural Networks and Learning Systems, Vol. 28, Issue 5, 2017, p. 1241-1248.
-
Gu Bin, Sun Xingming, Sheng Victor S. Structural minimax probability machine. IEEE Transactions on Neural Networks and Learning Systems, Vol. 28, Issue 7, 2017, p. 1646-1656.
-
Wen Xuezhi, Shao Ling, Xue Yu, Fang Wei A rapid learning algorithm for vehicle classification. Information Sciences, Vol. 295, Issue 1, 2015, p. 395-406.
-
Xia Zhihua, Wang Xinhui, Sun Xingming, Wang Baowei Steganalysis of least significant bit matching using multi-order differences. Security and Communication Networks, Vol. 7, Issue 8, 2014, p. 1283-1291.
-
Xia Zhihua, Wang Xinhui, Sun Xingming, Liu Quansheng, Xiong Naixue Steganalysis of LSB matching using differences between nonadjacent pixels. Multimedia Tools and Applications, Vol. 75, Issue 4, 2016, p. 1947-1962.
-
Pyper B. J., Peterman R. M. Comparison of methods to account for autocorrelation in correlation analyses of fish data. Canadian Journal of Fisheries and Aquatic Sciences, Vol. 55, 1998, p. 2127-2140.
-
Vaseghi Saeed V. Impulsive Noise, in Advanced Signal Processing and Noise Reduction. 2nd Edition, John Wiley&Sons Ltd, 2001, p. 355-377.
-
Thompson K. R., Page F. H. Detecting synchrony of recruitment using short, autocorrelated time series’. Canadian Journal of Fisheries and Aquatic Sciences, Vol. 46, 1989, p. 1831-1838.
-
Sawalhi N., Randall R. B. Signal pre-whitening for fault detection enhancement and surveillance in rolling element bearings. 8th International Conference on Condition Monitoring and Machinery Failure Prevention Technologies, Cardiff, UK, 2011.
-
Bozchalooi S. I., Liang M. Parameter-free bearing fault detection based on maximum likelihood estimation and differentiation. Journal of Measurement Science and Technology, Vol. 20, Issue 6, 2009.
-
Tukey J. W. Exploratory Data Analysis. Addison-Wesley, Reading, MA, 1977.
-
Bottema M. J. Deterministic properties of analog median filters. IEEE Transactions on Information Theory, Vol. 37, 1991, p. 1629-1640.
-
Barner K., Arce G. R. Nonlinear Signal and Image Processing: Theory, Methods, and Applications. CRC Press, Boca Raton, FL, 2003.
-
Sethares W., Milne A., Tiedje S., Prechtl A., Plamon J. Spectral tools for dynamic tonality and audio morphing. Computer Music Journal, Vol. 33, 2009, p. 71-84.
-
Bednar J. B. Applications of median filtering to deconvolution, pulse estimation, and statistical editing of seismic data. Geophysics, Vol. 48, 1983, p. 1598-1610.
-
Stephan Herzo Efficient DSP implementation of median filtering for real-time audio noise reduction, Proceedings of the 16th International Conference on Digital Audio Effects (DAFx-13), Maynooth, Ireland, 2013.
-
MathWorks. MATLAB Signal Processing Toolbox, medfilt1. Natick, Massachusetts, 2014.
-
Sawalhi N. Diagnostics, Prognostics and Fault Simulation for Rolling Element Bearings. Ph.D. Thesis, University of New South Wales, Australia, 2007.
-
Antoni J., Randall R. B. Differential diagnosis of gear and bearing faults. Journal of Vibration and Acoustics, Vol. 124, 2002, p. 165-171.
About this article

The author declares that there is no conflict of interest regarding the publication of this paper.
