Abstract
For online monitoring and identifying gear faults, a new fault indicator is proposed based on a multivariate statistical technique, dynamic principal component analysis (DPCA), under variable load conditions. In this method, a tri-axial vibration sensor is used to acquire the 3-direction vibration signals of gear in the gear box because it can pick up more abundant fault information than a single axis sensor does. By monitoring the value of the fault indicator, the running state of the gear (normal condition or faults) can be directly identified according to the set thresholds without using any other fault classification methods. To verify the effectiveness, the proposed method is applied on the QPZZ-II rotating machinery fault simulation rig in which the root crack and the tooth broken faults are introduced into the gearbox’s driving gear. Experimental results show that the fault indicator not only can effectively reveal the health state of the gear, but also is without being influenced by the load fluctuation. And, the accuracy rate of fault diagnosis is over 96 %.
1. Introduction
The gear transmission is one of the most widely used transmission forms in the mechanical system for the gear box has its own advantages, such as fixed transmission ratio, transmission torque, compact structure. Meanwhile, like bearings, gears in the gear box become one of the key components which are prone to failure and their running state has a great influence on the working performance of the whole rotating machine. Compared with the bearing failure, the study of gear faults is ignored. In fact, 80 % of faults in transmission machineries are caused by gears, and gear faults in rotating machinery account for about 10 % of the total faults. Hence, online monitoring and diagnosis for gears is extremely challenging and beneficial to reduce maintenance costs and avoid catastrophic accidents and so on.
At present, the vibration-signal-based analysis technologies are still the main and popular means of gear and bearing condition monitoring and fault diagnosis, not only because the change of the vibration pattern can reflect the occurrence of a fault, but also vibration signals are easily acquired by vibration sensors. So, vibration-based fault diagnosis methods are paid more attention by many scholars. As described in Ref. [1], 41 % of vibration-based papers published from 2004 to 2012 are related to bearing faults, followed by rotor faults (27 %) and gear faults (20 %). Compared with the bearing failure, the study of gear fault has not been paid enough attention.
Most of existing fault diagnosis methods generally contains two key phases: feature extraction and fault identification. The most commonly used feature extraction methods include empirical mode decomposition (EMD) [2-4], singular value decomposition (SVD) [5, 6], wavelet transforms [7-9], variational mode decomposition (VMD) [10-12] and so on. After fault features extracted, BP neural network [13], support vector machine (SVM) [12], -nearest neighbor algorithm (-NN) [14] and so on are used to identify the types of faults. Although many methods have adaptive properties, such as EMD, VMD, -NN, their greatest weakness is that their computational burden is too heavy to be suitable for online application. Although frequency domain based methods, such as fast Fourier transform, have been successfully used to online monitor tooth root crack faults of gear, the Fourier transform is powerless when the signals contain large amounts of non-stationary or transient information.
The principal component analysis (PCA) as a multivariate statistical technique is most commonly used in signal and image processing aiming at reducing the dimensionality of data [15] and fault monitoring for the multivariate statistical processes [16, 17]. In terms of mechanical systems, PCA technology is mainly used to obtain the best fusion features from high dimensional feature space [18, 19] and determine the optimal feature set from time, frequency, and time-frequency features [20, 21]. The dynamic PCA (DPCA) has been developed to handle the process measurements with dynamic relationship. So, the residuals of the DPCA model are much more uncorrelated than those of the traditional PCA model. In recent years, the PCA/DPCA technique is successfully used to monitor the running state of rolling bearing by applying SPE statistic [22-23]. The biggest advantage of the PCA/DPCA based methods is the models are established offline and online calculating burden is low, so they are very suitable for online applications. However, the PCA method is rarely used alone for fault diagnosis of gears or bearings.
In this paper, a novel fault indicator is presented based on Hotelling statistic and the square predicted error (SPE) statistic of DPCA aiming at proposing an efficient approach for online gear monitoring and fault diagnosis. The proposed method with simple construction and no complex computation can be used online because of the DPCA model offline established and on need to extract a lot of features. In fact, it was proved that 3-direction (radial-direction, axial-direction and rotational) vibration signals acquired from a tri-axial acceleration/vibration sensor give the more useful fault information than ones from a single axis vibration sensor [24]. Furthermore, when collecting vibration signals of 3 directions, the acquisition time of the tri-axis sensor is shorter than that of the 3 single-axis sensors. So, the use of tri-axis sensor not only helps to improve the accuracy of fault detection and diagnosis, but also saves time for online applications. Experimental results show that we can clearly and easily judge the health state and fault types of the gear only by monitoring the proposed indicator.
2. PCA and DPCA
2.1. Theory of PCA
PCA is a well-known and multi-variable feature extraction method based on 2-order statistics. It determines a set of orthogonal vectors, called loading vectors, which can be ordered by the amount of variance explained in the loading vector directions. By PCA, the high-dimensional correlated measurements are transformed into the low-dimensional uncorrelated variables.
Consider an -by- history data matrix which has been scaled to zero mean and unit variance to avoid problems associated with some measurement having large values and others with small ones, where is the sample size and is the number of the measured variables. By applying PCA, the matrix is decomposed into the summation of cross products of score vectors and loading vectors , that is:
where and are the th score vector and loading vector respectively, and each is a unit vector; is called the score matrix and , an orthogonal transformation matrix, is called the loading matrix. Both score vectors and loading vectors are orthognals. If is sorted in decrease according to its length, namely , the first principal component explains the greatest amount of variability. The first loading vector defines the direction of the greatest variance, does the second greatest variance, and so on. Therefore, the full principal components decomposition of can be given as:
If only the first () principal componets are kept, the Eq. (1) can be rewritten as:
where is a matrix of residuals which represents the variability corresponding to process noise. composed of the first loading vectors is usually called the PCA model. Using , an original -dimensional space is transposed into two orthogonal subspaces: the -dimensional principal subspace and the -dimensional residual subspace . Their relationship can be expressed as:
Once the PCA model is built via the singular value decomposition (SVD), a new measured vector at th sampling time can be mapped into the principal subspace, and corresponding score vector is given as following:
So, the estimated value of , , is:
Therefore, the estimation error is obtained by:
When monitoring if a system is normal by PCA based method, Hotelling statistic in principal subspaces and SPE statistic (also known as statistic) in residual subspace are used. The statistic and the SPE statistic of the th new sample are respectively represented as:
where is an -by- the diagonal matrix composed of the first eigenvalues of the matrix . statistic reflects changes of variables through fluctuation of principal component vector module of the PCA model. SPE is the sum of errors between the data and its estimates, so it describes the deviation degree of the measured value not to be captured by the PCA model at a certain time. In general, as long as one or both of the two statistics exceeds their own control limits, the system is out control. In other words, some fault occurs.
2.2. Dynamic principal component analysis
In general, static monitoring, such as PCA-based method, doesn’t function well for auto-correlated data. So, the dynamic PCA (DPCA) is developed to handle the process measurements with dynamic relationship [25]. The difference between DPCA and PCA is mainly reflected in the composition of modeling data. In DPCA, when the data are stacked with the current observation vector and the previous observations, the modeling data matrix is formed as:
where is the -dimensional observation vector at time point ; is the observation vector at time point -. The rest of the process of building the DPCA model is the same as that of PCA. The residuals of the DPCA model are much more uncorrelated than those of the traditional statistic PCA model. This means that DPCA is much better than the traditional static PCA in detecting the fault occurrence from serially correlated data.
3. Fault indicator based on DPCA
3.1. Fault indicator
As the previous section described, SPE statistic reflects how well each sample conforms to the PCA model, and statistic is a measure of the variation of each sample within the PCA model. Although, preliminary research results indicated that SPE statistic, rather than statistic, could be used to monitor the rolling bear by vibration analysis, the types of faults cannot be identified by only these two statistics. Hence, aiming at directly monitoring and diagnosing faults of the gear, a new fault indicator is proposed based on two statistics. In addition, the vibration signals in each direction may contain information that reflects the fault characteristics. Therefore, in order to improve the accuracy of fault detection and diagnosis, a tri-axis acceleration sensor is used to collect radial-direction, axial-direction and rotational vibration signals denoted as .
As we all know, the vibration signals of rotating parts, such as gear and bearing, are periodic and non-stationary, which leads to values of and SPE is not as smooth as ones of the stationary process, such as Tennessee Eastman (TE) process in chemical industry. According to the characteristics of gear vibration signals and the properties of these two statistics, the fault indicator of the th sample, , can be defined as:
where, is the number of subgroups. That is, each sample is divided into equal parts. and are respectively the values of and SPE of the th subgroup in th sample. It can be seen that the fault indicator describes the distribution characteristics of two statistics in the two-dimensional feature space and overcomes the fault cannot be effectively diagnosed by and SPE because of overlapping of their range. For different faults, there are obvious differences in their distributions. Hence, a fault can be detected and diagnosed by monitoring FI.
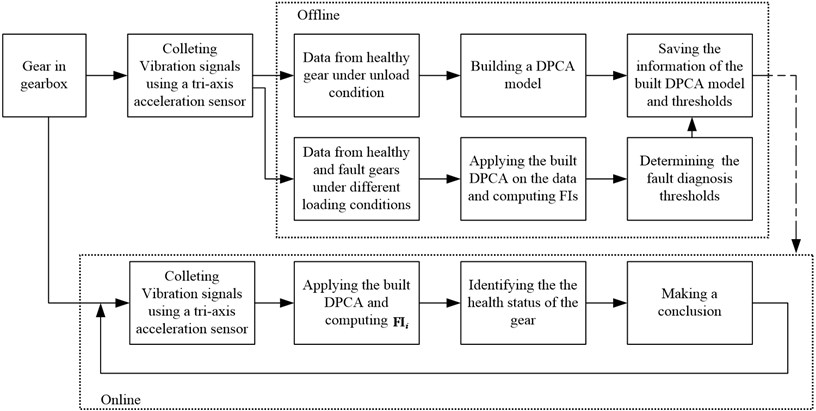
The overall strategy of the proposed approach is summarized in Fig. 1. It mainly includes two phases: offline building and online applying.
3.2. Offline building DPCA model
As shown Fig.1, two major tasks need to be completed in offline modeling phase. One is to build the DPCA model which is developed to obtain two statistics as the features of the gear. The other is to determine the fault diagnosis thresholds which can be used to distinguish the fault types of the gear.
The main steps of offline building the DPCA model are summarized as follows:
Step 1: Acquire 3-D vibration signals when the gear without any faults is operated under the unload condition.
Step 2: Determine the size of a sample and the number of subgroups . That is to say, each sample with points is equal divided subgroups without overlap. Each subgroup has points. Hence, a th vector belonging to the th sample is organized in the following form:
If there are samples, according to Eq. (10), an -by-3 building data matrix is given by:
Fig. 1The strategy of the proposed approach
Obviously, each row of is the measurement variables with a time-lagged window .
Step 3: Compute the sample mean vector and the sample standard deviation vector . Then, normalize to become a matrix with zero mean and unit variance using and .
Step 4: Apply PCA to . A DFCA model of the gear system, denoted as , is built after determining the number of principal componets .
Step 5: Save the information of the DPCA model, including the loading matix , and .
When there are clear distinctions among the different faults, the threshold based diagnosis method can be used to certain the fault types. So, the second work that needs to be done offline is to set the fault diagnosis thresholds. Three-sigma (3) quality level translates to a process yield of 99.73 % under the assumption of normality. That it is:
So, can be set as the fault warning threshold (FWT) to detect whether any failure occurs. The FWT can be computed based on the FIs of the healthy state:
where, and are the mean and variance of the fault indicators of health state. If FIs of the vibration signals are greater than a fault warning threshold, it can say there is a fault.
3.3. Online fault monitoring and diagnosing via FI
Once the DPCA model and the thresholds are determined, the gear can be online monitored and diagnosed. The central idea in online fault monitoring and diagnosing using the FI is summarized as follows:
Step 1: Download the information of the DPCA model and the fault diagnosis thresholds.
Step 2: Acquire 3-D vibration signals in real time. Each sample has points.
Step 3: Obtain new subgrups according to Eq. (12) and scale respectively them with and which were obtained at offline modeling phase.
Step 4: Apply DPCA model on each scaled subgroups to obtain and () according to Eqs. (8-9).
Step 5: Compute FI value of the current sample according to Eq. (11).
Step 6: Determine the gear state via the thresholds. Namely, detect and diagnose for the running gear.
Step 7: Return Step 2 and monitor the gear at the next new samples.
4. Experimental results
4.1. Fault simulation rig and 3D vibration data collection
In this section, to evaluate the performance of the proposed method, the experiments were carried out at a QPZZ-II rotating machinery fault simulation rig as shown in Fig. 2, which manufactured by Jiangsu Qianpeng Diagnosis Engineering Co., Ltd. The gear test part of the QPZZ-II rig is made of a gearbox, a 5 Nm (Rated Torque) and 0.5A (current) magnetic powder brake (MPB), a 0.55 kW power and 1450 rpm (Rated Speed) AC motor and a speed and load controller. Here, the controller is not shown in Fig. 2. The gearbox has a 55-tooth pinion (driving gear) and 75-tooth wheel (driven gear), which modules both are 2 mm. As shown in Fig. 3, the root-crack fault (RCF) and the one tooth-broken fault (TBF) were introduced into driven gear using the electron discharge machining (EDM) method. So, the driven gear has three conditions including healthy gear (HG).
Fig. 2QPZZ-II Rotating machinery fault simulation rig
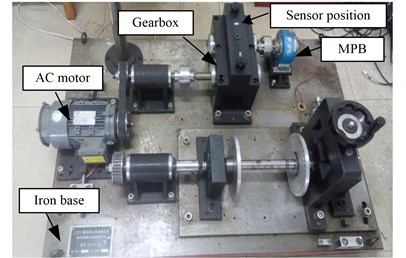
The hardware of the data acquisition system mainly includes an 8-slot NI CompactDAQ Ethernet chassis (cDAQ-9188XT), a NI 9234 dynamic signal acquisition module, a B&K 4056 tri-axis acceleration sensor and a laptop. The data acquisition software was programmed by the National Instruments Labview.
The data sampling frequency was set as 5.12 kHz. The radial load for the gear box was respectively set as unload, 50 % load and full-load. The tri-axis acceleration sensor was placed on the top of the driven gear of the gearbox to acquire the gear’s radial-direction, axial-direction and rotational vibration signals.
Fig. 3Test gears with faults
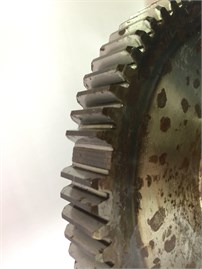
a) One tooth broken
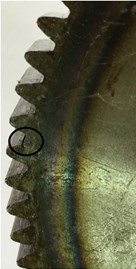
b) Tooth root crack
4.2. The results and analysis using fault indicator based on 3D vibration signals
Here, the time-domain waveforms of the raw three-direction vibration signals of all gear conditions under unload condition are respectively plotted in Figs. 4-6 when the rotation speed of AC motor was 1450 rpm.
Vibration signals of the healthy gear under unload condition at 1450 rpm are selected to build the DPCA model. Each 1024 sampling points are as a group. At the same time, a group is divided into 16 sub-groups in order to construct the modeling data set again. Obviously, each sub-group has 64 sampling points. There are 60 groups. Namely, 60, 1024, 16 and 64. So, a 960-by-192 building data matrix is obtained. After applying PCA, the original space with 192 dimensions is decomposed into a 52-dimensional principal subspace and a 140-dimensional residual subspace. After modeling, the fault warning threshold (FWT) is determined to be 1.1558 according to Eq. (15). If the fault indictor is greater than 1.1558, a fault occurs in the gear.
Fig. 4Three-direction vibration signals from a good gear
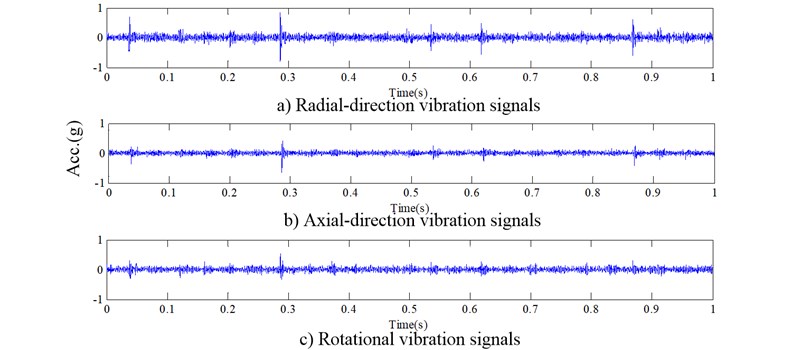
Fig. 53D vibration signals from a root crack gear
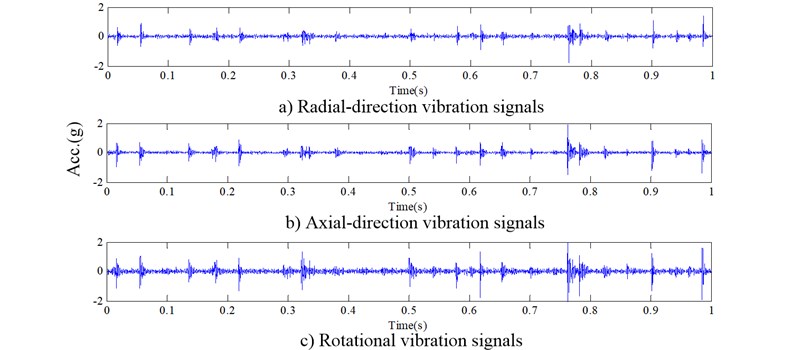
Fig. 63D vibration signals from a tooth broken gear
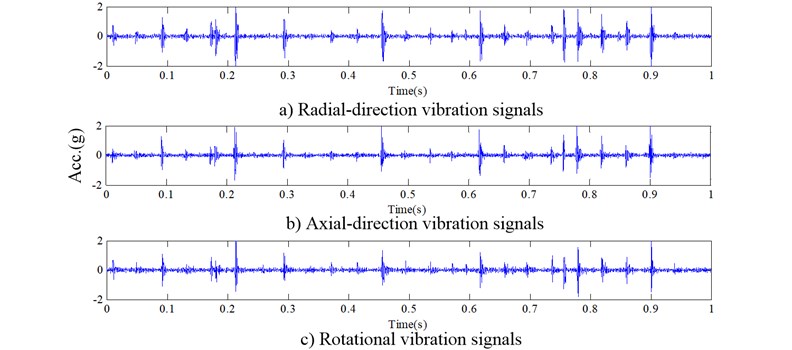
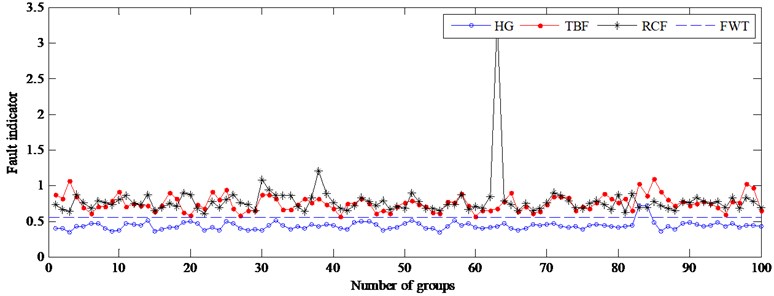
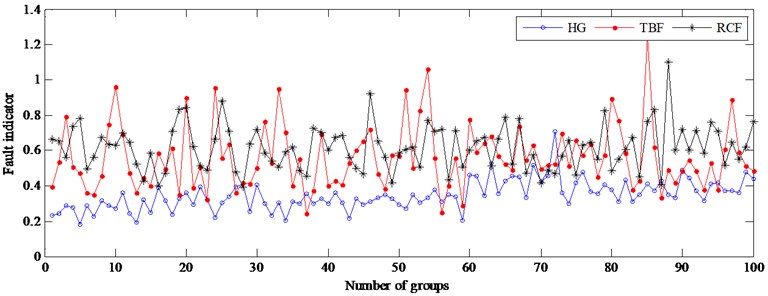
Fig. 7Fault indicator of testing samples under unloading at 1450 rpm
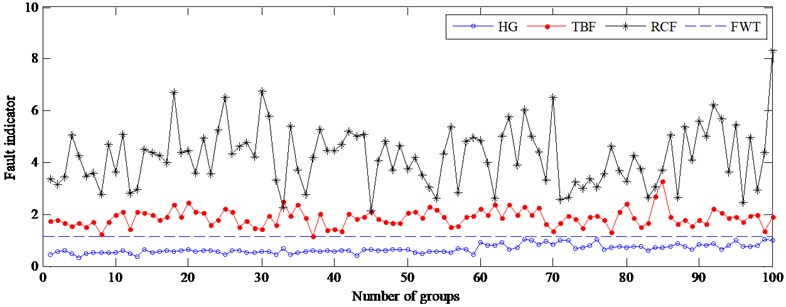
In order to test the proposed method affected by load changes, the testing samples of three gear states operated three different loading conditions at 1450 rpm are used. Fault indicators under unloading condition are calculated and plotted in Fig. 7. In this figure, lines with ‘o’, ‘*’ and ‘·’ indicate that the values of fault indicators come from a healthy gear, a gear with RCF and a gear with TBF, respectively. As shown in Fig. 7, faults are easily detected by the fault warning threshold (see the long dashed line in Fig. 7), and the accuracy reaches 100 %. To identify the types of faults, another threshold is determined based on the fault indicators of TBF since there is clear boundary between two faults. In this work, it is 2.5290. Table 1 lists the fault detection rates and fault recognition rates of testing data under all the loading conditions. As seen in Table 1, overall accuracy of fault detection is up to 100 %, and fault diagnosis rate of two faults is greater than 96 %. So, the proposed method is effective and robust to load variations.
Table 1Fault detection rate (%) and fault diagnosis rate (%) under different loading conditions
Unloading 1450 rpm | 50 % loading 1432 rpm | Full loading 1417 rpm | Overall | |||||
Detection | Diagnosis | Detection | Diagnosis | Detection | Diagnosis | Detection | Diagnosis | |
HG | 100 | 100 | 100 | 100 | ||||
RCF | 100 | 97 | 100 | 95 | 100 | 97 | 100 | 96.33 |
TBF | 100 | 98 | 100 | 98 | 100 | 96 | 100 | 97.33 |
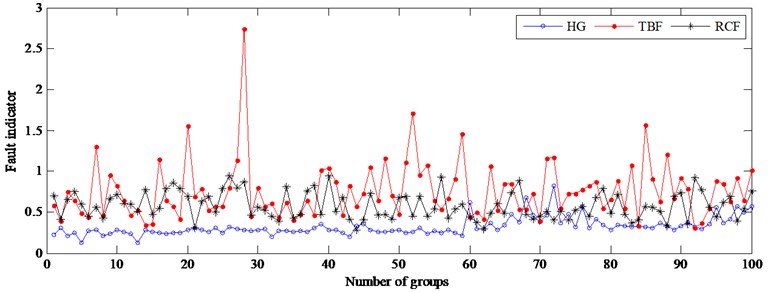
Further, the vibration data at 1305 rpm, 1160 rpm, 1015 rpm, 870 rpm and 725 rpm are used to test the proposed method. Figs. 8-12 give the results at different driven speeds using the model built at 1450 rpm. Fig. 8 shows that the accuracy of gear health monitoring is up to 100 %, and TBF’s and RCF’s diagnose accuracies are respectively 92 % and 82 %. The result suggests that the fault of the gear can be diagnosed effectively by the fault indicator when the speed is reduced by 10 %. When the speed is reduced by 20 % and 30 %, although the failure types cannot be effectively diagnosed, as shown in Figs. 9-10, only 1 % of testing samples is not correctly monitored by FWT. The failure of gear can still be detected by resetting FWT (0.5498) when the speed drops to a lower level (see Figs. 11-12). So, the DPCA model at 1450 rpm can be used to monitor the health of gears at different speeds.
Fig. 8Fault indicator of testing samples at 1305 rpm
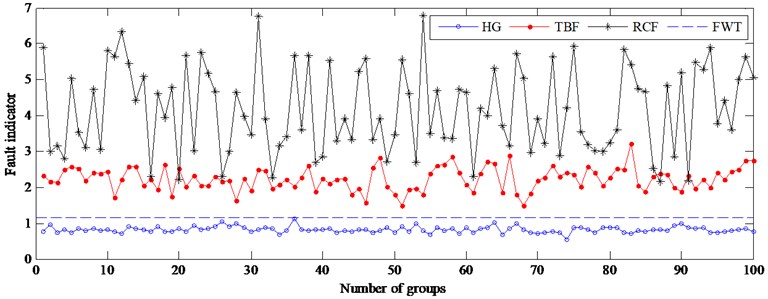
Fig. 9Fault indicator of testing samples at 1160 rpm
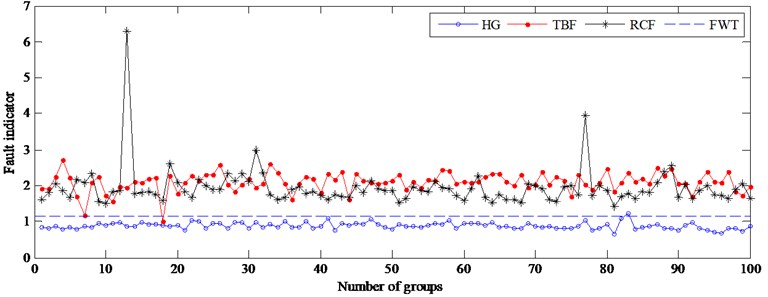
Fig. 10Fault indicator of testing samples at 1015 rpm
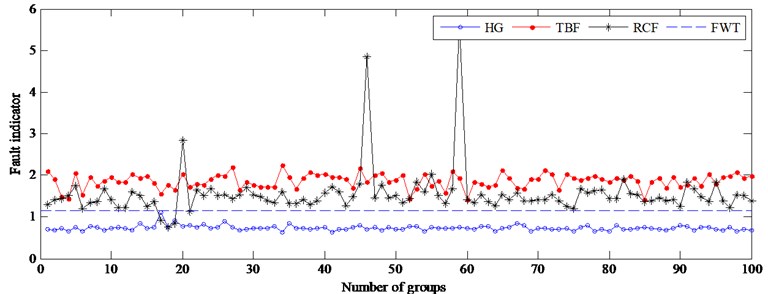
Fig. 11Fault indicator of testing samples at 870 rpm
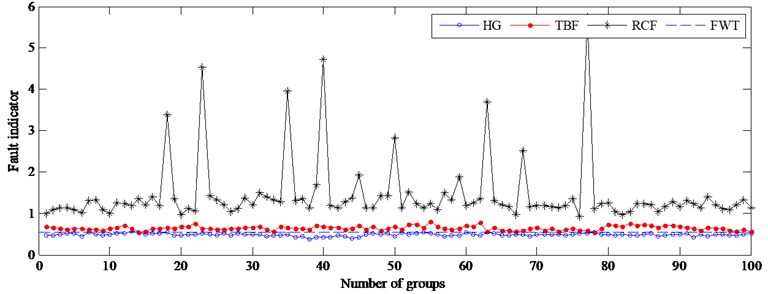
Fig. 12Fault indicator of testing samples at 725 rpm
The proposed method is of less computation, and its average elapsed time for making fault detection only is 0.0047 second. In contrast, EMD spends 0.3402 second in processing a sample with 3×1024 points. And VMD needs 0.6387 second to get 6 modes. The proposed method greatly reduces the computation time comparing with EMD-based and VMD-based so that it can be applied to real-time fault detection.
4.3. Compared with traditional DPCA based method
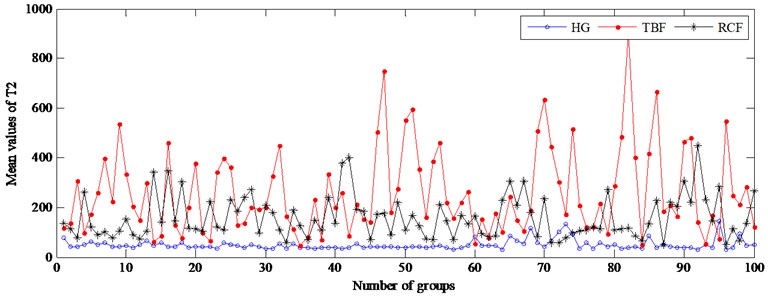
For the purposed of comparison, the traditional control limit monitoring method using statistic and SPE statistic is used to determine whether faults are present. There are two cases to consider: one is to monitor the gear based on and SPE statistics of each subgroup with 64 points, the other is based on the statistics of each group with 1024 points. Detailed determining method of control limits of two statistics can be found in Ref. [22].
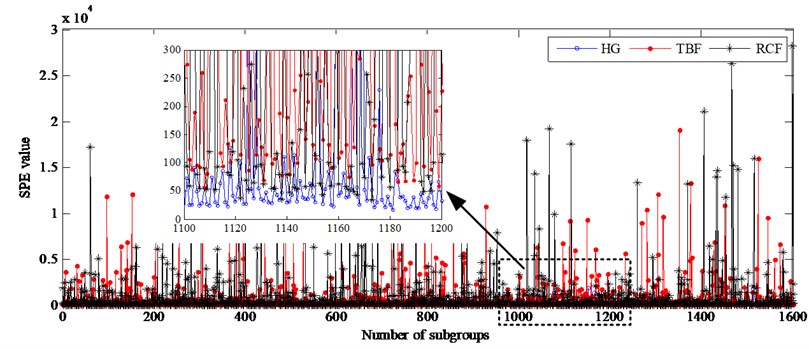
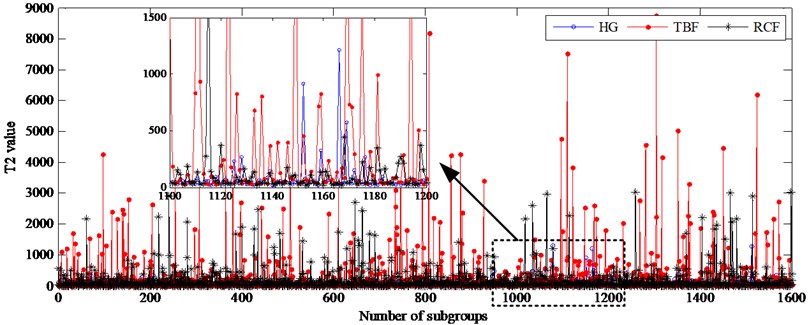
For the first case, SPE statistic and statistic of 1600 subgroups for all gear conditions are shown in Fig. 9. Here, 95 % and 99 % control limits of statistic are respectively 82.7132 and 72.4265. 95 % and 99 % control limits of SPE statistic are respectively 44.0892 and 39.0683. As the two charts show, it can be observed that the statistic cannot detect whether the gear is failure using the method of control limit because almost all values of the tooth broken gear and most values of the crack fault gear both are within its control limits. At the same time, the SPE statistic is also not suitable to monitor the running state of gear because it will lead to a higher false alarm rate. As a consequence, monitoring gear states by mean of each subgroup’ two statistics doesn’t work well and it is invalid for gear fault detection and diagnosis.
In the second case, the SPE’s mean and the ’s mean value of each group including 16 subgroups replace its subgroup’s SPE and values, and the corresponding results are shown in Fig. 13.
Fig. 13Two statistics of the subgroups under unload condition at 1450 rpm
a) SPE statistic
b) Hotelling statistic
Fig. 14 shows that the performance of fault detection can be improved significantly using the mean of SPE, and the can also monitor the gear running state. However, by the mean values of two statistics, fault reasons cannot be directly identified due to the similar distribution characteristics of the tooth broken fault and the root crack fault. In other words, the kinds of gear faults cannot be distinguished using SPE statistic. Therefore, the mean of SPE can effectively monitor the health of the gear, but cannot be used to identify the types of faults.
Fig. 14The mean values of two statistics of each group under unload condition at 1450 rpm
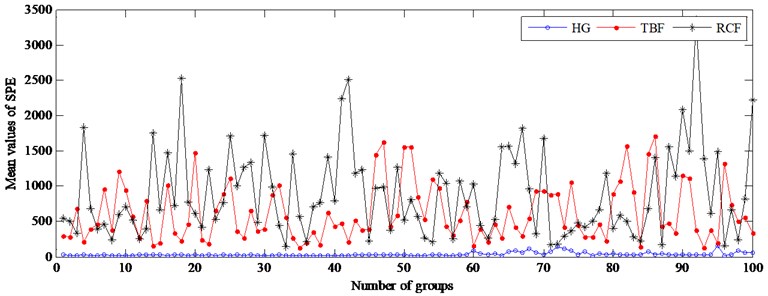
a) SPE statistic
b) Hotelling statistic
4.4. Compared with the proposed method using single direction signals
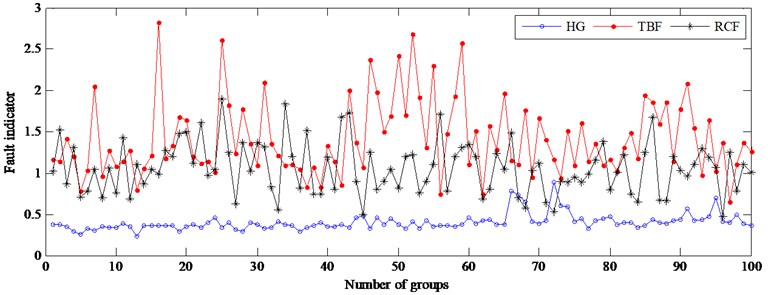
Furthermore, in order to verify the superiority of FI based method using tri-axis vibration signals, the same building and testing data are used to construct 3 DPCA models only using each direction signals. All the FIs of testing samples are computed and the corresponding results are displayed in Fig. 15.
Fig. 15(a) shows that HG and TBF are completely separated, but there are overlaps between RCF and HG, between RCF and TBF. Under unload condition, the overlaps between RCF and HG is the most serious so that RCF doesn’t discern from HG. So, the monitoring and diagnosis of the gear cannot be realized only using radial-direction signals. In Fig. 15(b) and Fig. 15(c), the discrimination between HG and the other faults is obviously improved, but there are still serious overlaps between RCF and TBF. The above experimental results show the FIs based on only one direction vibration signals can’t be used to diagnose the gear faults.
Fig. 15The fault indicator of testing samples using one direction vibration signal at 1450 rpm
a) The results using radial-direction vibration signals
b) The results using axial-direction vibration signals
c) The results using rotational vibration signals
5. Conclusions
Vibration analysis is a reliable method for gear fault monitoring and identification. Compared with the most commonly used single-axis acceleration sensor, the tri-axial vibration sensor can capture higher frequency stress wave activity from different directions that is beneficial for detecting impacting, fatiguing and friction. DPCA is a multivariate feature extraction and monitoring technology which can deal with the process measurements with dynamic relationship. In order to online monitor and diagnose gear faults more accurately and effectively, hence, a novel fault indicator based on DPCA theory was proposed in this paper. Unlike the most methods, the 3D vibration signals are used in the proposed method. Here, the DPCA model was developed to obtain SPE statistic and statistic from 3D vibration signals. The fault indicator which organically combines the two statistics is computed to indicate the gear states. The main advantages of the proposed method include the following: Just by monitoring the value of FI, the health state and fault types of gear can directly be identified without the aid of other classification methods; the proposed method is not affected by the load fluctuation; it achieves online applications because it takes less computation time. The proposed method was verified by the QPZZ-II Rotating machinery fault simulation rig. Comparison results indicate that the proposed method has a better diagnostic performance.
References
-
Henríquez Patricia, Alonso Jesús B., Ferrer Miguel A., Travieso Varlos M. Review of automatic fault diagnosis systems using audio and vibration signals. IEEE Transactions on Systems, Man, and Cybernetics: Systems, Vol. 44, Issue 5, 2014, p. 642-652.
-
Huang N. E., Shen Z., Long S. R., Wu Shih M. C. H. H., Yen N. C., Tung C. C., Liu H. H. The empirical mode decomposition and the Hilbert spectrum for nonlinear and non-stationary time series analysis. Proceedings of the Royal Society A: Mathematical, Physical and Engineering Sciences, Vol. 454, Issue 1971, 1998, p. 903-995.
-
Amarnath M., Praveen Krishna I. R. Empirical mode decomposition of acoustic signals for diagnosis of faults in gears and rolling element bearings. IET Science, Measurement and Technology, Vol. 6, Issue 4, 2012, p. 279-287.
-
Li Ruoyu, He David Rotational Machine health monitoring and fault detection using EMD-based acoustic emission feature quantification. IEEE Transactions on Instrumentation and Measurement, Vol. 61, Issue 4, 2012, p. 990-1001.
-
Zhu Qibing, Yang Huizhong Extraction of fault feature in gear system based on convolution type of wavelet packet transform and singular value decomposition. 27th Chinese Control Conference, 2008, p. 21-24.
-
Shen Fei, Chen Chao, Yan Ruqiang, Gao Robert X. Bearing fault diagnosis based on SVD feature extraction and transfer learning classification. Prognostics and System Health Management Conference (PHM), 2015, p. 1-6.
-
Mohanty A. R., Kar C. Fault detection in a multistage gearbox by demodulation of motor current waveform. IEEE Transactions on Industrial Electronics, Vol. 53, Issue 4, 2006, p. 1285-1297.
-
Cusidócusido Jordi, Romeral Luis, Ortega Juan A., Rosero Javier A., Garcíagarcia Antonio Espinosa Fault detection in induction machines using power spectral density in wavelet decomposition. IEEE Transactions on Industrial Electronics, Vol. 55, Issue 2, 2008, p. 633-643.
-
Ayad Mouloud, Chikouche Djamel, Boukazzoula Nacereddine, Rezki Mohamed Search of a robust defect signature in gear systems across adaptive Morlet wavelet of vibration signals. IET Signal Processing, Vol. 8, Issue 9, 2014, p. 918-926.
-
Dragomitetskiy Konstantin, Zosso Dominique Variational mode decomposition. IEEE Transactions on Signal Processing, Vol. 62, Issue 3, 2014, p. 531-544.
-
Zhang Dong, Feng Zhipeng Application of variational mode decomposition based demodulation Analysis in gearbox fault diagnosis. IEEE International Instrumentation and Measurement Technology Conference Proceedings, 2016, p. 1-6.
-
Tang Guiji, Wang Xiaolong, He Yuling, Liu Shangkun Rolling bearing fault diagnosis based on variational mode decomposition and permutation entropy. 13th International Conference on Ubiquitous Robots and Ambient Intelligence, 2016, p. 626-631.
-
Ahmed Ryan, Sayed Mohammed El, Gadsden Andrew S., Tjong Jimi, Habibi Saeid Automotive internal-combustion-engine fault detection and classification using artificial neural network techniques. IEEE Transactions on Vehicular Technology, Vol. 64, Issue 1, 2015, p. 21-33.
-
Mustafa Yuzukirmizi, Hakan Aralan, Oznur Duman Multivariate statistical methods for detection of spur gear faults. Journal of Mechanical Engineering Science, Vol. 229, Issue 14, 2015, p. 2586-2598.
-
Sirovich L., Keefe L. Low dimensional procedure for characterization of human faces. Journal of the Optical Society of America, Vol. 4, Issue 3, 1987, p. 519-524.
-
Jackson Edward J., Govind Mudholkar S. Control procedures for residuals associated with principal component analysis. Technometrics, Vol. 21, Issue 3, 1979, p. 341-349.
-
Jackson Edward J. A User’s Guide to Principal Components. John Wiley Sons, New York, 1991.
-
Xi Jianhui, Han Yanzhe, Su Ronghui New fault diagnosis method for rolling bearing based on PCA. The 25th Chinese Control Decision Conference, 2013, p. 4123-4127.
-
Qiao Feng, Zhang Bo, Li Fang Based on PCA and HTM gear fault diagnosis research. Journal of Vibration and Shock, Vol. 33, 2014, p. 461-463.
-
Arnaz Malhi, Robert X. Gao. PCA-based feature selection scheme for machine defect classification. IEEE Transactions on Instrumentation and Measurement, Vol. 53, Issue 6, 2004, p. 1517-1525.
-
Jiname Harmouche, Claude Delpha, Demba Diallo Improved fault diagnosis of ball bearings based on the global spectrum of vibration signals. IEEE Transactions on Energy Conversion, Vol. 30, Issue 1, 2015, p. 376-383.
-
Jiang Liying, Fu Xinxin, Cui Jianguo, Li Zhonghai Fault detection of rolling element bearing based on principal component analysis. The 24th Chinese Control and Decision Conference, Taiyuan, 2012, p. 2956-2960.
-
Jiang Liying, Liu Zhipeng, Cui Jianguo, Li Zhonghai Condition monitoring of rolling element bearing based on Phase-PCA. The 25th Chinese Control and Decision Conference, 2013, p. 1082-1086.
-
Huang Dshan, Wang Xushuai, Li Peng, Gu Jingjun Study on three-directional vibration measurement technology for rolling bearings. Bearing, Vol. 5, 2016, p. 40-41.
-
Ku Wenfu, Storer Robert H., Georgakis Christos Disturbance detection and isolation by dynamic principal performance. Chemometrics and Intelligent Laboratory Systems, Vol. 30, 1995, p. 179-196.
About this article

The authors gratefully acknowledge the financial supports by the Science Foundation of Aeronautics of China under Grant Number 20153354005.
