Abstract
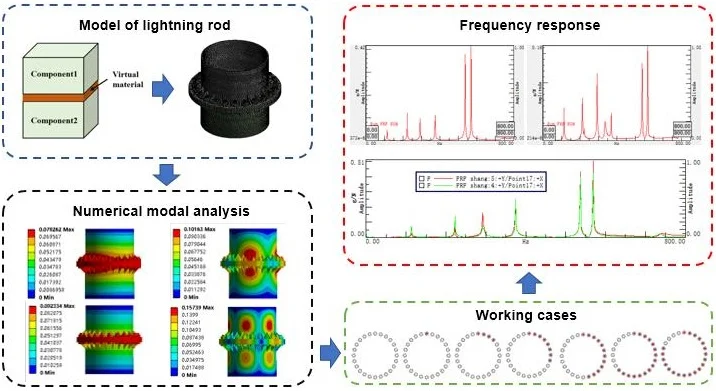
Lightning rods are effective to prevent lightning damage in power systems. However, under the influence of severe weather conditions, they often face failure problems, mainly manifested as tilt and fracture caused by bolt loosening which can result in significant economic losses. Therefore, it is very meaningful to detect the loosening of the lightning rod. The vibration-based method is an effective method for bolt loosening detection and is suitable for use on large lightning rods. This paper built a finite element model of the lightning rod Flange-Bolt Structure Unit (FBSU) based on the virtual material method, designed an effective acquisition test of the vibration signal under different loosening conditions of the lightning rod FBSU. The experimental results showed that it was effective to establish the dynamic model of the lightning rod FBSU by using the virtual material method. According to the measured vibration signal, the frequency response function was obtained by TIME MDOF method, and the preliminary judgment of bolt loosening can be realized. This study lays the foundation for the precise positioning and the extent of loosening detection of lightning rod bolt loosening, and also provides a guideline for the vibration test design of large bolted structures similar to lightning rods.
Highlights
- The finite element model of the lightning rod Flange-Bolt Structure Unit (FBSU) based on the virtual material method is built both in the tightened and loosened state.
- An effective acquisition test of the vibration signal under different loosening conditions of the lightning rod FBSU is designed.
- The effectiveness of virtual material method modeling of FBSU is verified by experimental modal analysis.
- The preliminary judgment of bolt loosening can be realized by the analysis of the measured vibration signal.
1. Introduction
Lightning rods are effective to prevent lightning from causing harm to the power grid. Traditional lightning rods adopt a lattice structure scheme, with the improvement of processing technology in recent years, the single-rod steel tube independent lightning rods became widely used in transmission lines. However, the change in the structure of the lightning rod does not eliminate the impact of bad weather and other unfavorable conditions on itself. Especially in strong wind conditions, large lightning rods of up to 20-50 m swing to produce alternating loads and vibration, resulting in loosening of the flange fastening bolts. As the damage continues to increase, the lightning rod collapses eventually [1, 2]. The failure and maintenance of the lightning rod of the power grid will cause huge economic losses. The early bolt loosening detection of large lightning rods is of great importance.
At present, many researchers have used direct methods and indirect methods to study the detection of bolt loosening. Direct methods like measuring the strain change directly and thus detect the bolt pre-tightening force [3]. Direct method has a relatively low accuracy rates, therefore the indirect detection methods are more widely studied [4]. Electrical impedance technology and electro-mechanical impedance technology [5] is a hot topic in the study of bolt loosening detection, it is widely studied theoretically and experimentally. The theoretical analysis [6], numerical simulation [7], simplified model [8], measurement system [9] and experiment are investigated. The most obvious shortcoming of this method is that it requires too many sensors, which is difficult to achieve in practical testing. Vision-based method is another indirect measurement method for bolt loosening detection. By identifying the angle of rotation of the bolt to recognize whether the bolt is loosened, it can be realized by a consumer digital camera and a smart phone camera [10, 11]. Related researchers have proposed image feature tracking algorithm, deep learning algorithm, binocular vision and other auxiliary strategies to enhance the ability of bolt loosening recognition, but vision-based method is still difficult to identify the small bolt loosening and bolt loosening early torque reduction [12-14]. For the reduction of the pre-tightening force at the initial stage of bolt loosening, the ultrasonic-based method is an effective indirect method. The virtual time inversion guided wave method [15] and improved guided wave time inversion method [16] are developed for bolt loosening identification. However, the ultrasonic method is more suitable for the monitoring of small structures, and it is difficult to apply to a large structure such as a lightning rod. There are also bolt loosening monitoring methods based on audio, energy loss and radio frequency, but these methods have certain limitations applying to large lightning rods [17-19]. In addition, there is a method suitable for bolt loosening detection of large lightning rods, that is, the vibration-based method. The vibration-based method is simple both theoretically and operationally, and relatively more cost-effective than other methods [4]. Hand hammer excitation is a traditional vibration excitation method, laser excitation [20] may produce ideal impact and resulting in better reproducibility and reliability. He et al. [21, 22] used the change of natural frequency combined with the search algorithm to detect the bolt loosening of small lightning rod, and proposed to detect the bolt loosening by natural frequency change of the first several elastic modes of the pipeline. Tang et al. [23, 24] investigated the nonlinear vibration behavior of bolted joined cylindrical-cylindrical shell based on Sanders’ shell theory, proposed new models which contributed to the vibrational detecting technic for bolts loosening. The results of vibration-based bolt loosening test have certain applicability to the loosening of large lightning rods. However, the dynamic modeling of large lightning rods and the effective acquisition of vibration signals remain to be further studied.
The modeling and mechanical analysis of the traditional towers, masts in the power transmission system by earlier researchers provided a basis for the modeling of the rod lightning rod [25, 26]. Even with this foundation, it is still difficult to perform complete dynamic modeling of large lightning rods. Since the lightning rod is composed of a plurality of Flange-Bolt Structure Unit (FBSU), the dynamics modeling of FBSU can be approximated to simulate the overall dynamic characteristics. When modeling and simulating FBSU, it is necessary to consider the influence of the joint interface. The simplest method of joint interface treatment is the adhesion method, which means that the flange-bolt joint is directly adhered, it is equivalent to ignoring the influence of the joint interface, and the error is large. The multi-point constraint method [27] ignores the stiffness and damping coefficient between the joint interface, and has a great simplification effect on the joint, but it cannot correctly describe the mechanical characteristics. The spring damping method [28] considers the stiffness and damping coefficient between the joint interface, but it takes too much cost to determine the two parameters. Compared with the previous method, the virtual material method [29] has better versatility, high precision and less time-cost, and has been well applied to bolt joint interface modeling [30-32]. Therefore, this paper used the virtual material method to model the flange-bolt joint interface.
The effective acquisition of the vibration signal is the foundation for bolt loosening detection by the vibration-based method. Through effective measurement, the effective vibration signal of the lightning rod FBSU is obtained, and the subsequent signal processing is performed to characterize the bolt loosening. In this paper, the multi-point measurement model of the vibration signal of the flange bolt structural unit is given, and the frequency response function is obtained by the time multiple degrees of freedom method (MDOF). The loosening of the bolt can be preliminarily judged by the frequency response function.
2. Modeling and simulation of FBSU
2.1. Model of bolts
The material of the fastening bolt in FBSU is carbon steel, type Q235, elastic modulus is 200 GPa, Poisson ratio is 0.3, density is 7850 kg/m3, and the finite element model of bolts is built by ANSYS software. In order to get close to the actual condition and obtain higher precision, the paper adopted the solid bolt model to establish the contact unit on the horizontal contact surface of the upper and lower flanges, the bolt head and the contact surface of the nut and the flange, which can transmit the tensile, bending and thermal loads. Establishing a threaded model can be very troublesome for pre-processing and solving. Therefore, when modeling a bolt finite element, the thread is simplified and the equivalent cylindrical area is taken. The bolt pre-loading method is directly added to the cylindrical surface of the bolt with the bolt pretension command.
2.2. Virtual material method
The virtual material method is equating the joint interface with a layer of virtual material, as shown in Fig. 1, but in fact this material does not exist, the mechanical properties of the joint interface is simulated by changing the density, Poisson ratio and elastic modulus of this layer of virtual material.
Fig. 1Equivalent layer of virtual material
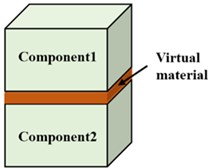
The virtual material method can establish the dynamic model by the elastic modulus, density and Poisson ratio of the two connecting members, as well as the surface roughness and the bolt pre-tightening force. The elastic modulus of the virtual material layer can be calculated by the Eq. (1) [29]:
The Poisson ratio can be calculated by the Eq. (2):
The density can be calculated by the Eq. (3):
where represents the fractal dimension; represents the domain extension factor for microcontact size distribution only associated with ; represents the equivalent elastic modulus; represents the fractal roughness parameter; represents the maximum contact area of the micro-protrusion; represents the critical contact area of the micro-protrusion; represents the equivalent Poisson ratio; represents the dimensionless virtual material elastic modulus; represents the dimensionless virtual material shear modulus; , represents the density of the two connected materials; , represents the thickness of two connect members. and are determined by and respectively. and are the surface roughness of surface 1 and 2.
2.3. Complete finite element model of FBSU
The ANSYS software is used to build the complete finite element model of FBSU. The solid model consists of four parts: upper and lower bodies, fastening bolts and virtual material layers. There are virtual material layers locate in joint interface between bodies and bolts, also in joint interface between upper and lower bodies. The material of the upper and lower bodies is Q235B, the elastic modulus is 200 GPa, the Poisson ratio is 0.3, and the density is 7850 kg/m3. The upper and lower bodies are locked by 24 positionally symmetrical fastening bolts, and a pre-tightening force of 25562 N is applied to each fastening bolt. The elastic modulus of the virtual material layers is 216.6 GPa and the Poisson ratio is 0.28. The overall finite element model is shown in Fig. 2(a). The finite element model after meshing is shown in Fig. 2(b).
Fig. 2Overall finite element model and meshing of FBSU: a) overall finite element model, b) meshing
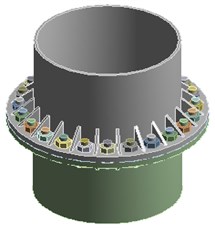
a)

b)
2.4. Simulation results of finite element model
Fig. 3 shows the first 8 non rigid body modes of FBSU under no restraint. When processing the corresponding vibration mode diagram, since the flange connection structure analyzed is symmetrical, the natural frequency and vibration mode of every two orders are the same, and only one type of vibration mode is listed. It can be seen from Fig. 3 that the corresponding vibration modes are different at different natural frequencies, and the resulting low-order mode has a larger deformation at the flange bolt connection. Numerical modal analysis of FBSU was performed. Setting the contact relationship and adding the constraint condition, the pre-load force on the 24 bolts is 25562 N, and the first 14 natural frequencies when the FBSU model is unconstrained are shown in Table 1.
Table 1The first 14 natural frequencies of FBSU
Mode | Frequency / Hz |
1-6 (rigid body mode) | – |
7 | 125.36 |
8 | 125.45 |
9 | 261.50 |
10 | 261.60 |
11 | 425.61 |
12 | 425.62 |
13 | 516.75 |
14 | 516.77 |
Fig. 3Vibration modes of FBSU
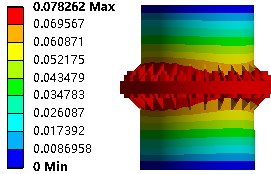
a) Mode 7 and 8
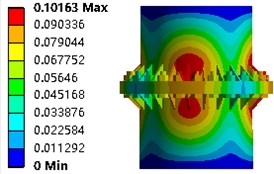
b) Mode 9 and 10
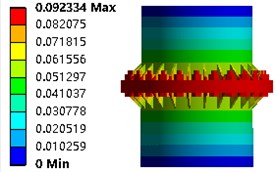
c) Mode 11 and 12
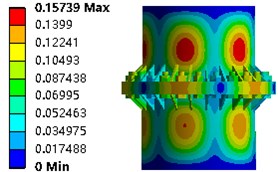
d) Mode 13 and 14
3. Experimental modal analysis of FBSU
3.1. Basic Principles of experimental modal analysis
Experimental modal analysis is a process in which the response of the system to excitation is measured experimentally after excitation. The digital signal processing is used to obtain the frequency response function, and then the non-parametric model of the forced vibration system is obtained. Parameter identification yields the modal parameters of the system, which is an inverse process of the finite element modal analysis. According to the modal theory, any two frequency response functions are different from each other, each frequency response function is extremely sensitive to the resonant frequency of the structure, and a high peak response is generated at each natural frequency, and the frequency response function is different. The superposition of each other makes the resonance peak more obvious. Therefore, by analyzing the fitting curve of the frequency response function, the various modal frequency values of the experimental structure can be identified. When dealing with practical engineering vibration problems, the comprehensive use of computational modal analysis and experimental modal analysis can provide a sufficient basis for the overall design and inspection of mechanical system structures.
3.2. Experimental setup
The experimental modal analysis was carried out on an experimental size model. The material of the test model is Q235B, the elastic modulus is 200 GPa, the Poisson ratio is 0.3, the density was 7850 kg/m3, and the upper and lower flange steel pipes were connected by 24 M30 bolts. A fixed torque wrench controls the applied pre-load.
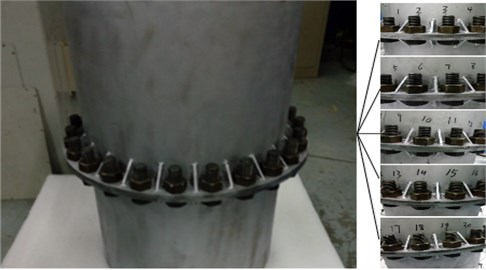
In this test, the LMS Test. Lab modal test system, which integrates data acquisition and signal processing, was used to perform modal test on the test model. Fig. 4(a) is an experimental equipment diagram, through which the modal test is performed to obtain the natural frequency and damping ratio. Eight measuring points are arranged both in the upper and lower directions in the figure. In order to obtain the overall dynamic characteristics, the measuring points were evenly arranged on the steel rod. According to the LMS experimental modal analysis process, the model of the measuring point is built in the LMS software, as shown in Fig. 4(b), the test model is excited by a steel hammer. The hand hammer consists of hammerhead, hammer cap, grip and force sensor. Since the test model is too heavy to meet the ideal state of suspension, it was placed on a soft foam during the test to reduce the influence of boundary conditions.
Fig. 4Experimental setup and measuring point model: a) experimental setup, b) measuring point model
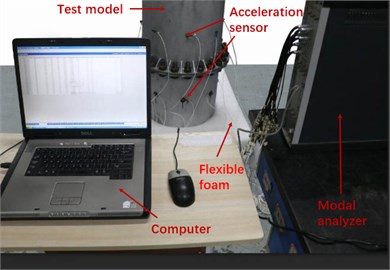
a)

b)
3.3. Verification of finite element model
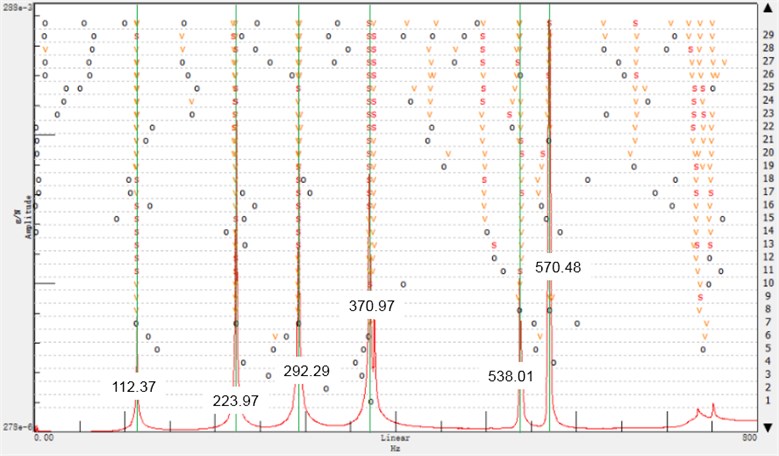
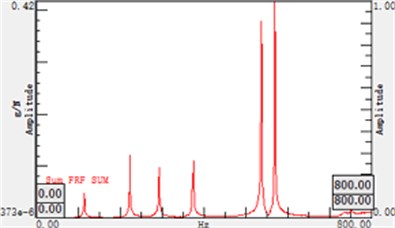
Fig. 5 shows a frequency response function and its corresponding response steady state diagram obtained by processing the vibration signal using Time MDOF method. In Fig. 5, the continues line is the frequency response function, the y label on the right is modal order, ‘v’ means that the mode vector is stable, ‘s’ means that the frequency, damping and mode vectors are stable, ‘o’ means that the pole is unstable. Since the support mode adopts soft foam, the influence of the rigid body modal frequency can be neglected. According to the modal steady state diagram, the corresponding modal frequency is selected, and the experimental modal frequency (EMF) and damping ratio (DR) of 7-14 modes are obtained after verification as shown in Table 2.
Fig. 5Response steady state diagram of FBSU by experiment
It can be seen from the data that there are errors between the simulation results and the experimental results of FBSU, according to the relative error Eq. (4):
where is the simulation results calculated by ANSYS software, and is the experimental results obtained in modal test. The calculated result is shown in Table 3. As can be seen from Table 3, the total error of the test frequency and the average percentage of the simulation frequency is substantially within 15 %.
Table 2Experimental modal frequency and damping ratio of FBSU
Mode | EMF/DR |
7 | 112.37/0.91 % |
8 | 113.26/0.47 % |
9 | 223.97/0.08 % |
10 | 292.29/0.36 % |
11 | 370.97/0.22 % |
12 | 375.97/0.16 % |
13 | 538.01/0.21 % |
14 | 570.48/0.10 % |
Table 3Comparison of experimental results and simulation results
Mode | Frequency / Hz | Error / % | |
Experiment | Simulation | ||
7 | 112.37 | 125.36 | 11.5 |
8 | 113.26 | 125.45 | 10.7 |
9 | 223.97 | 261.5 | 16.7 |
10 | 292.29 | 261.6 | –10.5 |
11 | 370.97 | 425.61 | 14.7 |
12 | 375.97 | 425.62 | 13.2 |
13 | 538.01 | 516.75 | –3.9 |
14 | 570.48 | 516.77 | –9.4 |
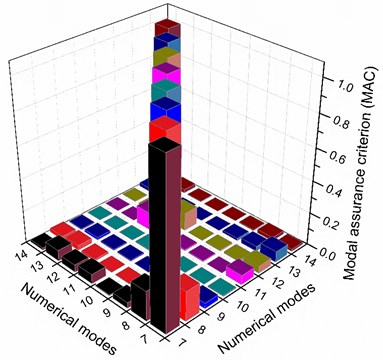
Modal Assurance Criterion (MAC) is a good tool to evaluate the intersection angle of modal vector space which can be implemented in the LMS system, the frequency dependence of each order can be used to verify the quality of the modal experiment, as shown in Fig. 6. It can be seen from the MAC histogram of Fig. 6 that the values on the diagonal of the MAC matrix are all 1, indicating that the correlation of each mode is 100 %. And the values on the non-diagonal are far less than 1, it shows that the correlation of each order mode is small and relatively independent, which can also prove that the test data is true and effective. Therefore, it can be explained that the virtual material method is effective for the modeling of the flange bolt joint interface, and the measuring point model can effectively obtain the vibration signal of FBSU.
Fig. 6MAC histogram of natural frequencies
4. Modeling and experimental modal analysis of FBSU under loosened case
4.1. Verification of finite element model
In the FBSU, after the bolt is loosened, the contact stress between the joint interface will change, and the change of the contact stress will result in changing the connection stiffness, which will affect the stiffness distribution and natural frequency of the whole system. The finite element modeling of FBSU needs to be able to effectively simulate the tightness of the bolt. When the connecting bolt set is loose, the pre-load of some partial bolts becomes zero. As the vibration of the whole structure continues to occur, the distribution force of the bolt joints caused by the loosening of some bolts is uneven, which will accelerate the loosening of the adjacent bolts, thereby causing more bolt loosening.
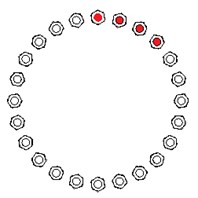
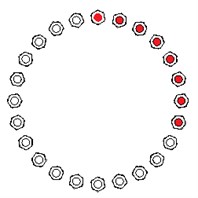
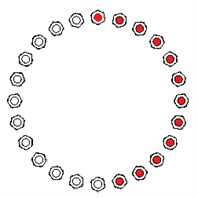
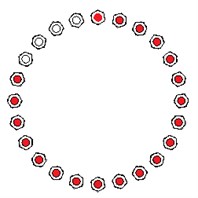
Therefore, the following seven kinds of cases are designed to simulate the early partial bolt loosening of FBSU: Case 1, All 24 bolts are fully tightened (pre-load is rated); Case 2, in a clockwise order, 1 bolt pre-load is reduced to zero, and the other 23 Tightened; Case 3, in the clockwise order, 4 bolts pre-load is reduced to zero, the other 20 are tightened; Case 4, in clockwise order, 8 bolts pre-load is reduced to zero, the other 16 are tightened; Case 5, in clockwise order, 12 bolts The pre-load is reduced to zero, the other 12 are tightened; Case 6, in 16 clockwise, the pre-load of the 16 bolts is reduced to zero, and the remaining 8 are tightened; Case 7, in the clockwise order, the pre-load of the 20 bolts is reduced to zero, and the other 4 Tighten. The different working cases are shown in Fig. 7, where red indicates loosened bolts. For different working cases, the general pre-load is different. The elastic modulus and Poisson ratio of the virtual material used in the processing of the joint interfaces are changed accordingly. The specific parameters are shown in Table 4.
Fig. 7Different working cases of FBSU
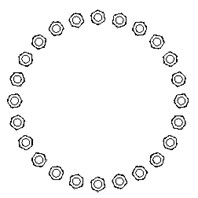
a) Case 1
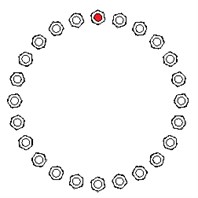
b) Case 2
c) Case 3
d) Case 4
e) Case 5
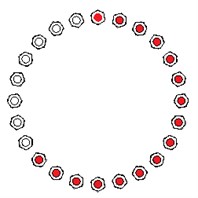
f) Case 6
g) Case 7
Table 4Parameters of virtual material under different working cases
Case | (GPa) | (kg/m3) | |
1 | 216.6 | 0.28 | 7850 |
2 | 207.8 | 0.261 | 7850 |
3 | 183.8 | 0.245 | 7850 |
4 | 148.71 | 0.232 | 7850 |
5 | 114.35 | 0.216 | 7850 |
6 | 78.02 | 0.207 | 7850 |
7 | 39.68 | 0.194 | 7850 |
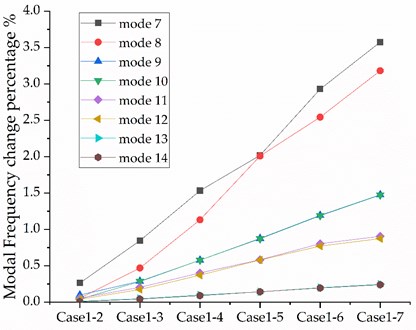
The modal frequencies are obtained by simulation under different working cases. No fixed constraints are added during simulation. The first 6 modes are rigid body free mode, which are not considered. Consider the frequency of non-rigid modal parameters from 7-14 modes. Fig. 8 shows the extent of frequency change of each mode frequency compared to the normal state under different loosened cases, as the bolts loosen, the frequency of high-order modes changes significantly less than the low-order modes.
Fig. 8The variation extent of modal frequency
4.2. Experimental modal analysis of FBSU under different working cases
The experimental modal test of FBSU under different working cases is carried out. The test model, experimental equipment and sensor arrangement are the same as those in Fig. 4(a). The total number of bolts on the test model is 24, and 20 of them are designed to be loosed during the test therefore numbered as shown in Fig. 9. Case 1, all the bolts are tightened. The same pre-tightening force is applied to each bolt with the force wrench. Case 2, the bolt numbered 1 is loose, Case 3, bolts numbered 1-4 are loose. Case 4, bolts numbered 1-8 are loose. Case 5, bolts numbered 1-12 are loose. Case 6, bolts numbered 1-16 are loose. Case 7, bolts numbered 1-20 are loose.
Fig. 9Numbering of bolts on FBSU
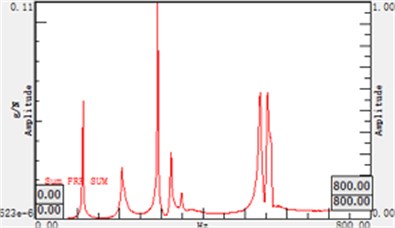
The comprehensive frequency response function of the working case 1 was obtained in the former test. Here, the modal test is started from the working case 2, and Fig. 10 is the comprehensive frequency response function of different working cases. Fig. 10 shows that the frequency response function of the test points under different working conditions has obvious difference, and the modal frequency decreases with the increase of the number of loosened bolts, indicating that loose bolts will cause changes in the overall structural modal parameters. The modal frequency was analyzed from the frequency response diagram. Fig. 11 illustrates the modal frequency variation diagram measured under different working cases in simulation and experiment. It can be seen from Fig. 11 that the trend of the natural frequency in the experiment is basically the same as the simulation, but the magnitude of the decrease is larger than the natural frequency of FBSU in the simulation, the obvious difference between the adjacent modal frequencies of experiment in the figure is likely to be caused by the fact that the experimental model is not strictly symmetrical.
Fig. 10Comprehensive frequency response function under different working cases
a) Case 2
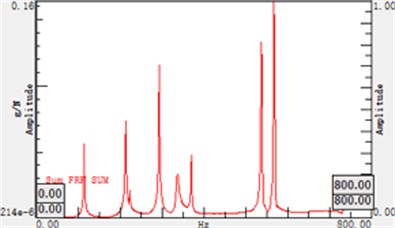
b) Case 3
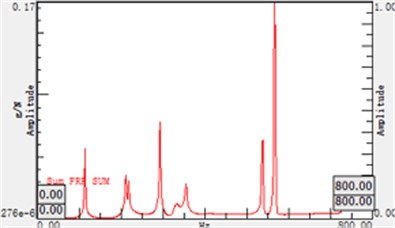
c) Case 4
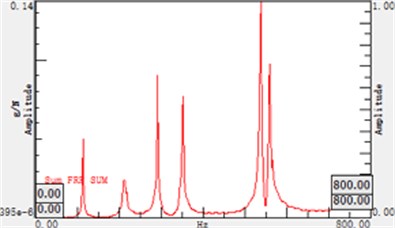
d) Case 5
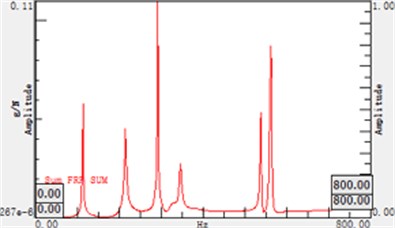
e) Case 6
f) Case 7
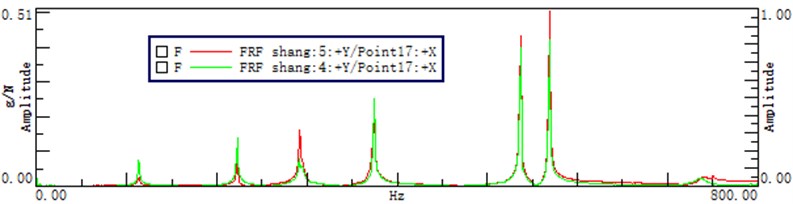
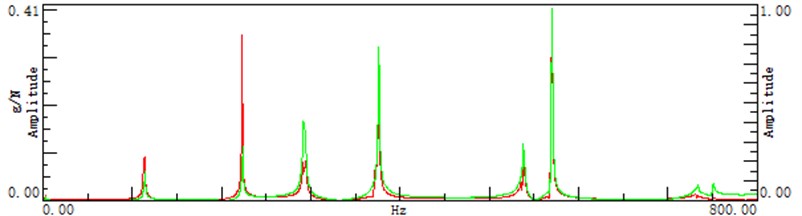
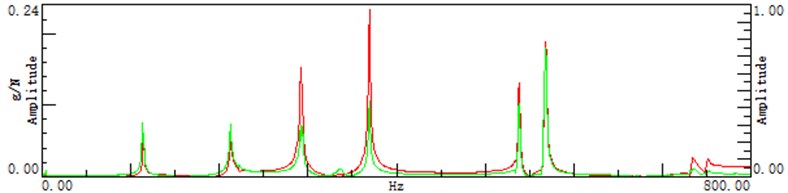
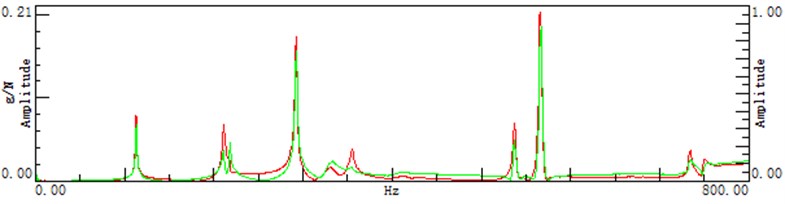
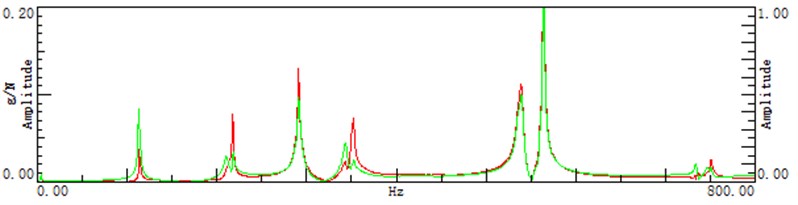
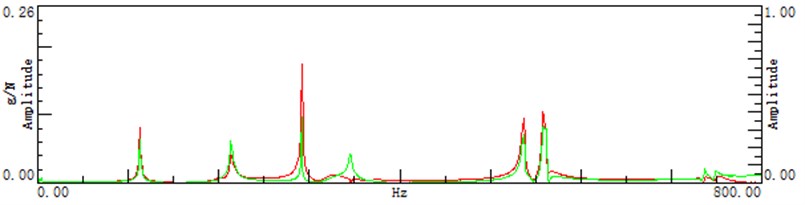
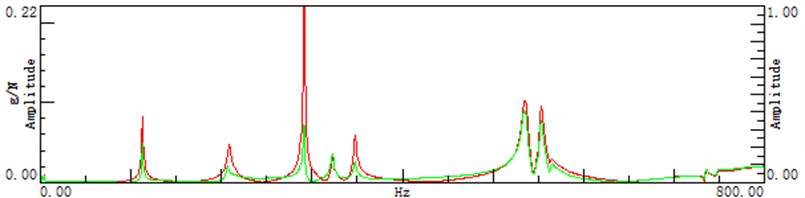
After the excitation at the same position, the frequency response of a certain measuring point will show different response spectrum under different working cases. Therefore, according to this law, the relationship between the natural frequency and the bolt loosening can be further explored, and the same measuring point can be used for different working cases. For the bolt numbered 1, it is tightened in case 1, and it is untightened in case 2 to case 7. The measuring point No. 4 is adjacent to the bolt numbered 1, and the measuring point No. 5 is adjacent to the bolt that has tightened. The response of the measuring point No. 4 and the measuring point No. 5 under different working cases is shown in Fig. 12. The green line in the figure represents the response of measuring point No. 4, and the red line represents the response of measuring point No. 5.
Fig. 12 shows that as the number of loosening bolts increase, the frequency response of measuring point No. 4 and No. 5 changes correspondingly. Fig. 12(a) shows the frequency response with no bolt loose, by comparing the case 1 and case 2-7, we can see that the amplitude of fifth peak decreases significantly both at measuring point No. 4 and No. 5, the amplitude of sixth peak also decreases obviously, the amplitude of second peak and fourth peak shows abrupt change in case 2 and case 4 respectively. The variation of amplitude is likely to become the basis to judge the loose condition of bolts. By comparing the response of different measuring point, we may figure out the approximate position where the bolt is loose. Fig. 12 shows the different variation of response at measuring point No. 4 and measuring point No. 5. When the loosening of bolts occurs, the amplitude of resonance peak at measuring point No. 5 shows more saltation than it at measuring point No. 4.
Fig. 11Frequency variation diagram under different working cases in the simulation and experiment
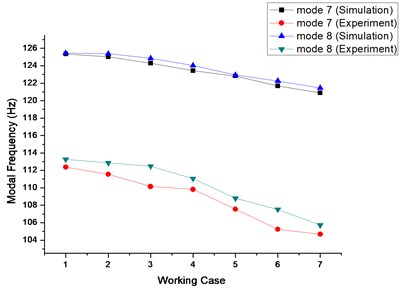
a) Mode 7 and mode 8
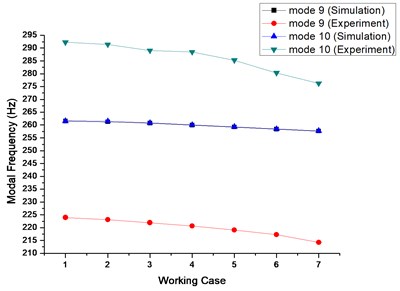
b) Mode 9 and mode 10
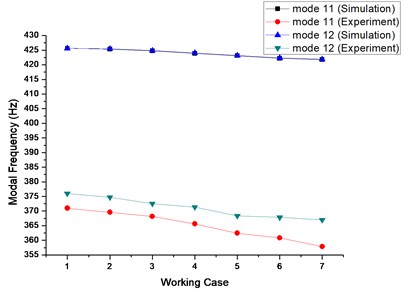
c) Mode 11 and mode 12
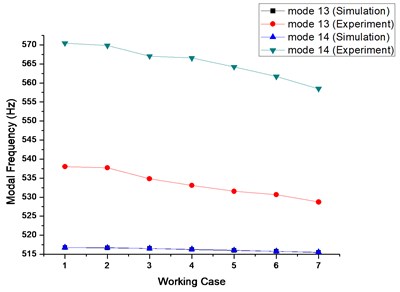
d) Mode 13 and mode 14
Fig. 12Frequency response of measuring point No. 4 and measuring point No. 5 under different working cases
5. Discussion
From the comparison of the simulation results and the experimental results, it can be found that their change trend is basically consistent, and the results are generally acceptable although the simulation error is relatively large. The main reason for this error is that the elastic foam is used to simulate the free state of the test model in the experiment, while the model in the finite element calculation is at the ideal free state. In addition, due to the factors such as processing and manufacturing errors, there is a slight difference between the structure of the experimental object and the simulation object. The structure of the FBSU model is simplified in the finite element modeling, which also brings certain errors. The experimental design itself may weaken the nonlinear phenomenon that should have occurred, thus, the experimental design needs to further improve in the future study.
During the loosening process of the real FBSU, as more and more bolts loosen, the partial loosened bolts whose original pre-load force is reduced to zero will gradually increase due to the elastic recovery. All the pre-load of the bolts tends to be the same again, but in the end, all the bolt pre-load will be lower than the original pre-load value, that is, the pre-load of the whole set of bolts will fall. The practical bolt loosening case is complicated, and it will not loosen according to the specific law. Due to the limited experimental conditions, this experiment only considers the initial loosening of the bolt, which is an approximate simulation of the practical working cases, and thus has limitations.
From the simulation results and experimental results under different working cases, the natural frequency of the structure itself will decrease with the loosening of the bolt. Objectively speaking, the looseness of the bolt mainly reduces the stiffness of FBSU, thus, it can be concluded that the variation of the natural frequency of FBSU mainly depends on the change of the stiffness of the structure itself. After the bolt is loosened, the sensitivity of the natural frequency to looseness is weakened from low-order mode to high-order mode, in other words, the frequency of low-order mode is more sensitive to the identification of bolt loosening. According to the measuring point arrangement of the experiment, an effective frequency response function can be obtained, and the FBSU can be preliminarily judged whether the bolt loosening occurs according to the change of the natural frequency, which lay the foundation for locating the specific position of the loosened bolt and identifying the extent accurately. The follow-up work will focus on studying the exact correspondence between the vibration information obtained from different measuring points and the position and extent of loosened bolts.
6. Conclusions
In this paper, the finite element model of the lightning rod FBSU both in the tightened and loosened state is built, and the virtual material method is used to deal with the flange-bolt joint interface. The effectiveness of virtual material method modeling of FBSU is verified by experimental modal analysis. The simulation modal analysis and experimental modal test were carried out on the FBSU model under loosened cases. The following conclusions can be drawn:
1) The experimental results of the lightning rod FBSU under the condition of tightened bolts and loosened bolts are consistent with the simulation results. It is effective to use the virtual material method to model the bolt loosening of the lightning rod FBSU.
2) The natural frequency of the lightning rod FBSU will decrease as the bolt loosening increases, and the sensitivity of the natural frequency will be weakened from the low-order mode to the high-order mode.
3) When the loosening of bolts occurs, the amplitude of resonance peak at the tighten bolts shows more abrupt changes than it at the loose bolts.
4) The measuring point arrangement of the lightning rod FBSU can obtain an effective vibration signal. The experimental modal analysis can obtain effective frequency response functions and give a preliminary judgment of whether the bolt is loose or not, which is helpful for the subsequent research on the positioning and extent of loosened bolts of FBSU.
References
-
Chen T., Yao C., Wang X., Yu Q. Study on vibration damping design of single-steel-pole lightning rod. Building Structure, Vol. 48, 2018, p. 20-25.
-
Chen Y., Gao Q., Guan Z Q. Self-loosening failure analysis of bolt joints under vibration considering the tightening process. Shock and Vibration, Vol. 2017, 2017, p. 2038421.
-
Chen D., Huo L., Li H., Song G. A fiber bragg grating (FBG)-enabled smart washer for bolt pre-load measurement: design, analysis, calibration, and experimental validation. Sensors, Vol. 18, Issue 8, 2018, p. 2586.
-
Nikravesh S. M. Y., Goudarzi M. A review paper on looseness detection methods in bolted structures. Latin American Journal of Solids and Structures, Vol. 14, 2017, p. 2153-2176.
-
Chen M. Q., Xu B. Bolted joint looseness damage detection using electromechanical impedance measurements by PZT sensors. Proceedings of SPIE – The International Society for Optical Engineering, Vol. 8409, 2012, p. 840925.
-
Argatov I., Sevostianov I. Health monitoring of bolted joints via electrical conductivity measurements. International Journal of Engineering Science, Vol. 48, Issue 10, 2010, p. 874-887.
-
Ho D. D., Nguyen T. H., Le Q. H. Bolt-loosening detection in steel column connections using impedance responses. Proceedings of the 4th Congrès International de Géotechnique - Ouvrages -Structures, 2017.
-
Huynh T. C., Dang N. L., Kim J. T. Preload monitoring in bolted connection using piezoelectric-based smart interface. Sensors, Vol. 18, Issue 9, 2018, p. 2766.
-
Yang J., Liu P., Yang S., Lee H., Sohn H. Laser based impedance measurement for pipe corrosion and bolt-loosening detection. Smart Structures and Systems, Vol. 15, Issue 1, 2015, p. 41-55.
-
Kong X., Li J. Image registration-based bolt loosening detection of steel joints. Sensors, Vol. 18, Issue 4, 2018, p. 1000.
-
Cha Y. J., You K., Choi W. Vision-based detection of loosened bolts using the Hough transform and support vector machines. Automation in Construction, Vol. 71, 2016, p. 181-188.
-
Sohn H., Li J., Kong X. X. An image-based feature tracking approach for bolt loosening detection in steel connections. Proceedings of SPIE – The International Society for Optical Engineering, Vol. 10598, 2018, https://doi.org/10.1117/12.2296609.
-
Zhao X. F., Zhang Y., Wang N. N. Bolt loosening angle detection technology using deep learning. Structural Control and Health Monitoring, Vol. 26, Issue 1, 2019, p. e2292.
-
Jin W. Q., Han S. S., Fei J. D., Shi Z. L., Chen W. B., Bao W. M., Yang J., Gong W., Su J. Z., Lv Y. G., Xie Y., Sun J. On-line bolt-loosening detection method of key components of running trains using binocular vision. Proceedings of SPIE – The International Society for Optical Engineering, Vol. 10605, 2017, p. 1060513.
-
Du F., Xu C., Wu G., Zhang J. Preload monitoring of bolted l-shaped lap joints using virtual time reversal method. Sensors, Vol. 18, Issue 6, 2018, p. 1928.
-
Wu G. N., Xu C., Du F., Zhu W. D. A modified time reversal method for guided wave detection of bolt loosening in simulated thermal protection system panels. Complexity, Vol. 2018, 2018, p. 8210817.
-
Shull P. J., Xue Z. G., Su W. S., Zhang Y., Zhao X. F. Audio-based bolt-loosening detection technique of bolt joint. Proceedings of SPIE – The International Society for Optical Engineering, Vol. 10599, 2018, p. 1059929.
-
Liu S. P., Li Y., Wang T., Luo Y. A piezoelectric active sensing method for detection of bolt load loss. Sensor Review, Vol. 34, Issue 4, 2014, p. 337-342.
-
Wu J., Cui X. M., Xu Y. P. A novel RFID-based sensing method for low-cost bolt loosening monitoring. Sensors, Vol. 16, Issue 2, 2016, p. 168.
-
Kundu T., Huda F., Kajiwara I., Hosoya N., Kawamura S. Bolted joint loosening detection by using laser excitation. Proceedings of SPIE – The International Society for Optical Engineering, Vol. 8695, 2013, p. 869531.
-
He K., Zhu W. D. Detection of damage in lightning masts and loosening of bolted connections in structures using changes in natural frequencies. Conference Proceedings of the Society for Experimental Mechanics Series, Vol. 3, Issue 1, 2011, p. 63-78.
-
He K., Zhu W. D. Detecting loosening of bolted connections in a pipeline using changes in natural frequencies. Journal of Vibration and Acoustics, Vol. 136, Issue 3, 2014, p. 034503.
-
Tang Q. S., Li C. F., She H. X., Wen B. C. Vibration analysis of bolted joined cylindrical-cylindrical shell structure under general connection condition. Applied Acoustics, Vol. 140, 2018, p. 236-247.
-
Tang Q. S., Li C. F., She H. X., Wen B. C. Nonlinear response analysis of bolted joined cylindrical-cylindrical shell with general boundary condition. Journal of Sound and Vibration, Vol. 443, 2019, p. 788-803.
-
Albermani F. G. A., Kitipornchai S. Numerical simulation of structural behaviour of transmission towers. Thin-Walled Structures, Vol. 41, Issues 2-3, 2003, p. 167-177.
-
Ballaben J. S., Sampaio R., Rosales M. B. Uncertainty quantification in the dynamics of a guyed mast subjected to wind load. Engineering Structures, Vol. 132, 2017, p. 456-470.
-
Barhorst A. A. Modeling loose joints in elastic structures-variable structure motion model development. Journal of Vibration and Control, Vol. 14, Issue 11, 2008, p. 1767-1797.
-
Dong G. H., Yin Q., Liu Y., Yin G. F. A study on the identification of joints dynamic stiffness based on modal analysis. Journal of Vibration and Shock, Vol. 36, Issue 20, 2017, p. 125-131.
-
Tian H., Li B., Liu H., Mao K. M., Peng F. Y., Huang X. L. A new method of virtual material hypothesis-based dynamic modeling on fixed joint interface in machine tools. International Journal of Machine Tools and Manufacture, Vol. 51, Issue 3, 2011, p. 239-249.
-
Iranzad M., Ahmadian H. Identification of nonlinear bolted lap joint models. Computers and Structures, Vol. 96, Issue 97, 2012, p. 1-8.
-
Liao J., Zhang J., Feng P., Yu D. W., Wu Z. J. Interface contact pressure-based virtual gradient material model for the dynamic analysis of the bolted joint in machine tools. Journal of Mechanical Science and Technology, Vol. 30, Issue 10, 2016, p. 4511-4521.
-
Zhao Y. S., Yang C., Cai L. G., Shi W. M., Liu Z. F. Surface contact stress-based nonlinear virtual material method for dynamic analysis of bolted joint of machine tool. Precision Engineering, Vol. 43, 2016, p. 230-240.
Cited by
About this article

The authors appreciate the financial support from the National Natural Science Foundation of China (No. 51705462), the Talent Project of Zhejiang Association for Science and Technology (No. YCGC016).
