Abstract
In this paper, the nonlinearity detection, characterization and identification of a bolted beam assembly is presented. The methodology utilized in this work is based on the force reconstruction using the base excitation as an input and the nonlinear system identification. The force reconstruction procedure was carried out by exciting the bolted beam assembly at very low excitation with fully tightened bolt condition. The nonlinear effect in the bolted beam assembly was induced by reducing the bolt clamping loads. A collection of frequency response functions (FRFs) are shown at different clamping loads to detect and characterize the nonlinearities. Once the nonlinearities are detected and characterized, the restoring force surface method using the reconstructed force was used to identify the nonlinear parameters in the modal space. Four different base excitation (energy) levels with three different tightening torques were considered in the tests in order to study the energy dependence of the damping nonlinearities. In all the cases, the nonlinear system identification methodology employed was successful in identifying the damping and stiffness nonlinearities.
1. Introduction
The body structure of ground vehicles or any mechanical components are joined in some way, by bolting, welding, riveting or by more complicated fastenings such as smart joints (The piezoelectric materials embedded between two structures at the critical locations of the joint). It is known that the added flexibility introduced by the joint to the structure heavily affects its behavior and when subjected to dynamic loading, much of the energy is lost at the joints. In structures made up of bolted members or any other joints, up to 90 % of the damping is caused due to the joints themselves [1]. As a result of which, determining the relevant mechanics of each joint is critical to a validated full body model of the structure. The most common failures at joints are frictional slip at micro and macro level [2-6]. As a force is applied to a joint, small regions of the interface area will break free and begin slipping, these localized motions are known as microslip. As the level of the force applied to the joint increases, a larger portion of the interface will break free and slip; eventually, the entire contact area will be slipping, which is termed as macroslip. For most joints excited at reasonable force levels, macroslip does not occur but microslip is common [7]. The small and localized motion during microslip results in energy losses at the joint, which is perceived as localized damping of the structure. Neglecting these effects in modeling of joint structure produces error in predictions of the structure responses. So it is essential to understand the dynamic behavior of the structure due to the bolted joint connection.
Several experimental studies have been carried out in the past using the modal shaker and the hammer providing important new results (nonlinear damping and stiffness) and understanding of bolted joints. Goege et al. [8] presented a test strategy that can be used to identify and characterize nonlinear structural behavior due to a joint during modal testing. The method assumes a weak nonlinear behavior and operates in modal space. Ma et al. [9] studied the effects of a lap joint placed between two cantilever beams while the assembly is excited using concentrated force acting parallel to the bolt axis. Their method relies on the comparison of the overall dynamics of the bolted structure to that of similar but unbolted one. Experiments were carried out on bolted and unbolted beams using non-contacting laser vibrometry, the identification revealed non-proportional damping and nonlinear softening effects due to micro-impact in the bolted joint. Hartiwigsen et al. [10] experimentally studied the principle joint effects on the structural dynamics of two structure composed of beam elements. The two structures are: (i) a simple beam with a joint located at its centre and (ii) a rectangular frame with the joint in the centre of one of its longitudinal beams. His results conclude with the nonlinear viscous damping as a function of the amplitude of the displacement.
The experimental observations found in existing literatures [8-12] show that: (i) the detailed constitutive models describing the behavior of frictional interfaces are more complicated and (ii) the simple phenomenological models having parameters obtained from the vibration measurements are more preferable. Thus, it is decided in this paper to explore the system nonlinearity due to a joint using the measured vibration data. In order to detect and characterize the nonlinearity by using measured vibration data, it is essential to answer following three questions: (i) what kind of excitation is to be used (force excitation, base excitation and impulse hammer excitation etc.), (ii) what kind of input is to be used for nonlinearity detection (single sinusoidal, swept sine, and step sine etc.) and (iii) what frequency range of the structure is to be tested. As this paper aims to detect, characterize and identify the nonlinearity of a joint connected structure using the base excitation as an input, for the nonlinearity detection and characterization purpose, the controlled displacement base excitation, step sine test and the frequency range around the first natural frequency of the system is taken as the test parameters.
The methodology developed to detect and characterize the nonlinearity of the structure for a base excited joint structure, using the controlled displacement input is the original contribution of the author’s. Once the nonlinearity is detected and characterized, the nonlinear parameters are estimated using the theory of force reconstruction, base excitation and the nonlinear parameters identification. To the best of the author’s knowledge, this approach to detect, characterize and estimate the nonlinearity for a joint structure using the base excitation has never been used in the current literature.
The rest of this paper is organized as follows. Section 2 presents the theory for nonlinearity detection, characterization and identification due to joint connection. Section 3 presents the numerical example of a single degree of freedom joint structure, which demonstrates the nonlinearity detection characterization and the identification procedure. Section 4 presents the experimental approach of nonlinear system identification for the bolted beam joint. Finally, Section 1.5 concludes the paper with the finding of the research and the significance of the presented work.
2. Force reconstruction and nonlinear system identification using the base excitation
This section presents the brief theory to estimate the nonlinear parameters of a nonlinear system using the base excitation as an input. The presented theory is based on the principle of force reconstruction, base excitation and nonlinear system identification. The force reconstruction procedure for a moving base system is carried out by exciting the system at low base displacement. A reverse explicit formulation is shown in reference [20-22] where the system equation is partioned at the measured and the unmeasured degrees of freedom (DOFs). The reconstructed force at the measured DOFs is obtained by the system transfer function and the mode shapes matrix. The nonlinear restoring force at the measured DOFs is recovered by using the reconstructed force vector, linear mode shapes matrix and the nonlinear response vector at the measured DOFs. The mathematical concept for force reconstruction, base excitation and the nonlinear system identification is described below in brief. For more about this theory readers are suggested to review reference [20-22].
2.1. Theoretical formulation for the force reconstruction, base excitation and nonlinear system identification
This section illustrates the theoretical formulation for the force reconstruction, base excitation and the nonlinear system identification using the measured data. The hybrid model for the system is shown such that the response of the system at the measured DOFs is kept in the physical coordinates while the other parameters are kept in the modal space. The model assumes that when the magnitude of excitation to the base is sufficiently high, the response from the structure attached to the base is no longer linear [15-17].
The general Equation of motion for a linear MDOFs system, subjected to base excitation can be written as:
where, , and are the mass, stiffness, and proportional damping matrices of the system in a fixed base configuration, is the input acceleration, is the displacement vector relative to the base, and is the transformation vector (, where, is the angle between the th degree of freedom, and the direction of base motion.
Transforming Eq. (1) to the frequency domain we have:
where, is the Equivalent excitation force vector which is denoted by , Eq. (2) becomes:
Multiplying both sides of Eq. (3) by modal matrix and introducing the term , Eq. (3) becomes:
For mass normalized mode shapes and proportional damping assumptions, the orthogonal properties of the linear modal matrix , can be written as:
Let, where, the brackets denotes a diagonal matrix. Using this property, Eq. (4) can be written in a more concise form as:
Eq. (9) represents the hybrid model for MDOFs systems undergoing base excitation, where the response vector is kept in the physical domain while the remaining parameters in the modal space. Using Eq. (9) directly in practical cases has two major difficulties: (i) the measurement of response vector at all DOFs is impossible and (ii) the modal model derived via an experimental route is incomplete. In order to mimic the condition of incomplete measurements, Eq. (9) is partitioned at the measured and the unmeasured DOFs. Let the subscript represent the measured DOFs and the subscript represent the unmeasured DOFs. Similarly, represents the identified modes and represents the unidentified modes then, partitioning Eq. (9) at the measured and the unmeasured DOFs Eq. (9) can be written as:
Let:
The response at the measured DOFs can be written as:
Eq. (15) represents the response of the relative displacement vector at the measured degrees of freedom. Multiplying both sides by to Eq. (15), we have:
is the pseudo excited projected force at the measured degrees of freedom. This can be extracted solely from the measured data. Denoting it by , the final equation can be written as:
Eq. (17) represents the closed-form expression for the pseudo excited force vector projected at the measured degrees of freedom in the explicit form. The last three terms shown in Eq. (17) are the linear residuals. These three terms of the Eq. (17) project the force from unmeasured degrees of freedom to the measured degrees of freedom. The pseudo excited force vector is obtained solely from the dynamics of the system as shown by the right hand side of Eq. (16). As the right hand side of the Eq. (16) is in the explicit form, it can be solved in the time domain to obtain the reconstructed force at the measured DOFs. Solving right hand side of Eq. (16) in time domain eliminates the strong hypothesis that harmonic excitation to the system produces the response at same harmonic, which is in fact a strong assumption. Similarly, for the nonlinear system, following reference [20-22], the nonlinear restoring force at the measure DOFs can be written as:
where is the nonlinear restoring force at the measured DOFs. This nonlinear restoring force at the measured DOFs is recovered by using the reconstructed force vector , linear mode shapes matrix and linear transfer function and the nonlinear response vector .
Eq. (18) gives the nonlinear restoring force vector at the measured DOFs. Once such a force vector is obtained, the nonlinear parameters can be extracted by using the harmonic balance approach [20-21]. Using the harmonic balance approach required the location and the functional form of the nonlinearity and this approach work only for the frequency domain data which may limits the use of Eq. (18) in the practical cases. In this paper the modal based approach is chosen which do not primarily required the location and the functional form of the nonlinearity. To use the modal approach, Eq. (18) is further expanded in the modal space using the linear mode shapes matrix at the measured DOFs. Multiplying both sides of Eq. (18) by the transpose of the linear mode shapes matrix:
Eq. (19) is the expression for the nonlinear modal restoring force in the modal space. The right hand side of Eq. (19) is in the hybrid form. This hybrid form is expanded to the nonlinear modal space by using the measured linear mode shapes matrix (without allowing the modes shapes to change). Using the linear mode shapes matrix, Eq. (19) can be written as:
where is the nonlinear modal response vector. The Eq. (20) can be solved in the time domain such that the multi harmonic components of the signal can be taken into account. Solving Eq. (20) in the time domain yields the modal restoring force at the nonlinear modal space provided that all the matrices shown in right hand side of Eq. (20) are invertible. The Moore-Penrose pseudo inverse technique can be used when the matrix given by the right hand side of the Eq. (20) is rectangular. Once the modal restoring force vectors are obtained, the restoring force surface method is used to estimate the nonlinear parameters for the excited mode. The nonlinear restoring force for the excited mode in the time domain can be written as:
where:
where , , are the modal responses for the first, second and third mode respectively. The least square parameter estimation technique is used to obtain the values of the coefficients . The normalized Mean-Square Error (MSE) between the measured and the predicted restoring force is defined as:
where is the total number of samples and is the variance of the measured restoring force. Research shows that a MSE value of less than 5 % indicates good agreement while a value of less than 1 % reflects an excellent fit [15]. Potentially, a large number of nonlinear terms exist as indicated by Eq. (21). To determine which terms are significant and which terms can be safely discarded in Eq. (21), the significant factor is used which is defined as:
where corresponds to the variance of the sum of all the terms of the model and is the variance of the considered term. A stepwise regression technique is used so as to achieve a desired level of MSE.
2.2. Characteristics of the restoring force
This section presents the characteristics of the modal restoring force obtained by using the measured experimental data. The modal restoring force vectors shown by Eq. (20) contain the number of equations which are equivalent to the number of identified modes. The obtained number of equations may be in the form of nonlinearly coupled (coupling with the group of modes) or nonlinearly uncoupled. The coupling between the modes depends mainly on the frequency separation between the modes, the number of excitations used and the damping present in the structure. If the multi-base excitations are used, the proper base axis combinations can be created so as to isolate the mode of interest. Such a method is called the phase resonance method. The obtained nonlinear restoring force vector by employing such a method may have a form given by Eq. (22). In such cases if there are coupling terms, the coupling parameters can be obtained by using Eqs. (21-24), which yields accurate normal and cross-coupling parameters. In the other case, if the single base excitation is used, there may or may not be the coupling terms. If there are coupling terms, the coupling terms obtained by using Eqs. (21-24) are not accurate. It is due to the fact that, the excited mode is not properly isolated, which yields the force in the unexcited mode. However, the direct stiffness associated with the excited mode is accurate when using Eqs. (21-24). In this paper, we use the single excitation with the excitation frequencies varying around the first natural frequency of the system, and we use Eqs. (21-24) for the purpose of curve fitting. In such cases, the identified direct stiffness and damping associated with that mode are true and accurate. The modal restoring force for the excited mode can be generalized as follows:
where is the linear modal damping ratio of the excited th mode and is the linear natural frequency of the th mode. The different forms of the restoring force for different cases are summarized as follows:
Eq. (26) represents the nonlinear modal restoring force with the hardening stiffness nonlinearity. Typical structure that posses hardening nonlinearity are beam, plates and engine wing of an aero structure. Similarly, Eq. (27) presents the nonlinear modal restoring force with the softening nonlinearity and the amplitude dependent nonlinear damping. Such types of nonlinearities are commonly found in joint structure. The parameters and shown in Eq. (27) can be estimated by using the multilinear least square regression technique. In this paper we use Eqs. (20-24) for solving the value of and .
2.3. Nonlinearity detection characterization and identification methodology for a mechanically connected structure
In Section 2.1, the methodology to identify the nonlinear parameters for a general nonlinear system is presented. Before proceeding to the nonlinear parameter identification, it is essential to detect and characterize the nonlinearity of a structure. As the main contribution of this paper lies in the detection and the characterization of the nonlinearities due to the joint connection, this section presents the procedure to detect and characterize the nonlinearities due to the joint connection. In order to study the nonlinear characteristics due to the joint connection, a numerical example for a base excited structure is defined accordingly to the experimental discovery of Hartwigsen et al. [10]. The model is simulated (the Forward Approach) for various excitation frequencies in order to study the effect of maximum amplitude of displacement on damping, stiffness and the natural frequencies of the structure. Following the numerical simulations, the nonlinear parameters of the defined model are assumed to be unknown and using the nonlinear response data from the simulations, the system identification methodology (the Reversed Approach) described in Section 2.2 is used to obtain the assumed parameters. The identified parameters are then compared with the initially assumed parameters to show the efficacy of the proposed nonlinear parameter identification method described in Section 2.1.
3. Numerical example to demonstrate the detection and the characterization of nonlinearity due to joint (the forward approach)
In order to demonstrate the detection and characterization of the nonlinearity of structure due to the joint connection, a suitable test procedure is designed such that it is feasible to apply for the experimental implementation. Here a classical example is presented to demonstrate the test procedure. Consider a single DOF system represented in a modal coordinate with a softening stiffness and the nonlinear viscous damping due to joint slip. The governing equation of motion in a modal space for a base excited structure can be written as:
where, is the nonlinear modal response vector, is the natural frequency and is the reconstructed force vector using the base motion as an input. Eq. (28) is the extended form of Eq. (25), where the proportional damping of the structure is replaced by amplitude dependent damping term so as to represent the joint nonlinearity and the multi-mode system is simplified to a single mode system. It should be noted that the base motion may be either in the form of displacement or acceleration. The term is dependent on the displacement amplitude of vibration and can be generalized as:
It has been observed in the existing literature that the equivalent damping coefficient for a joint interface is a positive definite function and is dependent as a quadratic function of the maximum amplitude of vibration [10]. Following [10], Eq. (29) can be written as:
The parameters used for the simulation are: 0.05 Nm/sec, 65 Nm/sec, 1×10⁴ Nm/sec, 150 rad/sec = 23.87 Hz, 4×10⁷ N/m3 and 10 N harmonic excitation.
It is clear from Eq. (30) that the nonlinear viscous damping is dependent upon the maximum amplitude of the displacement. The numerical value of the maximum amplitude of displacement initially unknown. An iterative approach is used to determine the value of [11]. In order to solve the unknown , an initial value is assigned for in the first iteration and using such an assigned value the amplitude of vibration response is obtained by integrating Eq. (30) using the Runge Kutta algorithm. In the second iteration, using the new value of, Eq. (30) is again integrated. The integration procedure stops after converged to the constant value. The experimental approach usually involves measuring the acceleration response and integrating the acceleration response to velocity and displacement. In order to eliminate the phase distortion and the drift in the signal, the analytical integration procedure is carried out using the following equations:
Writing Eq. (31) in each time instant and using a least-square procedure the coefficients and can be identified. Once the coefficients of Eq. (31) are known, the velocity and displacements are obtained by analytical integration:
where the term in represents the number of harmonics present in the signal, is the excitation frequency and is the time period.
The mean values of the velocity and the displacement signals have to be zero, which means that and .
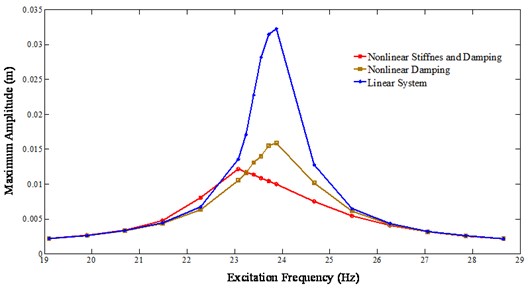
The excitation frequency is varied around the natural frequency of the system shown by a model defined by the Eq. (28). The maximum amplitude of displacement along with the time domain responses of acceleration, displacement and velocity are obtained through iterations for each excitation frequency. The nonlinear FRF of the system is obtained by plotting the maximum amplitude of the simulated response at each excitation frequency against the excitation frequencies. The nonlinear FRF plot is shown in Fig. 1. From Fig. 1, it is clear that the maximum amplitude of vibration is at the excitation frequency of 23.08Hz. As the linear natural frequency of the assumed model is at 23.87 Hz, there is a shift in the natural frequency from the linear 23.87 Hz to the nonlinear 23.08 Hz. The shift in the natural frequency is due to the nonlinear softening effect at the joint. The simulation is carried out including: (i) nonlinear stiffness and nonlinear damping, (ii) nonlinear damping only and (iii) equivalent linear system only (all the nonlinear terms are removed from the assumed model). The comparisons of FRFs for each type of nonlinearities are shown in Fig. 2. As shown in Fig. 2, for the equal magnitude of input, the amplitude of displacement is fairly low when the system is nonlinear as compared to the equivalent linear system. As shown by the maximum amplitude of displacement, the shift in the natural frequency is from the linear 23.87 Hz to the nonlinear 23.08 Hz. The presence of the nonlinear viscous damping reduces the amplitude of displacement however, it does not reduce the natural frequency of the system. The significance of the FRFs shown in Figs. 1 and 2 is that, the shift in the natural frequency can be used as a tool to detect and characterize the nonlinearity for a complex structure using the measured vibration data.
Fig. 1FRF of nonlinear system with stiffness and damping nonlinearities
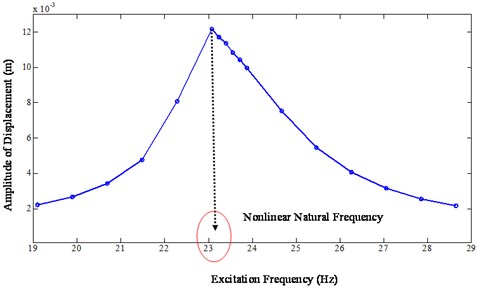
Fig. 2FRFs comparison of linear and nonlinear system
In Section 2, a simulation approach is shown for a system which has the amplitude dependent damping and the stiffness nonlinearity. As this paper also focus on the identification of nonlinear parameters (the Reverse Approach), the parameters used for the simulations are assumed to be unknown and the time series responses of acceleration, displacement and velocity with the known excitation force are taken for the further analysis. The values of, , and which are assumed to be unknown are obtained by using the theory described in Section 1.2 of this paper. For a single excited mode Eq. (19) can be written as:
where, is the nonlinear modal restoring force which contains the amplitude dependent damping and the stiffness term due to joint motion. can be further written as:
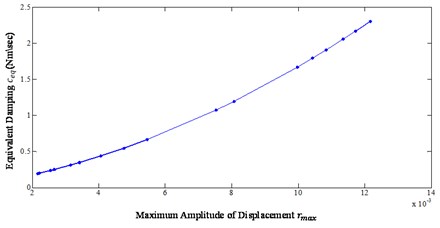
As the right hand side of Eq. (35) is known, can be computed at each time instant for each excitation frequency by using Eq. (35). Once is obtained, a multilinear least square regression algorithm which utilizes Eqs. (20-23) described in Section 1.2 is used to determine the stiffness and the nonlinear damping parameters. Fig. 3 shows the identified nonlinear stiffness coefficient as a function of the excitation frequency. The identified nonlinear stiffness coefficient is constant over the excitation frequencies, which is true as the response data are measured for constant nonlinear stiffness. Similarly, Fig. 4 shows the identified equivalent damping coefficient for each excitation frequency. The equivalent damping coefficient has the maximum value at the nonlinear natural frequency of the system (23.08 Hz). Once the equivalent damping coefficient at each excitation frequency is identified, the next step is to identify the value of , and . As previously discussed, , and are dependent upon the maximum amplitude of the displacement , the least square regression of on is carried out to identify the coefficients , and . Fig. 5 shows the plot between the maximum amplitude of the displacement and the equivalent damping coefficient. Fig. 5 clearly shows that the equivalent damping coefficient is varying as a quadratic function to the maximum amplitude of displacement. The exact and identified parameters are tabulated in Table 1.
Table 1Exact and identified nonlinear parameters
Exact | 0.05 | 65 | 1×10⁴ | 4×10⁷ |
Identified | 0.045 | 66.12 | 1.01×10⁴ | 4×10⁷ |
Error (%) | 0.5 | 1.69 | 1 | 0.0 |
As shown in Table 1, the percentage error between the exact and the identified parameters for the equivalent damping coefficients is less than 2 %. The identified stiffness coefficient is equal to the exact stiffness coefficient which indicates that the nonlinear parameter identification algorithm described in Section 2.1 can be used for the estimation of the joint nonlinearities.
Fig. 3Identified stiffness as a function of frequency
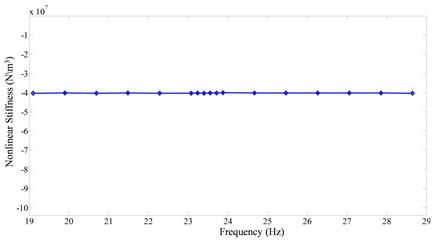
Fig. 4Identified equivalent damping coefficient as a function of frequency
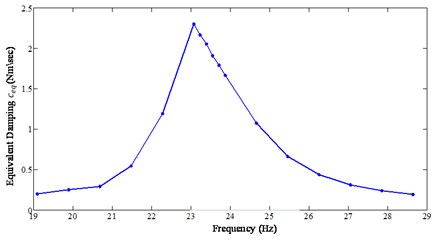
Fig. 5Equivalent damping coefficient as a function of maximum amplitude of displacement
4. Experimental demonstration of nonlinear system identification in a bolted joint
The objective of this section is to experimentally demonstrate the detection, characterization and the identification of the nonlinear parameters where the nonlinearities arise from the joint connection. In Section 2, the nonlinear system identification methodology has been applied in three stages: linear system identification, force reconstruction and the nonlinear parameter identification. Similarly in Section 3, a procedure has been defined and verified numerically to detect and characterize the nonlinearity. In order to apply the same procedure as presented in Section 2 and Section 3, this section is divided into four subsections: experimental setup, linear system identification and force reconstruction, nonlinearity detection and characterization and nonlinear parameter identification.
4.1. Experimental setup
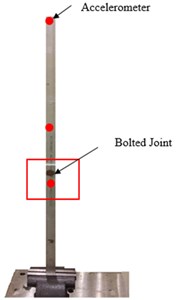
The test setup consists of a shaker table platform excited with servo-hydraulic actuators to simulate different types of periodic and random motions, such as artificial ground motions and other dynamic testing signal of interest in the laboratory. The details of the test setup are shown in Fig. 6. It consists of a hydraulic pump, actuator, shaker table, beam, data acquisition board, and a computer. The hydraulic systems are marketed by MTS Systems Corporation. The shaker table is the uniaxial (horizontal) table constructed with in-house knowledge and fabrication capability. It consists of a table platform, ball bearing with the rail guide and the reaction mass. The test structure consists of two aluminum beam connected with the bolted joint in a fixed free boundary condition. The enlarged view of the test structure is shown in Fig. 7. As shown in Fig. 7, the dimensions of the beam are: length 90 cm, width 2.54 cm and the thickness 0.625 cm. The bolt material used for fastening the beam is mild steel with the nominal bolt diameter of 0.9525 cm. The experiments are conducted for three different preloads (different tightening torques): 19.77 Nm, 13.55 Nm and 9.03 Nm. A four channel data acquisition board “DT9837” from Data Translation is used which is connected to the computer through a USB cable. For the purpose of response measurements from the shaker table and the beam, PCB accelerometers from Dalimar Instruments Inc. are used. A multipurpose test suit is used for running the hydraulic system while the “VIB Point 2.0” software is used to extract the response data from the beam.
Fig. 6Experimental setup for nonlinear system identification
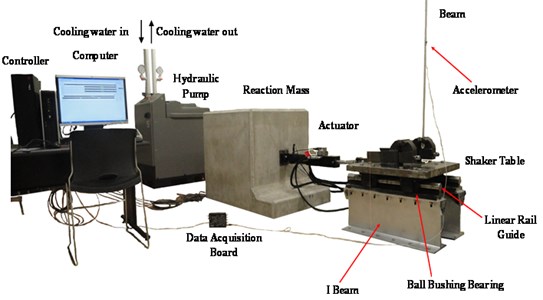
Fig. 7Bolted beam with fixed-free boundary condition
4.2. Linear system identification
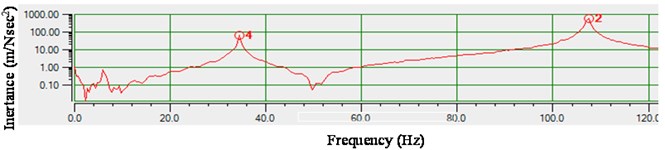
The linear system identification methodology consists of: (i) measuring the linear response data, (ii) identifying the mode shapes matrix (modal vector) and (iii) the natural frequencies of the structure. In order to measure the linear parameters, the bolt is fully tightened with a tightening torque of 19.77 Nm. The fully tightened bolt under low magnitude of excitation will show fairly the linear behavior as reported in reference [5-8]. So Eq. (16) is used to reconstruct the force under low displacement, provided that the mode shapes of the bolted connection are known. One way of identifying the modal matrix (mode shapes) of the structure is usually done by defining the FE model of the structure. However, for a structure with a bolted connection the type of the bolt model that can accurately predict the mode shapes of the structure using the FE approach is still a research problem. The alternative technique of identifying the mode shapes is to measure them experimentally. There are several established methods for mode shapes measurements [13, 14]. The procedure to normalize the measured mode shapes to unity mass matrix is clearly shown in the reference [24]. Having made the decision to measure the mode shapes for a bolted beam a PCB model hammer (086C03) is used to measure the mode shapes. Both the roving hammer tests and roving accelerometers tests (moving the excitations/sensors at the different locations of the test structure) are carried out such that the mode shapes are accurate and consistent in both tests. Fig. 8 shows the driving point FRF of the roving hammer test. The three natural frequencies are at 5.9 Hz, 33.6 Hz and 105.1 Hz. Similarly, Fig. 9 shows the FRF at the tip of the beam with roving accelerometers tests. The natural frequencies are in good agreements in both the tests. The coherence measured is perfect with more than 95 % at resonance. Having measured the mode shapes and the natural frequencies with fully tight bolt conditions, it is possible to construct the equivalent excitation force vector using Eq. (13) and reconstruct the force vector from the dynamics using Eq. (16) if the excitation at the base is known.
Fig. 8Driving point FRF (roving hammer test)
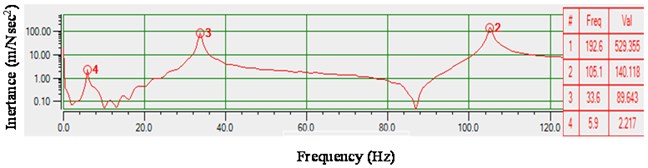
Fig. 9FRF at the tip of the beam (roving sensor)
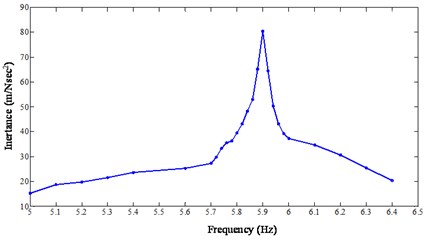
The equivalent excitation force vector for a base displacement of 0.1 mm and an excitation frequency of 5.9 Hz is shown in Fig. 10. Such forces shown in Fig. 10 will vary as a quadratic function of excitation frequencies, if the constant displacement is maintained at the base. As presented in the numerical example in Section 3, the equivalent force is maintained at constant magnitude, when the excitation frequency is varied around the natural frequency of the system. So in experiments we aim to maintain the magnitude of the equivalent excitation force constant over the excitation frequency range. In order to maintain the constant equivalent excitation force, a scaling factor for a base displacement is calculated. It is believed that the nonlinear stiffness due to the joint will be constant over the excitation frequency range, if the magnitude of the equivalent excitation force with respect to the excitation frequency range can be maintained constant at the base. The input base displacement that can maintain the constant equivalent excitation force over the excitation frequency range is tabulated in Table 2. The excitation frequency and the base displacement are now varied with a fully tight bolt condition. The maximum amplitude response at each excitation frequency with three accelerometers (locations shown in Fig. 7) is recorded. The maximum response for each excitation is now transformed to modal space using mode shapes matrix. With the maximum amplitude at each excitation frequency known in the modal space and the equivalent modal force known, it is possible to create a FRF of the system for Mode 1. The FRF in the form of Inertance is shown in Fig. 11. The FRF shown in Fig. 11 indicates the natural frequency at 5.9 Hz showing the system behaving linearly. As the linear FRF is known along with the mode shapes matrix it is possible to reconstruct the force at the measured DOFs only (Eq. (16)).
Table 2Input base displacement for the excitation frequency range
Excitation frequency (Hz) | Scaling factor (SF) | Base displacement (mm) |
5 | 1 | 1 |
5.1 | 0.9612 | 0.9612 |
5.2 | 0.9246 | 0.9246 |
5.3 | 0.8900 | 0.8900 |
5.4 | 0.8573 | 0.8573 |
5.5 | 0.8264 | 0.8264 |
5.6 | 0.7972 | 0.7972 |
5.7 | 0.7695 | 0.7695 |
5.8 | 0.7432 | 0.7432 |
5.81 | 0.7406 | 0.7406 |
5.82 | 0.7381 | 0.7381 |
5.83 | 0.7355 | 0.7355 |
5.84 | 0.7330 | 0.7330 |
5.85 | 0.7305 | 0.7305 |
5.86 | 0.7280 | 0.7280 |
5.87 | 0.7255 | 0.7255 |
5.88 | 0.7231 | 0.7231 |
5.89 | 0.7206 | 0.7206 |
5.90 | 0.7182 | 0.7182 |
5.91 | 0.7158 | 0.7158 |
5.92 | 0.7133 | 0.7133 |
5.93 | 0.7109 | 0.7109 |
5.94 | 0.7085 | 0.7085 |
5.95 | 0.7062 | 0.7062 |
5.96 | 0.7038 | 0.7038 |
5.97 | 0.7014 | 0.7014 |
5.98 | 0.6991 | 0.6991 |
5.99 | 0.6968 | 0.6968 |
6 | 0.6944 | 0.6944 |
6.10 | 0.6719 | 0.6719 |
6.20 | 0.6504 | 0.6504 |
6.30 | 0.6299 | 0.6299 |
6.40 | 0.6104 | 0.6104 |
4.3. Nonlinearity detection and characterization (experimental approach)
This section presents the procedure to detect and characterize the nonlinearities due to the joint connection. Nonlinearity is present in the structure if the FRFs of the structure at different excitation level are not constant. In order to detect and characterize the nonlinearity, the fully tightened bolt is now loosen using a torque wrench. The test is carried out in two different torques which will generate two different preloads. The tests are carried out at 13.55 Nm and 9.03 Nm such that the bolt is sufficiently loosen to induce damping and stiffness nonlinearities. The magnitude of base excitation shown in Table 2 is scaled to the higher value such that it can induce nonlinearity when excited to the structure shown in Fig. 7.
Fig. 10Equivalent force at the measured DOFs (excitation frequency 5.9 Hz)
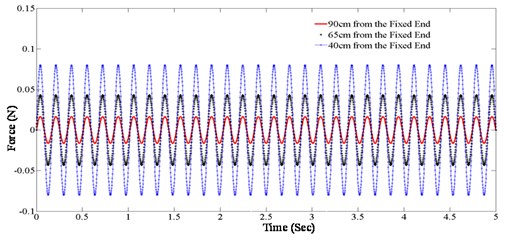
Fig. 11Linear FRF generated from a step-sine test
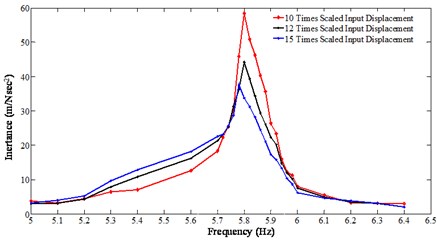
The excitation frequency is varied as shown in Table 2. At each excitation frequency the maximum amplitude of acceleration at each DOF is recorded. The recorded magnitude of acceleration at each DOF is then transformed to the modal space using the mode shapes matrix. The equivalent excitation force for the scaled base excitation at the modal space is obtained from Eq. (13) using the mode shapes matrix. Having the equivalent modal force for Mode 1 and the modal acceleration it is possible to create FRF in the form of inertance (output acceleration/input force). This FRF is plotted across the excitation frequency range to show the nonlinear behavior. Fig. 12 shows the nonlinear FRFs generated with various scaled base excitation shown in Table 2. The scaling is done 10 times, 12 times and 15 times (sufficient input magnitude to induce nonlinear behavior) to induce different input magnitude. Due to the stiffness and damping nonlinearities, there is a shift in natural frequency as shown in Fig. 12. Furthermore, the magnitudes of FRFs are not constant at different excitation magnitudes which show that the system is purely nonlinear. Similarly, Fig. 13 shows the nonlinear FRFs generated when the tightening torque is reduced to 9.03 Nm. Comparing Figs. 12 and 13, one can conclude that the bolted joint induces significant nonlinearities when the bolt is loosen.
Fig. 12Nonlinear FRF generated from a step-sine test (tightening torque 13.55 Nm)
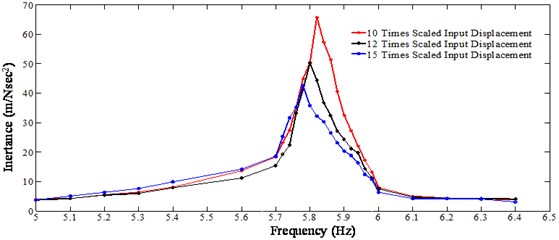
Fig. 13Nonlinear FRF generated from a step-sine test (tightening torque 9.03 Nm)
4.4. Nonlinear parameter identification
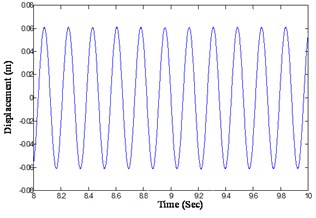
Section 4.3 shows the nonlinear detection and characterization methodology in a base excited structure with joint connection. In this section, the nonlinear system identification methodology that is presented in Section 1.2 is applied to obtain the nonlinear parameters for each excitation frequency and for each preloading condition. The nonlinear parameter identification methodology consists: (i) reconstruction of force vector using the base excitation as an input, (ii) extraction of nonlinear restoring force at the measured DOFs and (iii) the identification of parameters using the multilinear least square regression in a modal space. Since the identification of the nonlinear parameters involved integration of the measured acceleration signal to the displacement and velocity, the analytical integration algorithms is applied by using the measured steady state acceleration response data. Fig. 14 shows the steady state acceleration response data, for an excitation frequency of 5.7 Hz measured at a distance of 0.65 m from the fixed end. This steady state acceleration data is approximated by the analytical function by multilinear least square regression in each time step using Eq. (31). The analytical approximated function and the measured relative acceleration are shown in Fig. 15. The Goodness-of-fit measured in terms of mean square error change is over 99 %. The analytical function thus obtained is analytically integrated to obtain the velocity and displacement using Eqs. (32-33). The analytically integrated velocity and displacement signal are shown in Figs. 16 and 17. The same procedure is repeated for each excitation frequency, each tightening torque, and each base displacement shown in Table 2. Having known the displacement, velocity and acceleration signal at each measured DOF and the mode shape matrix, it is possible to extract the nonlinear modal restoring force using Eq. (19). In order to use Eq. (19) using time domain, we need the reconstructed force at the same scaled displacement. This is obtained by using Eq. (16) and the modal parameters obtained from Fig. 11. Thus obtained nonlinear restoring force is then fitted with the first mode modal parameters using Eqs. (20-23). The procedure is repeated for each excitation frequency, each tightening torque and each scaled base displacement.
Fig. 14Steady state acceleration response of the beam at a distance of 0.65 m from the fixed end (@ tightening torque 13.55 Nm, excitation frequency 5.7 Hz)
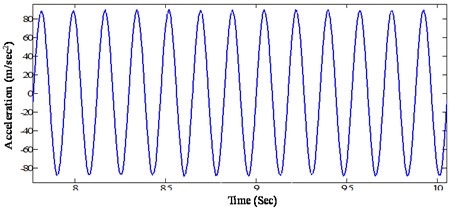
Fig. 15Measured and fitted acceleration response of the beam at a distance of 0.65 m from the fixed end (@ tightening torque 13.55 Nm, excitation frequency 5.7 Hz)
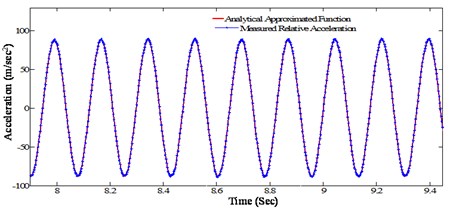
Fig. 16Analytically integrated velocity response of the beam at a distance of 0.65 m from the fixed end (@ tightening torque 13.55 Nm, excitation frequency 5.7 Hz)
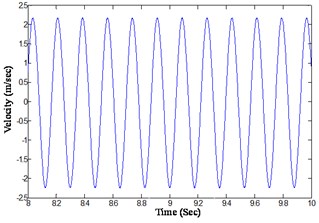
Fig. 17Analytically integrated displacement response of the beam at a distance of 0.65 m from the fixed end (@ tightening torque 13.55 Nm, excitation frequency 5.7 Hz)
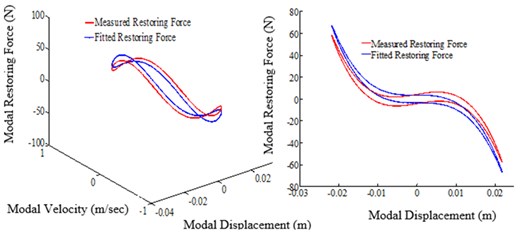
Figs. 18-22 represent the restoring force surface (A) and the hysteresis loop (B) generated for different excitation frequencies with the tightening torque of 13.55 Nm. The base displacements at each excitation frequency are scaled to 12 times higher than that shown in Table 2. The obtained restoring force shown in each figure exhibits the significant softening effect and the energy dissipitation due to slipping at the joint. The identified restoring force surface and the hysteresis loops are over plotted in the same Figure in blue color. As shown in Figs. 20-22 the identified restoring force surface and the hysteresis loop show the significant deviations. It is due to the fact that only three DOFs below and above the joint are taken to capture the entire dynamics and the other possible reason might be due to the imperfect isolation of the mode. However, none of these figures show the coupling between the modes.
The identified nonlinear parameters for each excitation frequency with 12 times scaled base displacement is tabulated in Table 3. Theoretically, the identified stiffness should be constant for each excitation frequency for a constant scaled base displacement and a constant tightening torque. However, the results show the deviation of around 10 %, the more being in resonance. Experiments are always susceptible to noise and uncertainty which may results in such a deviation. The maximum amplitude of displacement along with the identified equivalent damping coefficient for each excitation frequency is tabulated in Table 3.
Fig. 18Restoring force surface (A: 3D surface, B: slice view (X-Z) projection, excitation frequency: 5.7 Hz, tightening torque: 13.55 Nm)
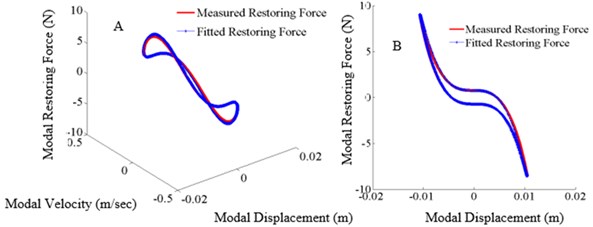
Fig. 19Restoring force surface (A: 3D surface, B: slice view (X-Z) projection, excitation frequency: 5.72 Hz, tightening torque: 13.55 Nm)
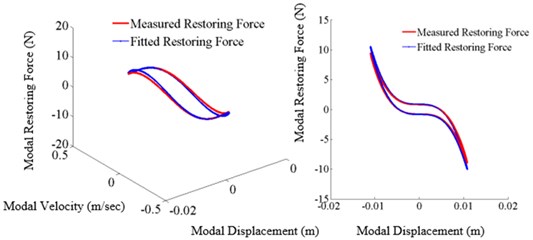
Fig. 20Restoring force surface (A: 3D surface, B: slice view (X-Z) projection, excitation frequency: 5.76 Hz, tightening torque: 13.55 Nm)
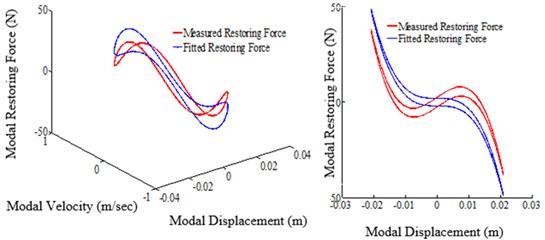
Fig. 21Restoring force surface (A: 3D surface, B: slice view (X-Z) projection, excitation frequency: 5.80 Hz, tightening torque: 13.55 Nm)
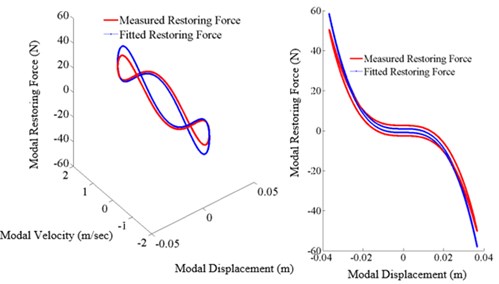
Fig. 22Restoring force surface (A: 3D surface, B: slice view (X-Z) projection, excitation frequency: 5.84 Hz, tightening torque: 13.55 Nm)
Having these two parameters it is possible to reconstruct the function to show the variations of damping as a function of maximum amplitude of displacement. Fig. 23 shows such a plot where the experimentally observed data are shown in the blue dot and the identified function is shown in red. The identified function is obtained by estimating the coefficients in a least square sense using norm 2 error vectors. It should be noted that, to identify the coefficients, one can use the standard multilinear least square regression or norm 2 error vector. Both of the algorithms work in the least square sense and yield the same results.
Table 3Identified nonlinear parameters for different excitations (tightening torque (13.55 Nm, base displacement 12 times scaled))
Excitation frequency (Hz) | Maximum amplitude of displacement (m) | Equivalent damping coefficient (Nm/sec) | Nonlinear stiffness (N/m3) |
5.0 | 0.0037561 | 0.3719 | 6.45×10⁶ |
5.1 | 0.004032564 | 0.3977 | 6.48×10⁶ |
5.2 | 0.004119441 | 0.3859 | 6.27×10⁶ |
5.3 | 0.005152218 | 0.4844 | 6.89×10⁶ |
5.4 | 0.00582531 | 0.5501 | 6.45×10⁶ |
5.5 | 0.007027474 | 0.6901 | 5.37×10⁶ |
5.6 | 0.011041567 | 1.0964 | 5.49×10⁶ |
5.7 | 0.01430621 | 1.5725 | 6.43×10⁶ |
5.72 | 0.018007602 | 1.9305 | 5.41×10⁶ |
5.74 | 0.021065172 | 2.3343 | 5.32×10⁶ |
5.76 | 0.02696584 | 3.1785 | 6.56×10⁶ |
5.78 | 0.034020338 | 4.3003 | 5.79×10⁶ |
5.80 | 0.041965147 | 5.7102 | 6.94×10⁶ |
5.82 | 0.034250879 | 4.3390 | 9.89×10⁶ |
5.84 | 0.0331549196 | 4.3561 | 6.45×10⁶ |
5.86 | 0.032892439 | 4.1127 | 6.63×10⁶ |
5.88 | 0.029781333 | 3.6116 | 5.92×10⁶ |
5.9 | 0.023627431 | 2.6904 | 6.32×10⁶ |
5.92 | 0.019767518 | 2.3601 | 6.23×10⁶ |
5.94 | 0.015829746 | 1.6569 | 6.05×10⁶ |
5.96 | 0.012329365 | 1.2416 | 6.23×10⁶ |
5.98 | 0.009449127 | 0.9225 | 6.48×10⁶ |
6.0 | 0.005643001 | 0.5322 | 5.49×10⁶ |
6.1 | 0.003403679 | 0.3192 | 6.49×10⁶ |
6.2 | 0.002833501 | 0.3669 | 5.89×10⁶ |
6.3 | 0.002680442 | 0.3530 | 5.29×10⁶ |
6.4 | 0.002479834 | 0.3349 | 5.45×10⁶ |
5. Conclusions
This paper presents the theoretical and experimental investigation on nonlinear bolted lap joint. The theoretical investigation is carried out by taking the single mode modal equation in modal coordinate. The amplitude plot at each excitation frequency is shown to differentiate between the linear system, nonlinear system with stiffness nonlinearity and the quadratic damping nonlinearity. Results shows that the presence of softening nonlinearity reduces the amplitude and reduces the natural frequency of the system. Following the theoretical part, the experimental study is carried out in a bolted beam assembly. The linear model parameters of the joint are estimated by exciting the bolted beam assembly with fully tightened bold conditions. Two different tightening torques are used to loosen the bolt, such that the assembly induces the nonlinear effect. At each tightening torque, three different energy level are used to understand the insight of the joint dynamics. The FRFs are plotted at each energy level, at each tightening torque to show the nonlinear effect. The obtained results show that, there exist significant softening effects when the fully tightened bolt is loosened. The nonlinear parameters identification of the joint connection is carried out by using the restoring force surface method. Results show that the identified damping coefficients are fully dependent on the response amplitude. As the response amplitude increases, the damping coefficient increases too. The most significant result that is obtained from the experiment is that the presence of viscous damping as a quadratic function of the amplitude of displacement. The restoring force surface and the hysteresis plots provided the considerable validation of the identified stiffness and the viscous damping terms dependent upon the displacement amplitude.
References
-
Beards C. F. The damping of structural vibration by controlled interfacial slip in joints. Journal of Vibration and Acoustics, Vol. 105, Issue 3, 1983, p. 369-373.
-
Ouyang H., Oldfield M. J., Mottershead J. E. Experimental and theoretical studies of a bolted joint excited by a torsional dynamic load. International Journal of Mechanical Sciences, Vol. 48, Issue 12, 2006, p. 1447-1455.
-
Ibrahim R. A., Pettit C. L. Uncertainties and dynamic problems of bolted joints and other fasteners. Journal of Sound and Vibration, Vol. 279, Issue 3, 2005, p. 857-936.
-
Gaul L., Lenz J. Nonlinear dynamics of structures assembled by bolted joints. Acta Mechanica, Vol. 125, Issues 1-4, 1997, p. 169-181.
-
Padmanabhan K. K., Murty A. S. R. Damping in structural joints subjected to tangential loads. Proceedings of the Institution of Mechanical Engineers, Part C: Journal of Mechanical Engineering Science, Vol. 205, Issue 2, 1991, p. 121-129.
-
Smallwood D., Gregory D., Coleman R. Damping investigations of a simplified frictional shear joint. Proceedings of the 71st Shock and Vibration Symposium, 2000.
-
Marui Etsuo, et al. Dissipation of kinematic energy by slip at the interface of mating surfaces. Wear, Vol. 159, Issue 1, 1992, p. 141-150.
-
Dennis Goege, et al. Advanced test strategy for identification and characterization of nonlinearities of aerospace structures. AIAA Journal, Vol. 43, Issue 5, 2005, p. 974-986.
-
Ma X., Bergman L., Vakakis A. Identification of bolted joints through laser vibrometry. Journal of Sound and Vibration, Vol. 246, Issue 3, 2001, p. 441-460.
-
Hartwigsen Christian J., et al. Experimental study of non-linear effects in a typical shear lap joint configuration. Journal of Sound and Vibration, Vol. 277, Issue 1, 2004, p. 327-351.
-
Segalman Daniel J. Modelling joint friction in structural dynamics. Structural Control and Health Monitoring, Vol. 13, Issue 1, 2006, p. 430-453.
-
Jalali Hassan, Hamid Ahmadian, John Mottershead E. Identification of nonlinear bolted lap-joint parameters by force-state mapping. International Journal of Solids and Structures, Vol. 44, Issue 25, 2007, p. 8087-8105.
-
Avitabile Peter Experimental modal analysis. Sound and Vibration, Vol. 35, Issue 1, 2001, p. 20-31.
-
Heylen Ward, Paul Sas Modal Analysis Theory and Testing. Katholieke Universteit Leuven, Departement Werktuigkunde, 2006.
-
Kerschen Gaetan, et al. Past, present and future of nonlinear system identification in structural dynamics. Mechanical Systems and Signal Processing, Vol. 20, Issue 3, 2006, p. 505-592.
-
Doranga S., Wu C. Q. Parameter identification for nonlinear dynamic systems via multilinear least square estimation. Special Topics in Structural Dynamics, Vol. 6, 2014, p. 169-182.
-
Stefano Marchesiello, Luigi Garibaldi A time domain approach for identifying nonlinear vibrating structures by subspace methods. Mechanical Systems and Signal Processing, Vol. 22, Issue 1, 2008, p. 81-101.
-
Crawley Edward F., Allan Aubert C. Identification of nonlinear structural elements by force-state mapping. AIAA Journal, Vol. 24, Issue 1, 1986, p. 155-162.
-
Masri S. F., ToK Caughey A nonparametric identification technique for nonlinear dynamic problems. Journal of Applied Mechanics, Vol. 46, Issue 2, 1979, p. 433-447.
-
Doranga S., C. Q. Nonlinear system identification technique for a base-excited structure based on modal space formulation. Journal of Computational and Nonlinear Dynamics, Vol. 11, Issue 6, 2016, p. 061016.
-
Gondhalekar A. C., Petrov E. P., Imregun M. Parameters identification for nonlinear dynamic systems via genetic algorithm optimization. Journal of Computational and Nonlinear Dynamics, Vol. 4, Issue 4, 2009, p. 041002.
-
Elizalde H., Imregun M. An explicit frequency response function formulation for multi-degree-of-freedom non-linear systems. Mechanical Systems and Signal Processing, Vol. 20, Issue 8, 2006, p. 1867-1882.
-
Arslan Özge, Murat Aykan, Nevzat Özgüven H. Parametric identification of structural nonlinearities from measured frequency response data. Mechanical Systems and Signal Processing, Vol. 25, Issue 4, 2011, p. 1112-1125.
-
Richardson M., Jamestown C. A. Modal mass, stiffness and damping. Vibrant Technology, Jamestown, CA, 2000.
Cited by
About this article

