Abstract
Vibration measurement based on computer vision has been extensively studied and considered as a wide-range, non-contact measurement method. In this paper, the principle of vibration measurement using out-of-plane vision has been investigated under conventional imaging condition. A measurement model for out-of-plane vision has also been demonstrated. Combined the out-of-plane vision measurement model with the optical flow motion estimation principle, a novel model of optical flow tracking method for vibration detection based on out-of-plane vision has been proposed. It enables the identification of vibration parameters without image feature extraction. Visual vibration detection experiment has been conducted with a cantilever beam and a motor cover. Experimental results have been rigorously compared with finite element simulation to verify the efficacy of the proposed method. It shows that this method can effectively identify vibration parameters of the structure without image feature extraction.
1. Introduction
Structure vibration analysis is of vital significance in performance evaluation and fault diagnosis [1]. Identification of vibration parameters is the key to structure vibration analysis. Traditional vibration analysis methods for vibration parameters identification are usually based on one or more sensors [2]. Those methods need complicated detecting systems and can affect the inherent dynamic characteristics of the structure in a certain extent. Visual measurement has gained popularity as a wide-range, non-contact vibration measurement method.
Visual measurement methods based on structured light, single camera and multi-view stereo vision have been widely studied and applied [3]. Xu, et al. measured with high precision for complex three-dimensional contour and reconstructed a pixel-level three-dimensional structure profile using structure light measurement system [4]. Teyssieux [5], et al. realized an accurate measurement of the in-plane motion displacement of a cantilever beam with micro electromechanical system (MEMS) and high frequency vibration using single high-speed CCD camera and microscope imaging system. Lim [6], et al. recognized two-dimensional motion parameters of a special mark by using only a line-scan camera. One visual measurement system was proposed for observing the pile rebound and penetration movement by employing a high-speed line-scan camera. Among these visual measurement methods, digital image correlation method, high speed photography method, feature extraction method and region matching method are the main methods in image processing. Wang [7], et al. shown a full field measurement of composite board and analyzed the image features by using adaptive moment descriptors to obtain the structural model of the composite board. Guan [8], et al. extracted image motion blur information using geometric moment and proposed a harmonic vibration measurement method based on actively blurred image sequence and geometric moment. Helfrick [9], et al. measured shape and deformation of a mechanical shaker by employing 3D digital image correlation methods in a full-field vibration measurement. Zhan [10], et al. proposed a novel deformable model for automatic segmenting prostates from ultrasound images using statistical texture matching method. Davis [11], et al. presented a method for estimating material properties of an object by examining small motions in video. Chen [12], et al. employed motion magnification for extracting displacements from high speed video and demonstrated the algorithm's capability of qualitatively identifying the operational deflection shapes of simple structures. However, complex algorithm or expensive imaging equipment are required in these above measurement methods, and some of them also need accurate tracking of the target feature. Hence, the visual measurement result is highly related to the camera performance and image feature extraction to a great extent.
Optical flow method employs the pixel motion velocity under image gray model to estimate the speed of a moving object in space. Lucas-Kanade algorithm and its improved algorithm, Horn-Schunck algorithm [13], feature matching method are the main of optical flow algorithms. Optical flow can well depict the object movement in three-dimensional space, which gained extensive application in the field of vision and image processing for object segmentation, recognition, tracking, robot navigation etc. Freeman [14], et al. first used the stroboscopic microscopic visual system to acquire the image sequence on MEMS. They also extracted motion information in the image sequence within two-dimensional plane using optical flow. Denman [15], et al. provided a new optical flow algorithm and minimized the acceleration by searching an expected position based on a constant velocity assumption. Ya [16], et al. proposed a new optical flow algorithm for vehicle detection and tracking. Hui [17], et al. proposed a head behavior detection method based on optical flow. He also established an interactive 3D virtual teaching platform combined with test results. Souhila [18], et al. detected the optical flow field near the robot body to achieve robotics capabilities to avoid obstacles automatically. McCarthy [19], et al. compared the results of different optical flow algorithms for robot navigation combined with spatiotemporal filters. However, the aforementioned application of optical flow still requires expensive equipment or complex operations or feature tracking. Therefore, the proposed vibration measurement method for out-of-plane vision using optical flow method is of great significance. This can be conducted under conventional imaging condition without feature extraction.
In this paper, a novel model of optical flow tracking method for vibration detection based on out-of-plane vision has been proposed and the contributions are summarized as follows: 1) A novel vibration detection method using out-of-plane vision has been established. 2) Combined the principle of optical flow, a novel model of the vibration detection based on out-of-plane vision using optical flow method has been proposed. 3) Three vibration detection methods based on the proposed models with a cantilever beam have been studied. 4) Arbitrary pixel feature points near the edge feature have been chosen for the structure natural frequency recognition, which averts complex edge extraction process and the effectiveness of the proposed method has been verified. 5) Visual vibration detection experiments with a cantilever beam and a motor cover have been implemented to verify the efficacy of the proposed methods. Results indicate that the pixel feature point method can accurately identify the vibration frequency information with low requirement of experiment equipment and environment and can eliminate complex image feature extraction in visual vibration detection. The vibration information is usually vital for applications [20, 21].
The rest of this paper is organized as follows. Section 2 introduces the principle of optical flow and Lucas-Kanade algorithm. Section 3 introduces the basic principle of vibration detection base on out-of-plane vision. Section 4 discusses two optical flow tracking methods for vibration detection based on out-of-plane vision, and three vibration detection strategies with a cantilever beam are given. Section 5 describes the applications of the proposed methods with a cantilever beam and a motor cover. Finally, the paper is concluding with a discussion of this work in Section 6.
2. Principle of optical flow
Optical flow uses the pixel intensity data of image sequences in temporal variation and correlation to determine the movement of pixel position and to obtain the three-dimensional motion field [22, 23]. It has three basic assumptions generally [24]: 1) Constant brightness between adjacent frames; 2) the extraction of video frame is continuous, and the object movement between adjacent frames is relatively small; and 3) the movement of objects maintains spatial consistency, i.e. the pixels of the same sub-image have the same motion.
Set as the luminance of an image pixel at time . According to the constant brightness of optical flow and the assumption of tiny motion, there is:
According to the Taylor series, we have:
where is a high-order error term on, , . From Eq. (1) and Eq. (2), one has:
That is:
where , are the gradient of the image in space and time respectively, and:
Are the optical flow velocity in and components respectively. The above equations also describe the motion state of the object. Although there is some optical flow computation methods, the Lucas-Kanade algorithm is employed in this paper [25].
3. Principle of vibration detection base on the out-of-plane vision
The basic principle of vibration detection based on out-of-plane vision is shown in Fig. 1 according to the pinhole imaging model. One camera is perpendicular to the direction of vibration. Hence, image size will change following the change of object distance caused by the displacement of out-of-plane motion, which contains the structure vibration characteristic information.
Fig. 1Pin-hole model of camera imaging
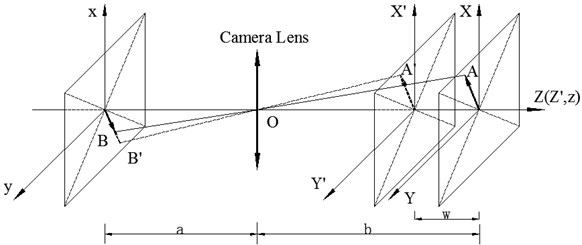
As shown in Fig. 1, is the camera optical center, is the image distance, is the object distance, is an arbitrary point in space at time , space coordinate is . is the image coordinate of point according to the pinhole imaging model. At time , becomes after its out-of-plane motion , and is the image coordinates of point . According to similarity relation, displacement of image is given by:
As only has an out-of-plane motion, , then the above equation can be expressed as:
In Eq. (5), when the object distance increases, the change of measurement caused by the out-of-plane motion will reduce significantly. When is much larger than , Eq. (5) can be rewritten as:
Similarly:
where is a ratio representing the relationship between the image distance and the object distance. Consequently, out-of-plane motion can be represented by the pixel displacement of target image. Supposing is the modal function of the system, is the unit impulse response of the system, then, out-of-plane motion can be expressed [24] by:
From Fig. 1 and Eqs. (6) and (7), on the one hand, the image coordinate of a certain point on the space (, are constants) is the function of time. On the other hand, the space point of a certain point in the video (, are constants) is also the function of time. Substituting into Eqs. (6)-(8), yields:
In this case, the displacement of the pixel reflects the out-of-plane motion of the object, where , , , have the same periodic component. From the above analysis, the pixel position of the target feature needs to be known exactly when applying the change of pixel displacement for measuring out-of-plane motion. Therefore, image feature extraction and recognition are the key to this method.
4. Principle of optical flow tracking for vibration measurement
4.1. The Estimation of the out-of-plane vibration ( direction) of the space feature point
According to Eq. (9), keeps constant in this case. The image coordinate of point is the time function. Combined with the definition of optical flow in Eq. (4), there is:
Similarly:
Then:
In this case, optical flow can be obtained from the differential of the impulse response function. As the space feature point in the image coordinate is different at different moments, this method also requires accurate tracking of image feature point in order to confirm the optical flow of the space feature point. The method is named as space feature point method.
4.2. The estimation of the space motion of the pixel feature point
According to Eq. (9), the image coordinates of keeps constant in this case. Its space coordinate and will be the time function. Combined with the definition of optical flow in Eq. (4), one has:
Similarly:
Then:
In this case, optical flow can be obtained from the product of three cycles of the same signal. Since the image coordinate of calculating the optical flow keeps constant, pixel feature point tracking is not needed. Hence this method is named as pixel feature point method.
4.3. Optical flow tracking for vibration detection methods with a cantilever beam
The first order vibration mode function of the cantilever beam is given by:
where is the eigenvalue of the first-order vibration mode, and is the length of the cantilever beam. Impulse response function is given in Eq. (13) as:
where is natural frequency of the cantilever beam, is the damping ratio. , .
Then, the cantilever beam vibration displacement function can be obtained as [26]:
According to Eq. (9), pixel displacement of the object’s out-of-plane motion is:
Combining Eq. (10) with Eq. (14), the vibration velocity of the space feature point with the cantilever beam can be obtained as:
Substituting Eq. (11) into Eq. (14), the vibration velocity of the pixel feature point with the cantilever beam can be obtained as:
It’s widely known that vibrational frequencies can be obtained by the frequency domain analysis of the object’s vibration signal. In Section 3, the object’s out-of-plane motion can be represented by the pixel displacement of target image. Hence, its vibrational frequencies can be achieved by the Fourier transform of pixel displacement. From this section, the pixel displacement can also be changed by the optical flow of the object. Consequently, its vibrational frequencies can be obtained by the Fourier transform of optical flow of the object.
5. Experimental analysis
5.1. Experimental system
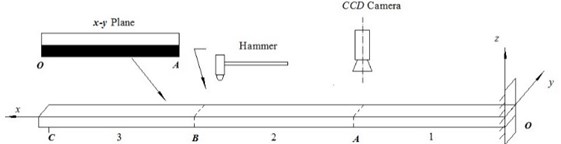
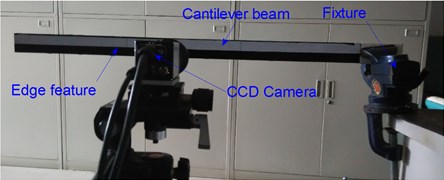
Experiments were carried out to validate the effectiveness of the proposed method. An experimental system was constructed as shown in Fig. 2. The camera is Germany Baumer’s TXG03c CCD camera, whose highest resolution is 656×490 and its maximum frame rate of the highest resolution is 90 Fps. The camera was placed on the - plane, and the central axis of the camera was parallel to the -axis in the experiment. The cantilever beam was an aluminum alloy plate, with length ( direction) 550 mm, width ( direction) 30 mm and height ( direction) 3 mm. The density of the cantilever beam is 2800 Kg/m3, and its Young’s modulus is 6.3× Pa. The black and white border line in the middle of the cantilever beam’s - plane is the characteristic line. This experiment was carried out under the 140×140 resolution of the camera and frame rate for 150 Fps. The hammer excitation was at point B.
Fig. 2a) The schematic diagram of the experiment setup; and b) experimental device figure
a)
b)
5.2. Data analysis and comparison
5.2.1. Comparison of three kinds of vibration detection methods
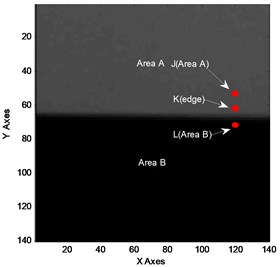
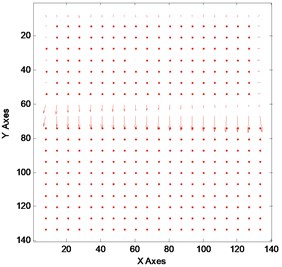
Fig. 3 shows the original image with the optical flow calculation image at 2 s, and the optical flow field at 2 s.
Fig. 3a) The original image at t= 2 s; b) optical flow field at t= 2 s
a)
b)
The result of the experimental data is analyzed using Eqs. (15)-(17). Due to the lack of the texture in -direction, the optical flow in -direction will temp to be zero which is verified in Fig. 3(b). The time-domain response signals obtained by the three methods of point are illustrated in Fig. 4.
From Figs. 4(a) and 4(b), it’s clear that edge pixel coordinates changing method and the optical flow method with space feature point exist certain phase difference. According to Eq. (15) and Eq. (16), the certain phase difference is . When the damping ratio tends to be zero, will tend to be 90 degree (in red straight line). According to Eq. (10), optical flow is the first-order differential of displacement. It has more noise components when the experimental data is analyzed using optical flow method with space feature point. This is verified by Fig. 4(b). From Fig. 4(c), waveform in the region C is a constant. The result could be caused by two reasons. One is the lack of the texture in A and B regions as shown in Fig. 3(a), the other is the composition of the optical flow obtained by Eq. (17). However, . This means that the product of the three cycles of the same signal can’t keep constant in a small district. Therefore, the lack of the texture in A and B regions will cause the corresponding and to be zero. Eventually, it will lead optical flow in the C region to be zero.
Fig. 4a) The time-domain response signal of edge pixel coordinates changing method; d) the time-domain response signal of optical flow method with space feature point; and c) the time-domain response signal of optical flow method with pixel feature point
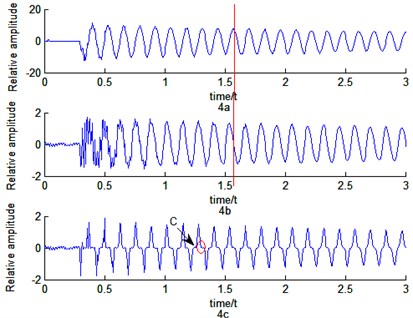
Fig. 5a) The frequency response of edge pixel coordinates changing method; b) the frequency response of optical flow method with space feature point; and c) the frequency response of optical flow method with pixel feature point
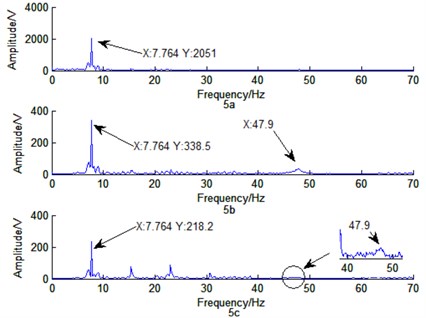
Fig. 5 shows the corresponding frequency curve in Fig. 4. From Fig. 5, these three methods can effectively measure the first-order natural frequencies with 7.76 Hz, while the simulation result of ANSYS is 7.96 Hz. The second-order natural frequency of structure can’t be recognized in Fig. 5(a). However, Fig. 5(b) and Fig. 5(c) show that the second-order natural frequency of structure is 47.90 Hz, while the simulation result of ANSYS is 49.88 Hz. High-order harmonic components exist in Fig. 5(c). According to Eq. (17), optical flow is obtained from the product of three cycles of the same signal, and . As a result, higher-order harmonic components will appear in the frequency response curve of this method. Nevertheless, the method in Fig. 5(c) (pixel feature point method) does not require edge extraction, while the accuracy identification of vibration parameters in Fig. 5(a) and Fig. 5(b) is highly depended on edge feature extraction.
5.2.2. Comparison of arbitrary pixel feature points
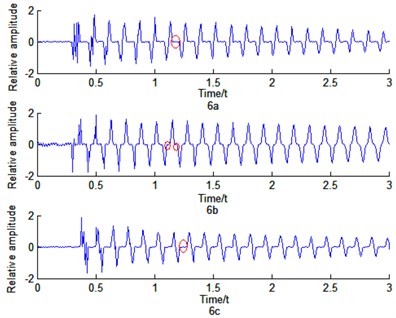
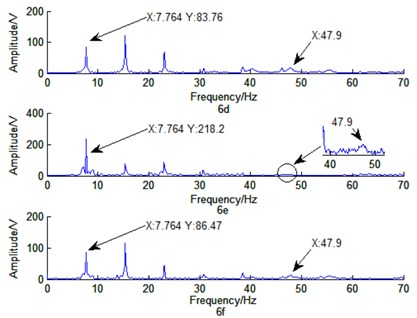
In order to further illustrate the advantage of pixel feature point method, arbitrary pixel feature points J, K, L close to the edge feature are chosen in Fig. 3(a). The optical flow velocity of the three points is obtained by Eq. (17). Fig. 6 shows the time-domain response and the frequency response of the three points.
From Figs. 6(a)-6(c), the time of constant region (in red circles) are unlike due to the different selection of feature points. The moment passing the area A and area B whose texture are not rich enough will change correspondingly with different feature points. From Figs. 6(d)-6(f), the arbitrary pixel feature points around the edge feature can effectively be used to recognize the natural frequency of structure. However, the amplitudes corresponding to the natural frequency are different. The amplitude of the nature frequency is depended on the richness of image texture. The image texture of point J is close to that of point L in Fig. 3(a), and the amplitudes of nature frequency are similar as shown in Fig. 6(d) and Fig. 6(f). Nevertheless, the method with pixel feature point using optical flow can effectively obtain the vibration characteristics of out-of-plane motion at arbitrary points. This avoids complex edge extraction process.
Fig. 6a) The time-domain response of J; b) the time-domain response of K; c) the time-domain response of L; d) the frequency response of J; e) the frequency response of K; and f) the frequency response of L
5.2.3. Comparison with other methods for identification of vibration parameters
Vibration measurement using an accelerometer is a traditional vibration analysis method, while edge detection is a common and mature image analysis method. Hence, the above two methods and optical flow method with pixel feature point, which avoids complex edge detection process in vibration measurement, were employed for the motor cover vibration parameters identification as shown in in Fig. 7. In the experiment, the rated speed of the motor is 3000 r/min. Hence the theoretical rotating frequency can be obtained by equation 50 Hz ( is the rotating frequency and n is the rated speed of the motor). The type of ICP piezoelectric accelerometer is PCB-333B45, and the type of data acquisition card is NI 9234.
Time domain response of the three methods and its corresponding frequency response are shown in Fig. 8. The first order natural frequency of the motor cover can be obtained by Fig. 8. The comparison of experimental results with theoretical value is described in Table 1.
From Table 1, it is obvious that accelerometer test method has the highest percentage error. This is due to the change of the inherent dynamic characteristics caused by the accelerometer. Edge detection method has a medium percentage error. It is highly depended on the accuracy of edge feature extraction. Thus, edge detection method has certain requirements for imaging equipment and environment. Expensive imaging equipment such as high resolution camera, or additional high brightness lighting conditions will improve the accuracy identification of vibration parameters. The optical flow tracking method with pixel feature point can effectively recognize the vibration parameters of the structure without image feature extraction. Moreover, compared with the edge extraction method, the optical flow method with pixel feature point has lower recognition error.
Fig. 7Motor cover measuring system
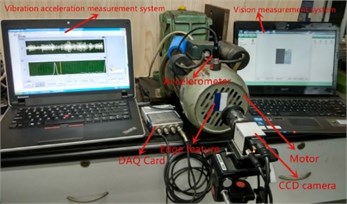
Fig. 8a) The time-domain response signal of the accelerometer test method; b) the time-domain response signal of edge detection method; c) the time-domain response signal of optical flow method with pixel feature point; d) the frequency response of the accelerometer test method; e) the frequency response of edge detection method; and f) the frequency response of optical flow method with pixel feature point
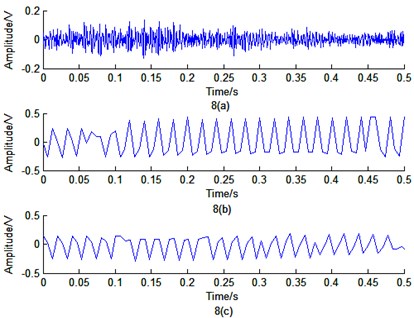
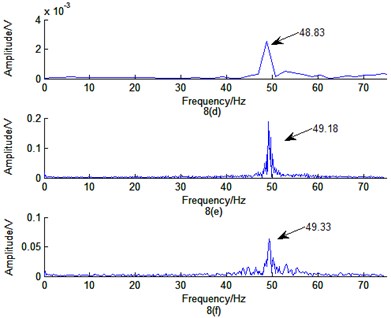
Table 1Comparison of experimental results with theoretical value
Accelerometer test method | Edge detection method | Optical flow method | Theoretical value | |
Measured value | 48.83 Hz | 49.18 Hz | 49.33 Hz | 50 Hz |
Percentage error | 2.34 % | 1.64 % | 1.34 % |
6. Conclusions
Visual measurement has the advantages of non-contact, wide-range etc. Traditional image processing methods require matching features, boundary feature extraction, complex operations, complicated and expensive imaging equipment. Optical flow estimates space motion by analyzing the image brightness variance. In this paper, a model of vibration detection based on out-of-plane vision has been investigated. Two basic models of optical flow tracking method for vibration detection based on out-of-plane vision have been established according to the principle of the optical flow motion estimation and the model of vibration detection. Visual vibration detection experiments with a cantilever beam and a motor cover have been conducted successfully to verify the efficacy of the proposed models compared with finite element simulation. It shows that the proposed pixel feature point method can effectively recognize the vibration frequency information without image feature extraction under conventional imaging condition.
Optical flow tracking method for vibration detection based on out-of-plane vision in this paper still requires further study in the following three aspects: 1) Optical flow is obtained from the product of three cycles of the same signal in Eq. (11). More attention should be paid to separate the signal to obtain vibration mode function; (2) Amplitudes of different feature points are different as shown in Fig. 6. Further study will attempt to address the impact of the texture on the identification of vibration parameters; and (3) Vision measurement signal in the experiment is the vibration signal of out-of-plane motion. The focus of our further works is three-dimensional complex vibration analysis, and a general optical flow method of three-dimensional vibration needs to be established.
References
-
Li C., Sanchez R.-V., Zurita G., Cerrada M., Cabrera D., Vásquez R. E. Multimodal deep support vector classification with homologous features and its application to gearbox fault diagnosis. Neurocomputing, Vol. 168, 2015, p. 119-127.
-
Li C., Cabrera D., de Oliveria V. J., Sanchez R.-V., Cerrada M., Zurita G. Extracting repetitive transients for rotating machinery diagnosis using multiscale clustered grey infogram. Mechanical Systems and Signal Processing, Vols. 76-77, 2016, p. 157-173.
-
Wang H. P., et al. Vision servoing of robot systems using piecewise continuous controllers and observers. Mechanical Systems and Signal Processing, Vol. 33, 2012, p. 132-141.
-
Xu J., et al. An absolute phase technique for 3D profile measurement using four-step structured light pattern. Optics and Lasers in Engineering. Vol. 50, Issue 9, 2012, p. 1274-1280.
-
Teyssieux D., Euphrasie S., CretinB. MEMS in-plane motion/vibration measurement system based CCD camera. Measurement, Vol. 44, Issue 10, 2011, p. 2205-2216.
-
Lim M.-S., Lim J. Visual measurement of pile movements for the foundation work using a high-speed line-scan camera. Pattern Recognition, Vol. 41, Issue 6, 2008, p. 2025-2033.
-
Wang W., Mottershead J. E. Adaptive moment descriptors for full-field strain and displacement measurements. Journal of Strain Analysis for Engineering Design, Vol. 48, Issue 1, 2013, p. 16-35.
-
Guan B. Q., Wang S. G., Wang G. B. A biologically inspired method for estimating 2D high-speed translational motion. Pattern Recognition Letters, Vol. 26, Issue 15, 2005, p. 2450-2462.
-
Helfrick M. N., et al. 3D digital image correlation methods for full-field vibration measurement. Mechanical Systems and Signal Processing, Vol. 25, Issue 3, 2011, p. 917-927.
-
Zhan Y. Q., Shen D. G. Deformable segmentation of 3-D ultrasound prostate images using statistical texture matching method. IEEE Transactions on Medical Imaging, Vol. 25, Issue 3, 2006, p. 256-272.
-
Davis A., et al. Visual vibrometry: estimating material properties from small motions in video. Proceedings of the IEEE Conference on Computer Vision and Pattern Recognition, 2015, p. 5335-5343.
-
Chen J. G., et al. Modal identification of simple structures with high-speed video using motion magnification. Journal of Sound and Vibration, Vol. 345, 2015, p. 58-71.
-
Sun D., et al. Secrets of optical flow estimation and their principles. IEEE Conference on Computer Vision and Pattern Recognition (Cvpr), 2010, p. 2432-2439.
-
Hemmert W., et al. Nanometer resolution of three-dimensional motions using video interference microscopy. 12th IEEE International Conference on Micro Electro Mechanical Systems, Technical Digest, 1999, p. 302-308.
-
Denman S., Chandran V., Sridharan S. An adaptive optical flow technique for person tracking systems. Pattern Recognition Letters, Vol. 28, Issue 10, 2007, p. 1232-1239.
-
Ya L., et al. Optical flow based urban road vehicle tracking. 9th International Conference on Computational Intelligence and Security (CIS), 2013, p. 391-395.
-
Hui S., Qijie Z., Dawei T. Head behavior detection method based on optical flow theory. International Conference on Intelligent Environments (IE), 2014, p. 102-106.
-
Souhila K., Karim A. Optical flow based robot obstacle avoidance. International Journal of Advanced Robotic Systems, Vol. 4, Issue 1, 2007, p. 13-16.
-
McCarthy C., Barnes N. Performance of optical flow techniques for indoor navigation with a mobile robot. IEEE International Conference on Robotics and Automation, 2014, p. 5093-5098.
-
Li C., Liang M., Wang T. Criterion fusion for spectral segmentation and its application to optimal demodulation of bearing vibration signals. Mechanical Systems and Signal Processing, Vol. 64, Issue 65, 2015, p. 132-148.
-
Li C., Sanchez V., Zurita G., Lozada M. C., Cabrera D. Rolling element bearing defect detection using the generalized synchrosqueezing transform guided by time-frequency ridge enhancement. ISA Transactions, Vol. 60, 2016, p. 274-284.
-
Song X., Seneviratne L. D., Althoefer K. A Kalman filter-integrated optical flow method for velocity sensing of mobile robots. IEEE-ASME Transactions on Mechatronics, Vol. 16, Issue 3, 2011, p. 551-563.
-
Barron J. L., Fleet D. J., Beauchemin S. S. Performance of optical flow techniques. International Journal of Computer Vision, Vol. 12, Issue 1, 1994, p. 43-77.
-
Beauchemin S. S., Barron J. L. The computation of optical flow. ACM Computing Surveys (CSUR), Vol. 27, Issue 3, 1995, p. 433-466.
-
Mahalingam V., et al. A VLSI architecture and algorithm for Lucas-Kanade-based optical flow computation. IEEE Transactions on Very Large Scale Integration (Vlsi) Systems, Vol. 18, Issue 1, 2010, p. 29-38.
-
Yoo H. H., Shin S. H. Vibration analysis of rotating cantilever beams. Journal of Sound and Vibration, Vol. 212, Issue 5, 1998, p. 807-828.
Cited by
About this article

The work is supported by the National Natural Science Foundation of China (Grant No. 51374264), the Open Project of CTBU (KFJJ201501002), and the CSTC Project (cstc2015jcyjA70007). The valuable comments and suggestions from the editor and the two anonymous reviewers are very much appreciated.
