Abstract
Feature extraction is one of the core problems in condition monitoring and fault diagnosis of mechanical equipment. In this study, an OMP-NWE method of feature extraction is proposed, aiming at the problem of low accuracy of existing feature extraction method. The OMP-NWE method integrates the strengths of orthogonal matching pursuit (OMP) algorithm with the benefits of nonparametric waveform estimation (NWE). Signal feature extraction model is constructed by design of filter bank and adaptive template signal. Then the vibration signal is linearly decomposed into a set of best matching waveform, which solves the problem that the basis function must be chosen in advance in OMP algorithm. The OMP-NWE method is applied to the feature extraction of the simulation and experimental vibration signal of rolling bearing, compared with the traditional OMP algorithm. Results show that the SNR of the extracted feature signal using OMP-NWE method increased by 19.22 % compared with that using the OMP method, which illustrates that OMP-NWE method has a higher accuracy in the feature extraction of unknown complex vibration signals. This work provides a new idea and a successful example for the feature extraction of vibration signal in the condition monitoring and fault diagnosis of mechanical equipment.
1. Introduction
In the condition monitoring and fault diagnosis of mechanical equipment, how to accurately extract the feature signal from the complex vibration signals is one of the key problems [1, 2]. In the acquisition process of vibration signals, a variety of symbiotic factors such as noise and signal modulation caused the redundant information. Therefore, the feature components of mechanical fault are often sparse in the whole vibration signal (or in certain transform domain). In other words, the feature extraction of vibration signal in equipment condition monitoring and fault diagnosis essentially is a redundancy compression process of information. Based on this, the sparse decomposition algorithms, which can accurately characterized and extracted different components and details of the signal, have become a new research hotspot in the feature extraction of vibration signal [3].
Mota et al. proposed a distributed algorithm, Basis Pursuit algorithm for solving the optimization problem, which is a decentralized implementation of the alternating direction method of multipliers [4]. He and Ding put forward an iterative transient feature extraction approach based on time-frequency domain sparse representation to extract the transients from the bearing vibration or acoustic signals [5]. Cui et al. studied an adaptive matching pursuit algorithm that uses an impulse dictionary for rolling bearing vibration signal processing and fault diagnosis [6]. He et al. divided the fault signal into segments and the matching pursuit algorithm was carried out by segments, so that the fault feature was extracted successfully [7].
Compared to above signal sparse decomposition algorithms, OMP algorithm [8] can find the global optimal solution [9, 10]. Schiavazzi et al. proposed a novel nonintrusive, i.e., sampling-based, framework for approximating stochastic solutions of interest admitting sparse multiresolution expansions, which was applied to quantifying the efficiency of a passive vibration control system operating under uncertainty [11]. Li and Varshney studied micro-doppler parameter estimation via parametric sparse representation and pruned orthogonal matching pursuit [12]. Wang et al. detected fault features from a small number of samples based on orthogonal matching pursuit approach, which can overcome the shortcomings of the multiple down-sample algorithm [13].
Anyway, OMP method although has the optimal iteration to obtain favourable matching results, the priori knowledge of the vibration signal must be known in advance. In another words, we must design different basis function with different characteristic according to the compositions of original signal, in order to construct reasonable over-complete dictionary of atoms, so that the sparse decomposition results can preferably meet the requirements of the feature signal [14]. When OMP method is applied to the condition monitoring and fault diagnosis of mechanical equipment, in order to describe the time-varying characteristics of nonstationary vibration signals, the atoms of over-complete dictionary must preserve superb time-frequency concentration, namely in the time and frequency domain both have good resolution [15]. As a matter of fact, this is very difficult. Previous studies have mainly focused on the existing analytical dictionary, which cannot satisfy the requirements of high precision in the characterization of the internal components of the fault signal, noise reduction and weak feature extraction [16].
Therefore, in the current work we aimed to propose a new feature extraction method to overcome the shortcoming of OMP algorithm that the basis function must be chosen in advance, which can more accurately extract the feature of complex vibration signal. The main objectives of this study were four folds: (1) to establish the model of OMP-NWE method by introducing the NWE methods; (2) to design the adaptive template signal and the filter banks to make the extracted feature waveform have the characteristics of physical interpretation and can adjust the shape and position; (3) to design the efficient algorithm of OMP-NWE method to realize the feature extraction of vibration signal; (4) to validate OMP-NWE method through the simulation and engineering experiment.
2. Materials and methods
2.1. Principle of orthogonal matching pursuit
The basic principle of OMP algorithm is to form an over-complete dictionary of atoms using different basis functions with different feature waveforms. Through the gradual iteration, the best atom is selected to match the waveform of vibration signal. In order to ensure the best direction and global optimal solution in each iteration, the selected atoms must be orthogonal. Then the signal is projected in the space composed by the processed atoms to obtain the component and residual component on the selected atom. The global optimal solution can be found by ensuring that the residual signals are orthogonal to all the selected atoms. OMP is an iterative greedy algorithm, and its basic process is as follows [18]:
is Hilbert space, , is the over-complete dictionary for sparse decomposition. is the parameter set, is the atom defined by parameter , and . Assuming the signal to be decomposed is , , by orthogonal projection in , can be decomposed as:
where , is the residual signal of the approximation of at direction.
Obviously, and are orthogonal. So, we can obtain:
In order to make the residual signal as little as possible, the selected optimal vector should satisfy with:
where is parameter set and , is optimal factor which meets . Using the same method can be continually approximated.
In the iterative process of the matching pursuit algorithm, the best matched atom and the previously matched atom are not orthogonal. Therefore, when the projection of the approximation error on atom is calculated, a new component will be generated along the direction .
In order to avoid the non-orthogonal projection and over-matched phenomenon, OMP adopted Gram-Schmidt orthogonalization procedure to guarantee that best matched atoms of every selection in each iteration are orthogonal to the previous best matched atoms. Let be , we can select the best matched atom in accordance with Eq. (3), then the atom can be orthogonal to the obtained atom. The equation is as follows:
The approximation error is redefined as:
In this case the residual signal is the orthogonal projection in the space, whose complement space is composed of . From Eq. (4), we can obtain:
Then we can deduce:
As and are orthogonal, Eq. (8) can be derived:
If , and , and all the atoms that are selected previously are orthogonal, then all the vectors of are linearly independent with each other. Thus, we can deduce:
2.2. Model of OMP-NWE method
Suppose that the vibration signal is composed of the feature signal and the noise , which is expressed as:
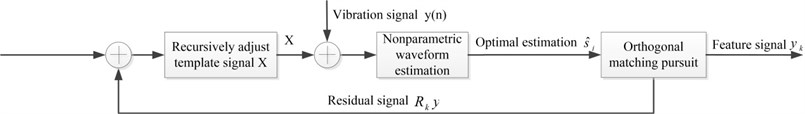
Because the compositions of are not clearly known, it is difficult to extract the feature signal directly using OMP algorithm. Therefore, we propose a novel feature extraction method in this paper, as shown in Fig. 1. The basic procedure is as following: first of all by choosing the proper filter bank and template signal, the template signal is adaptively adjusted in the iteration of OMP. Then the optimal estimation of the signal feature components is calculated by using the nonparametric waveform estimation method. Then update the signal residue and further find out the optimal estimation according to the OMP principle. Repeat this procedure until the energy of the signal residue has met the requirements.
Fig. 1Model of OMP-NWE method
The basis function isn’t taken into account in the proposed method, but in order to accurately extract the feature of the signal, it is necessary to select the appropriate filter bank and the template signal. Filter bank should be selected to ensure that the frequency response of each sub filter does not overlap. Therefore, the frequency response of sub filter should meet the request as following:
Ideal template signal should contain all the components of the vibration signal y, otherwise the solved results maybe not fit the real cases to a great extent. In the engineering practice the waveform of vibration signal is not clearly known, so it is difficult to design an appropriate template signal. In this paper, a reasonable method of selecting the template signal is given, that is, a recursive algorithm is introduced in each iteration of OMP. According to Eq. (12), the template signal is adaptively adjusted:
In Eq. (12), compensation factor , is the template signal in the times iteration, and is the template signal in the times iteration. In order to improve the SNR of the template signal, the output with larger energy in the filter bank is usually chosen as the basis function by Eq. (13) [19]:
2.3. Algorithm design
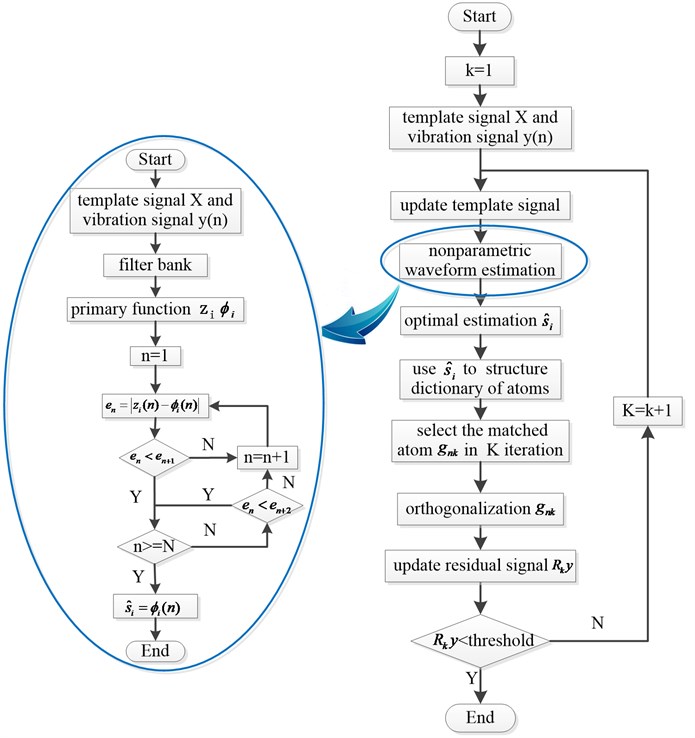
After determining the template signal and filter bank, the specific algorithm steps to extract the signal feature are shown in Fig. 2:
(1) Set the initial value: signal residue , arbitrarily select a simple function as a template signal.
(2) Repeat step (3) to step (5) until the termination condition has been met, where is the predetermined threshold and .
(3) Calculate Eq. (12) by using the adaptive template signal to update the template signal .
(4) Calculate the optimal estimation using NEW method. That is to say the vibration signal y and the template signal are transformed in the same filter bank, then they are matched according to the principle of minimum mean squared error. Finally, the optimal estimation is obtained by the linear superposition of every optimal estimation [20].
(5) Update the signal residue .
Fig. 2Algorithm flow chart
2.4. Simulation and engineering verification
2.4.1. Simulation verification
Because of the structure characteristics and working principle of the rolling bearing, the early failure is often local pitting of some parts. When the moving parts contact with the position of the local pitting, the impact force will be produced. The periodic impact attenuation signal is the typical vibration signal of fault bearing. In addition, improper installation will lead to misalignment or unbalance of bearing, and then the bearing will produce an additional incentive in operation which will cause strong vibration. The vibration is a periodic sinusoidal signal that is also a typical characteristic of fault bearing.
Therefore, in the condition monitoring and fault diagnosis of rolling bearing, the most common vibration signal of rolling bearing fault is composed of fundamental frequency signal, harmonic signal, the impact attenuation signal and noise. The waveform of fundamental frequency is the same as sinusoidal and cosine wave; harmonic frequencies are integer multiples of the fundamental frequency, also similar to the sinusoidal and cosine signals; impact attenuation signals are similar to an exponential decay signals; the noise of the vibration signal is approximate to white noise. So, the simulation signal is consisted of the sinusoidal and cosine signals with different frequencies, exponential decay signals and white noise, which is expressed as:
where 12, 10, 10.5 Hz, 0.1, , 8, 5, 15 Hz, 0.5,, 15, 20.5 Hz, , 1, 30 Hz, .
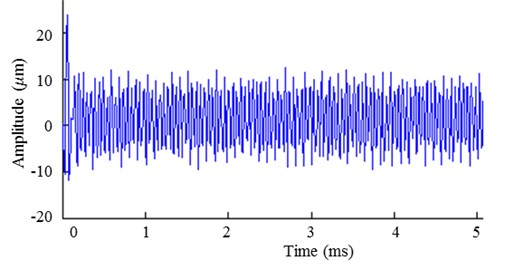
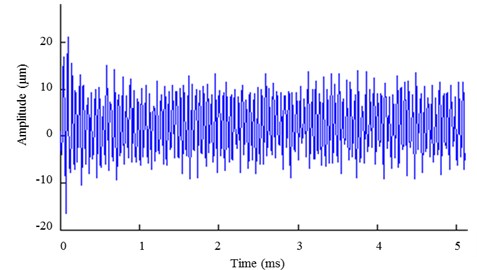
The sampling interval is 0.01 s, is Gauss white noise with a mean value of 0 and a variance of 1. The time domain of simulation signal is shown in Fig. 3. From the waveform it can be found that the impact attenuation signal and the sinusoidal and cosine signal are aliasing together. It is difficult to accurately extract the feature signal using the general method.
Fig. 3The time domain of simulation signal
2.4.2. Engineering verification
In order to verify the feature extraction effect of the proposed OMP-NEW method, an experiment table of rotor vibration was built, including the experimental bearing NSK#1302 (the detailed parameters are shown in Table 1), spindle, bearing seat, inverter motor, frequency converter and vibration sensor, shown in Fig. 4.
The eddy current displacement sensor (YXS-DWA) was selected to collect vibration signals caused by bearing failure, because of its wide linear range, the strong anti-interference ability, wide dynamic range, and less requirement on the installation position. Detailed performance parameters of the sensor are shown in Table 2. In the experiment, the rotation of rotor was driven by inverter motor. Frequency converter can control the speed of the inverter motor. Experimental bearings with the faults of pitting and unbalance were installed on the motor drive end of the rotor. Eddy current displacement sensor was installed on the bearing seat to collect the change of radial displacement of the bearing during the rotor rotation, which reflects the change of the relative clearance caused by the bearing fault.
Fig. 4Experiment table of rotor vibration
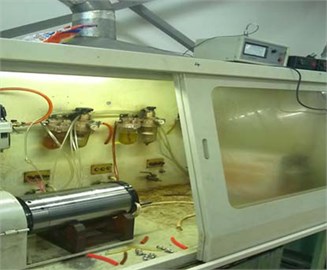
Table 1Bearing parameters
Type | Numbers of rolling element | Diameter of rolling element | Pitch diameter | Contact angle |
NSK#1302 | 10 | 6.2 | 27.5 | 9° |
Table 2Parameters of the displacement sensor
Type | Range (mm) | Nonlinear (% FS) | Frequency response (KHz) | Power (V) |
YXS-DWA | 0-5 | 1.5 | 0-10 | ±12 |
In the experiment the rotor speed was 2000 r/min, the sampling period was 0.01 s, sampling points of a period was 512, the time domain of experiment signal was shown in Fig. 5.
Fig. 5The time domain of experiment signal
3. Results and discussions
3.1. Simulation verification
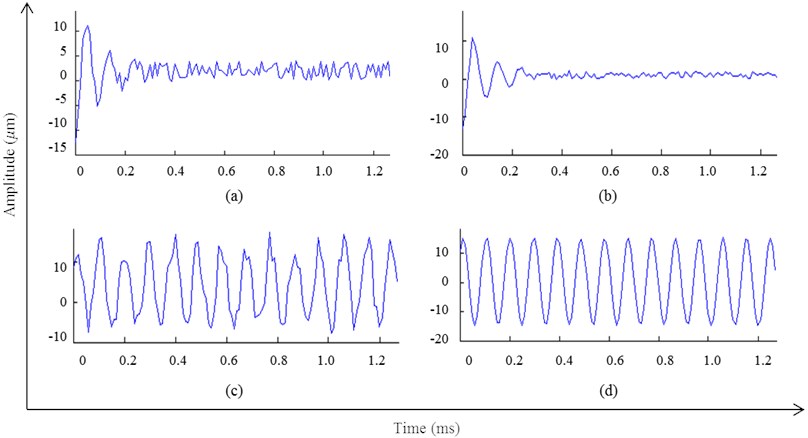
In order to verify the accuracy of the OMP-NWE method proposed in this paper, OMP method and the proposed method are respectively used to extract the features of the simulation signals. The results are shown in Fig. 6.
Fig. 6(a) and (b) have shown that the matched signal for the first time is the impact attenuation signal when the vibration of rolling bearing is abnormal. It is different from the template signals. The signal waveform extracted by OMP-NWE method is obviously smoother than that extracted by OMP. Furthermore, the amplitudes of the signal are almost the same. Thereby the waveform extracted by OMP-NWE method can better embody the signal characteristics.
From Fig. 6(c) and (d), it can be seen that the matched signal for the second time is the sinusoidal signal, which is the fundamental frequency vibration signal of the rolling bearing. It has the same characteristics as the original template signal. The signal extracted by OMP has serious distortion due to the noise, shown in Fig. 6(c), while the extraction waveform using OMP-NWE method is smoother, shown in Fig. 6(d). The result indicates that OMP-NWE method is good at restraining the distortion of the signal and can better representation the signal characteristics.
Fig. 6Time-domain graph of feature extraction of the simulation signal, a) matched with OMP for the first time; b) matched with OMP-NWE method for the first time; c) matched with OMP for the second time; d) matched with OMP-NWE method for the second time
With the purpose of comparing the results of two methods more specifically, the SNR was introduced to evaluate the extraction effect of the signal. The results are shown in Table 3.
It can be obtained from the simulation results, the highest SNR of the feature signal extracted by OMP is 14.9783; while it extracted by OMP-NWE method is 17.8573. The SNR increased by 19.22 %. That is to say even though the initial values of selected template signal are not similar to the signal characteristics, the feature waveform still can be extracted by OMP-NWE method, and the extraction accuracy is better than that of OMP method.
Table 3Comparison of simulation results
Feature extraction of simulation signal | SNR | |
OMP method | OMP-NWE method | |
Matched signal for the first time | 13.5935 | 16.1368 |
Matched signal for the second time | 14.9783 | 17.8573 |
3.2. Engineering verification
3.2.1. Results of feature extraction
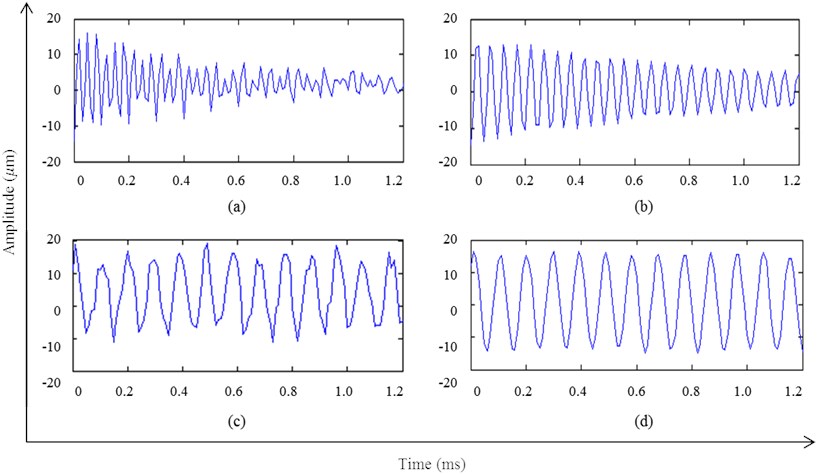
Using OMP and OMP-NWE method in this paper, the feature extraction results of the experimental signal are shown in Fig. 7.
Fig. 7(a) and (b) have shown the time domain graphs of the experimental signal for the first feature extraction. The matched signal of feature extraction is the impact attenuation signal caused by the abnormal vibration of rolling bearing, which is different from the characteristics of the preliminary template signal. The signal extracted by OMP jitter due to the superposition of noise signal, shown in Fig. 7(a), while the impact attenuation component of the vibration signal extracted by OMP-NWE method is significantly enhanced, which effectively suppresses the influence of the inherent component in the original signal, shown in Fig. 7(b).
Fig. 7(c) and (d) have shown the time domain graphs of the experimental signals for the second feature extraction. As can be seen from the experimental results, the matched signal of feature extraction is the fundamental frequency sinusoidal signal, which has the same characteristics as the original template signal. In Fig. 7(c) the feature signal extracted by OMP has a deviation with the real signal, and the effect of de-noising is not very obvious; instead in Fig. 7(d) the extraction waveforms in OMP-NWE method is smoother than that in OMP method, which can further reserve the characteristic signal and restrain the distortion of the signal.
Fig. 7Time-domain graph of feature extraction of the experimental signal, a) matched with OMP for the first time; b) matched with OMP-NWE method for the first time; c) matched with OMP for the second time; d) matched with OMP-NWE method for the second time
Compared the SNR of extracted signal in Table 4, the highest SNR of the feature signal extracted by OMP is 14.2582; while it extracted by OMP-NWE method is 16.9965. The SNR increased by 19.21 %, which reflected the superiority of the proposed method.
Table 4Comparison of experimental results
Feature extraction of experimental signal | SNR | |
OMP method | proposed method | |
Matched signal for the first time | 12.8379 | 15.9586 |
Matched signal for the second time | 14.2582 | 16.9965 |
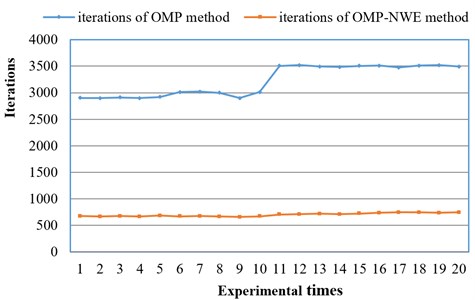
In order to further verify the convergence efficiency of OMP-NWE method, 20 sets of vibration signal of bearing were random independently collected by the experiment table of rotor vibration described in 2.4.2 Engineering verification. The bearing with the unbalance fault was selected in the experiment. The feature signal of unbalance vibration was the sinusoidal signal. So, the sinusoidal components of the vibration signal were extracted using the two methods in this study. The 20 sets of experiments were independent, thus the two different iteration methods were used to extract the feature signal. The iterations of OMP-NWE method and the traditional OMP method were compared.
The results are shown in Fig. 8. It can be obtained that in 20 sets of experiments, the iterations of OMP-NWE method was no more than 1000 times, while that of OMP method was about 3500 times. So, the iterations of proposed method reduced greatly than that of OMP, and the efficiency of OMP-NWE method was significantly improved.
Fig. 8Iterations of 20 experiments
3.2.2. Results of fault diagnosis
To further validate the applicability of OMP-NWE method in mechanical fault diagnosis, the bearing with the unbalance fault is selected in the experiment. The fault was produced by randomly adding the mass unbalance on the inner ring or outer ring of the bearing. The vibration signal of outer ring fault, inner ring fault and normal state were respectively measured, the rotor speed was 1800 rpm/min in the experiment, the sampling frequency was 4096 Hz, a period of sampling points was 136. OMP-NEW method was used in the feature extraction of vibration signals, and the results were shown in Figure 9.
Fig. 9Time-domain graph for bearing fault diagnosis, a) normal bearing; b) unbalance fault of inner ring; c) unbalance fault of outer ring
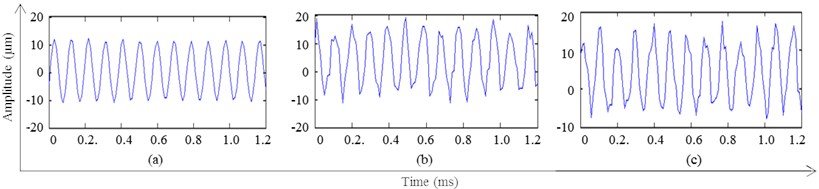
Fig. 9(a) is the time domain waveform of feature signals of the rolling bearing in a normal mode. It is approximately sinusoidal signal, whose frequency is equal to rotational frequency and amplitude is stable. Fig. 9(b) and (c) are the time domain waveforms of the feature signals with inner or outer ring fault. As can be seen that when the rolling bearing is failure, the impact interference signal and normal vibration signal are superimposed, which leads to the fluctuations in the time domain waveform. In addition, the fluctuation in fault signal of outer ring is greater than that of the inner ring. These results are accordance with the actual fault condition, which shows that OMP-NWE method is feasible for the fault diagnosis of mechanical equipment.
For the sake of expressing the fault feature more directly, we defined the concept of periodic energy in this paper. Taking the sampling points of one period of vibration signal as the standard, the vibration signal is intercepted, and then the energy of the interception signal can be calculated. That energy is the so-called periodic energy. Suppose the vibration signal is , the sampling frequency is , the rotation speed of the rotor is .
The periodic energy of vibration signal can be expressed as:
where is the th period and is number of sampling points of one period.
After the sliding average processing, the periodic energy is normalized within the range of 0-1:
Because the normalized periodic energy of different fault signal is in different range, the type of bearing fault can be identified according to the different range more conveniently.
In above experiment, using a period sampling point 136 as the standard, the feature signals of outer ring fault, inner ring fault and normal mode extracted by OMP-NWE method were intercepted into the 50 sections. By Eq. (15), the normalized period energy of signal with inner ring fault, outer ring fault and the normal state all can be calculated. The results with periods as abscissa against the periodic energy of three feature signals as ordinate are shown in Fig. 10.
Fig. 10Normalized periodic energy of rolling bearing vibration signal, a) normal bearing; b) inner ring fault; c) outer ring fault
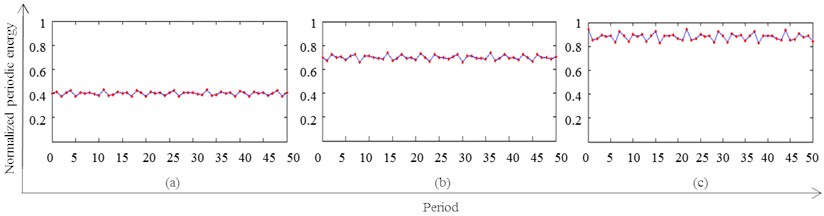
In Fig. 9(a) it can be seen that the normalized periodic energy of the normal rolling bearing is in the range of 0.38-0.43. Because the vibration signal of normal bearings is relatively stable, the periodic energy is relatively stable, and then the variation range of the normalized periodic energy is not large. Fig. 9(b) indicates that the range of the normalized periodic energy of the rolling bearing with the inner ring fault is 0.65-0.75, which is due to the instability of the inner ring fault signal; Fig. 9(c) shows that the normalized periodic energy of the rolling bearing with outer ring fault is in the range of 0.85-0.95, which illustrates that the periodic energy of the outer ring fault signal is maximum, and the fluctuation is more obvious. Therefore, it is proved that the fault diagnosis is feasible according to the range of normalized periodic energy of feature signal, which is extracted by the OMP-NEW method.
For the sake of further verifying the reliability of OMP-NWE method, aiming at rolling bearing unbalance fault, 10 groups of vibration signals of bearing in three states were respectively collected to extract the feature signal using the proposed OMP-NEW method, and then normalized periodic energy was calculated. The results are shown in Table 5.
From Table 5 it can be seen that using the proposed OMP-NWE method to identify the three state of rolling bearings, the accurate rate for diagnosis of normal state and inner ring fault was 100 %, of outer ring faults was 90 %. The only wrong diagnosis result is the 30th group experiment, as the actual fault is out ring unbalance, while the diagnosis result is inner ring fault. The average accuracy rate is 96.7 %, which verify the reliability of OMP-NWE method.
Table 5Identification results of unbalance fault
ID | State | Normalized periodic energy | Diagnosis result | Error rate |
1 | Normal | 0.412 | Normal | 0 % |
2 | 0.425 | |||
3 | 0.395 | |||
4 | 0.415 | |||
5 | 0.405 | |||
6 | 0.418 | |||
7 | 0.398 | |||
8 | 0.394 | |||
9 | 0.408 | |||
10 | 0.385 | |||
11 | Inner ring fault | 0.750 | Inner ring fault | 0 % |
12 | 0.685 | |||
13 | 0.745 | |||
14 | 0.690 | |||
15 | 0.736 | |||
16 | 0.655 | |||
17 | 0.713 | |||
18 | 0.675 | |||
19 | 0.690 | |||
20 | 0.725 | |||
21 | Outer ring fault | 0.915 | Outer ring fault | 10 % |
22 | 0.945 | |||
23 | 0.860 | |||
24 | 0.875 | |||
25 | 0.935 | |||
26 | 0.940 | |||
27 | 0.883 | |||
28 | 0.895 | |||
29 | 0.905 | |||
30 | 0.745 | Inner ring fault |
4. Conclusions
The feature extraction of vibration signal is one of the key problems in the condition monitoring and fault diagnosis of mechanical equipment. A new feature extraction method, OMP-NWE method was proposed in our study. The recursive algorithm was adopted to adaptively adjust the template signal, without any prior knowledge about the signal to know. It is very suitable for the feature extraction of uncertain vibration signal. Simulation and experimental results indicated that OMP-NWE method had a higher accuracy in feature extraction than OMP method. In particular, when the noise and signal frequency band overlap, the feature signal also can be effectively extracted using this method, which has good application prospect in condition monitoring and fault diagnosis of mechanical equipment.
References
-
Vakharia V., Gupta V. K., Kankar P. K. Ball bearing fault diagnosis using supervised and unsupervised machine learning methods. International Journal of Acoustics and Vibration, Vol. 20, Issue 4, 2015, p. 244-250.
-
Kang M., et al. Time-varying and multiresolution envelope analysis and discriminative feature analysis for bearing fault diagnosis. IEEE Transactions on Industrial Electronics, Vol. 62, Issue 12, 2015, p. 7749-7761.
-
Ding X. X., He Q. B. Time-frequency manifold sparse reconstruction: A novel method for bearing fault feature extraction. Mechanical Systems and Signal Processing, Vol. 80, 2016, p. 392-413.
-
Mota J. F. C., et al. Distributed basis pursuit. IEEE Transactions on Signal Processing, Vol. 60, Issue 4, 2012, p. 1942-1956.
-
He Q. B., Ding X. X. Sparse representation based on local time-frequency template matching for bearing transient fault feature extraction. Journal of Sound and Vibration, Vol. 370, 2016, p. 424-443.
-
Cui L., Wang J., Lee S. Matching pursuit of an adaptive impulse dictionary for bearing fault diagnosis. Journal of Sound and Vibration, Vol. 333, Issue 10, 2014, p. 2840-2862.
-
He G., Ding K., Lin H. Fault feature extraction of rolling element bearings using sparse representation. Journal of Sound and Vibration, Vol. 366, 2016, p. 514-527.
-
Pati Y. C., Rezaiifar R., Krishnaprasad P. S. Orthogonal matching pursuit: recursive function approximation with applications to wavelet decomposition. Conference Record of The Twenty-Seventh Asilomar Conference on Signals, Systems and Computers, 1993.
-
Sahoo S. K., Makur A. Signal recovery from random measurements via extended orthogonal matching pursuit. IEEE Transactions on Signal Processing, Vol. 63, Issue 10, 2015, p. 2572-2581.
-
Tropp J. A., Gilbert A. C. Signal recovery from random measurements via orthogonal matching pursuit. IEEE Transactions on Information Theory, Vol. 53, Issue 12, 2007, p. 4655-4666.
-
Schiavazzi D., Doostan A., Iaccarino G. Sparse multiresolution regression for uncertainty propagation. International Journal for Uncertainty Quantification, Vol. 4, Issue 4, 2014, p. 303-331.
-
Li G., Varshney P. K. Micro-doppler parameter estimation via parametric sparse representation and pruned orthogonal matching pursuit. IEEE Journal of Selected Topics in Applied Earth Observations and Remote Sensing, Vol. 7, Issue 12, 2014, p. 4937-4948.
-
Wang H. Q., et al. Compressed sensing of roller bearing fault based on multiple down-sampling strategy. Measurement Science and Technology, 2016, p. 27-2.
-
Gribonval R., Jenatton R., Bach F. Sparse and spurious: dictionary learning with noise and outliers. IEEE Transactions on Information Theory, Vol. 61, Issue 11, 2015, p. 6298-6319.
-
Pham M. Q., et al. A primal-dual proximal algorithm for sparse template-based adaptive filtering: application to seismic multiple removal. IEEE Transactions on Signal Processing, Vol. 62, Issue 16, 2014, p. 4256-4269.
-
Kim D., Haldar J. P. Greedy algorithms for nonnegativity-constrained simultaneous sparse recovery. Signal Processing, Vol. 125, 2016, p. 274-289.
-
Fan H., Meng Q.-F., Wang F.-N. Advances and perspective on nonparametric basis feature extraction based on sparse representation. Application Research of Computers, Vol. 29, Issue 5, 2012, p. 1613-1617.
-
He W. P., et al. Sparsity-based algorithm for detecting faults in rotating machines. Mechanical Systems and Signal Processing, Vol. 72, Issue 73, 2016, p. 46-64.
-
Sattar F., Salomonsson G. Nonparametric waveform estimation using filter banks. IEEE Transactions on Signal Processing, Vol. 44, Issue 2, 1996, p. 239-247.
-
Rajabzadeh Y., Rezaie A. H., Amindavar H. A robust nonparametric framework for reconstruction of stochastic differential equation models. Physica A: Statistical Mechanics and its Applications, Vol. 450, 2016, p. 294-304.
About this article

This research was funded by the Nation Nature Science Foundation of China (No. 61370088).
