Abstract
Resonator is the core component of Solid Vibratory Gyroscope (SVG), its structure and vibration characteristics directly determine the gyro performance. A paraboloid-shaped resonator (PSR) with characteristics of high-overload resistance is proposed and designed. The model of a paraboloid-shaped shell was established by using an energy method. Then the characteristics of natural frequency and vibration modes were analyzed, and effects of structure parameters on natural frequency were obtained by using finite element method (FEM). On this basis, the optimized structural design parameters for specific vibration quality were given and applied to actual machining. Finally, experiments on actual resonator proved that this method is reasonably practicable.
1. Introduction
Solid vibratory gyroscope (SVG) represents an important inertial technology. It utilizes the Coriolis Effect of standing wave in the symmetric shell to sense and measure the angular motion of a rotating body. Not only has all inertial quality, but compared with traditional electromechanical gyro and photoelectric gyro, SVG also has outstanding advantages such as small size, high precision, low cost, long life, simple mechanical structure, good stability during the power outage, large operating temperature range, and resistance to harsh environments. Thus, it has very broad application prospects [1].
Resonator is the core component of SVG, its structure and vibration characteristics directly determine the gyro performance is good or bad. Up to now, various types of structure are used as the sensitive components of SVG, such as ring, cylinder, hemisphere shell, and so on. Foreign research in this area started earlier, Marconi Company Ltd, Innalabs Holding, Delco, Lamine Intrinsic Instrument Manufacturing Design Bureau, etc. already have mature products [2, 3]. Some domestic research institutes such as Beijing University of Aeronautics and Astronautics, National University of Defense Technology, published many papers and developed the gyroscope prototype [4, 5].
However, in high-dynamic environment, most of gyroscopes cannot work properly due to the weak anti-overload capability. The hemispherical resonator gyroscope (HRG) can maintain high accuracy under 100 g overload, and work correctly up to 500 g; Shock resistance around the sensitive axis of working cup-shaped vibratory gyro is up to 7000 g or more. However, above-mentioned gyros will invalid in high dynamic situation more than 10000 g. Therefore, a novel vibratory gyroscope of shock resistance up to 12000 g is proposed and designed creatively, whose resonator is made of paraboloid of revolution shaped constant elastic alloy material.
In this paper, the model of a paraboloid-shaped shell is established by using an energy method. Then the natural frequencies are calculated and vibration modes of the resonator are got using FEM, and the optimized structure parameters are obtained by analyzing the influence of structural parameters on the natural frequencies. Finally, actual PSR is manufactured by machine, and experiments are conducted.
2. Design concept
2.1. The structure of the resonator
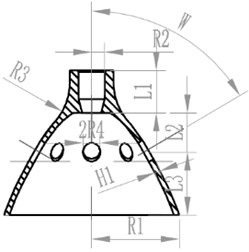
Paraboloid-shaped resonator (PSR) is the core sensitive component of the novel solid vibratory gyroscope, and its schematic sketch is shown in Fig. 1. Eight piezoelectric electrodes are attached in sequence to the surface of the resonator between holes. The vibration characteristics of the resonator directly determine the accuracy of the gyroscope, and structure is the key factor which affects the vibration characteristics. Therefore, it is extremely important to study the effect of structural parameters on the vibration characteristics. The schematic diagram of PSR is shown in Fig. 2. This article will focus on analyzing the impact of changes in the structural parameters on the natural frequencies and mode shapes of the resonator.
Fig. 1Schematic sketch of PSR
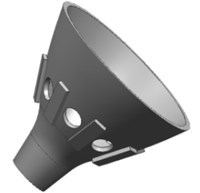
Fig. 2Schematic diagram of PSR
2.2. Working principle of the gyro
Like all SVG, the working principle of the novel vibratory gyroscope is based on the inertia effect of the radial standing wave in resonator edge caused by Coriolis force [6]. When an alternating voltage with the same frequency of the resonator is applied on piezoelectric electrodes A1 and A2, for the converse piezoelectric effect, the driving mode of resonator is excited, shown in Fig. 3(a). From the figure, we can see that resonator works in the four-antinode modal (circumferential wave number is two). Four antinodes and four nodes are alternatively distributed at intervals of 45° angle, and the antinodes connections constitute inherent rigid axis -. When the gyroscope is rotating along the sensitive axis with an angular velocity , the resonator is excited into another inherent rigid axis - by the Coriolis force shown in Fig. 3(b). Due to the piezoelectric effect, four piezoelectric sensing electrodes (B1, B2, D1 and D2) in this axis produce an output signal, which is proportional to the input angular rate and can be obtained by readout circuit.
Fig. 3Working principle schematic of the novel gyroscope
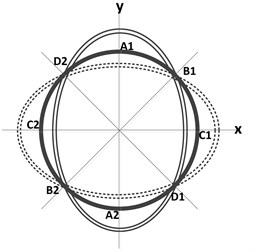
a)
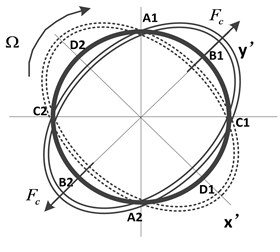
b)
3. Modeling and analysis
For a paraboloid-shaped resonator, modeling based on shell theory is complicated and difficult to solve. Therefore, an energy method is employed to describe the motion of mass [7]. The longitudinal section of PSR and coordinate system including (, , ) are shown in Fig. 4.
The middle surface of PSR is generated by rotating the meridian line around the -axis, which is a parabola , where is the focal distance. The meridional angle () varies in the meridional direction. The thickness () of the resonator remains constant. Then, the resonator can be generated by rotating the longitudinal section one rotation around the -axis (). A typical mass point in the resonator is located by meridional angle , circumferential angle and the distance , which measured from the midsurface along the normal direction (thus ). The ends of the resonator are located by the meridional angles and , as shown in Fig. 4.
Fig. 4Longitudinal section of a PSR
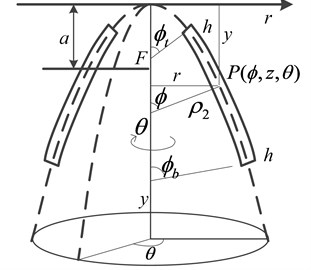
The two principal radii of curvature for the midsurface of the paraboloidal shell are:
where describes the curvature of the midsurface in the meridional (-) plane and is in the normal plane. The latter is the distance in the normal plane from the middle surface to the axis of rotation (), as seen in Fig. 4.
An elastic resonator in free and undamped vibration has potential energy and kinetic energy, which generate from the motion and deformation of shell. Then the energy equations will be derived in terms of stress , stain and displacement as follows.
According to the generalized Hooke’s law, the stress-strain relations of a linearly elastic, isotropic material are as follows:
where is the trace of strain tensor, defined by . and are the Lame’ constants which can be expressed in terms of Young’s modulus and Poisson’s ratio as follows:
The strain-displacement relations are derived by using tensor analysis as follows:
where , , , , are shown in Fig. 4.
For a free, undamped vibration of a shell of revolution, the displacements of mass points are periodic vibration in terms of sine, which can be expressed as:
where is an integer (0, 1, …, ), is the natural frequency and is a phase angle, depending on the initial conditions.
Then the potential energy (strain energy) stored in a shell during linearly elastic deformation can be expressed in terms of the physical components of stress and strain as:
where is the volume of entire resonator. Substituting Eqs. (2)-(5) into Eq. (6), the potential energy may be represented in terms of the physical components of the displacements components.
Similarly, the kinetic energy can be expressed as:
where is mass density per unit volume, and the overdots () represent time derivatives.
Then the solution can be obtained by solving Eqs. (6) and (7).
4. Simulation by FEM
The working premise of the novel SVG is that the resonator resonates and produces an ideal mode of four-antinode. For this purpose, excitation frequency must be controlled accurately, to make it equal to the inherent frequency. This requires us to calculate the structure of PSR, master its characteristics of natural frequencies and vibration modes, in order to ascertain the frequency of excitation circuit.
There are three main methods to calculate natural frequency of the resonator [10]:
1) Establish the mathematical model of PSR based on classical elasticity theory and thin plate bending vibration theory, and then deduce the approximate analytic function of the natural frequency. The frequency solving model of PSR is obtained by derivation and calculation, expressed as follow:
In which, is the inherent frequency, is the material elastic modulus, is the material density, is Poisson’s ratio, is the effective radius, is the thickness of the shell, is vibration mode order, corresponds to the unique value of PSR.
2) Assuming that the system works at undamped vibration without any load, and then deduce the matrix characteristic equation of the natural frequency and mode based on the modal analysis theory and the idea of FEM [11], shown as:
In which, is the stiffness matrix, is the mass matrix, is the modal matrix which reflects the vibration of each mode. Free vibration of the resonator indicates that linear Eq. (9) has non-zero solutions, and therefore:
The solution of Eq. (10) is , which represents the natural frequencies of each mode. The eigenvectors corresponding to the eigenvalues can be expressed as follow:
In which, is called as the th order mode vector, which reflects the vibration shape of that mode. The matrix composed of mode vectors of all order is called modal matrix, written as:
It is an -dimensional matrix, which represents each vibration mode of the resonator.
3) Analyze and calculate the frequency and mode by using the finite element software ANSYS through solid modeling, meshing, modal analysis, and other steps. When using this method, the influencing factors to the natural frequency of the resonator are considered more comprehensive, and the matrixes are more complete, thus the result is closer to the measured value. While above two methods ignore some factors in derivation process, and some of those (such as constraints, etc.) have great influence on the vibration frequency, therefore the results are quite different from the measured values, only as a reference. Consequently, the article mainly uses this method to analyze and calculate.
4.1. Modeling and frequency calculation of PSR
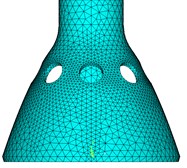
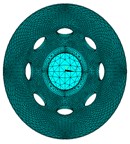
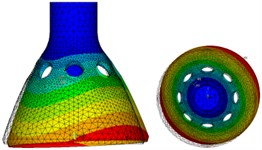
Similar with the actual resonator, the simulation model use constant elastic alloy materials, whose density is 8170 kg/m, elastic modulus is 196.7 GPa, and Poisson’s ratio is 0.3. According to the structure shown in Fig. 2, build the finite element model of PSR by entity form in ANSYS. Model selects the 20-node SOLID186 unit and the finite element model of PSR after free meshing is shown in Fig. 5.
Fig. 5The finite element model of PSR
Select the Block Lanczos mode extraction method for modal analysis of the model, and the 1st-6th order modes are shown from Fig. 6(a) to (f). It can be seen from the figures, the first-order and second-order modes are four-antinode work modes that we need, and their phase angles differ by 45°, respectively correspond to the drive mode and sense mode in Fig. 3. The third-order and fourth-order are six-antinode vibration modes, and the fifth-order and sixth-order are swing vibration modes.
Fig. 6The 1st-6th order modes of PSR obtained by mode analysis
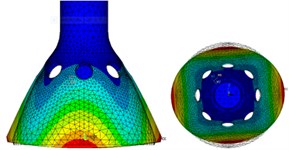
a) First-order mode
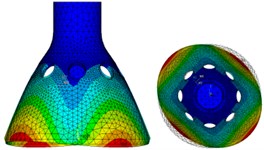
b) Second-order mode
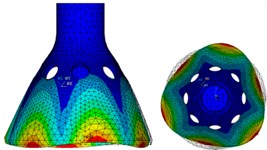
c) Third-order mode
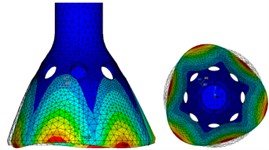
d) Fourth-order mode
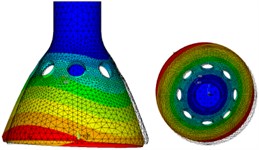
e) Fifth-order mode
f) Sixth-order mode
4.2. Influence analysis of main structural parameters on the natural frequencies
Four-antinode mode is the work mode of PSR, while other modes and deformation (e.g., six-antinode, swing, etc.) are harmful to the vibration gyroscope. In order to avoid the impact of harmful vibration, the natural frequency of 2 mode should be as far away from frequencies of adjacent modes as possible, to ensure the work mode of PSR stable and undisturbed [12].
In the case of the sane material and constraints of PSR, the influencing rule to the natural frequency is investigated by changing the major structural parameters, including PSR thickness , opening radius , top rod length , upper part of PSR length , bottom part length , center mounting hole radius , surface hole radius , etc. shown in Fig. 2. Parameter ranges and the simulation steps are set according to Table 1 in simulation analysis.
Table 1Parameter ranges and the simulation steps
Symbol | Range /mm | Step /mm | Data base /mm |
0.5-1.1 | 0.1 | 0.7 | |
10.2-12.0 | 0.2 | 11.0 | |
4.5-9.0 | 0.5 | 6.0 | |
4.5-9.0 | 0.5 | 6.0 | |
6.0-10.5 | 0.5 | 9.0 | |
1.6-2.4 | 0.1 | 2.0 | |
1.1-2.0 | 0.1 | 1.5 |
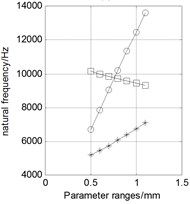
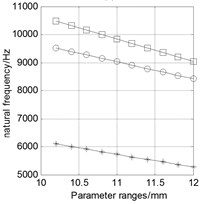
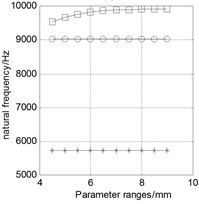
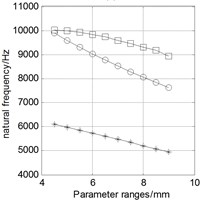
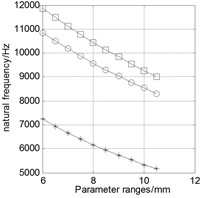
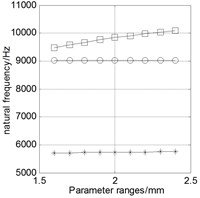
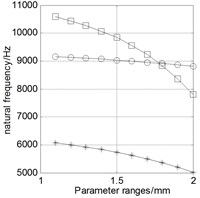
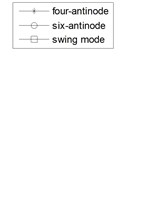
Keep other parameters as data bases in the table above, and only change one variable value within the range to analyze the relationship between this variable and the natural frequency. The analysis results are shown in Fig. 7. Three curves in each figure respectively represent the natural frequency of four-antinode, six-antinode, and swing vibration modes caused by the change of a structural parameter.
Fig. 7Relationship between natural frequencies and structural parameters
a)
b)
c)
d)
e)
f)
g)
Following conclusions can be draw from the simulation results:
1) The resonant frequencies of four-antinode and six-antinode modes increase with the increasing thickness of PSR () obviously, while the frequency of swing mode decreases, and modal transition occurs when 0.8 mm.
2) The natural frequencies of each mode decrease with the increasing opening radius of PSR (R1), and the change of the four-antinode mode is slower than changes of the other two.
3) The effect of top rod length () on the natural frequency of four-antinode is very slightly, and the change is less than 10 Hz.
4) The natural frequencies of each mode decrease with the increasing length of upper part () and bottom part () of PSR.
5) The effect of center mounting hole radius () on the natural frequency of four-antinode is very slightly, and the change is in the range of 50 Hz.
6) The natural frequencies of each mode decrease with the increasing surface hole radius () of PSR, and the change is faster after 1.5 mm, and modal transition occurs when 1.8 mm.
7) The four-antinode modes of PSR are always the first-order and second-order modes, far away from the adjacent modes and will not appear modal transition, while the natural frequencies of the other two modes is very close, and will appear modal transition.
4.3. Structural optimization and parametric design of PSR
Based on above results, in order to ensure the work mode of PSR stability and maintain its natural frequency at about 6 kHz, the recommended structure parameter is: 0.7 mm, 11 mm, 6 mm, 6 mm, 9 mm, 2 mm, 1.5 mm. By modal analysis to PSR of this structural parameter, the natural frequencies of first six order modes are shown in Table 2.
As can be seen from the above table, frequency of four-antinode mode is much less than other modes with a difference greater than 3000 Hz, which is sufficient to ensure PSR work stably at four-antinode mode.
Table 2Natural frequencies of first six order modes of PSR
Modal order | 1 | 2 | 3 | 4 | 5 | 6 |
Natural frequency /Hz | 5729.1 | 5729.7 | 9031.0 | 9031.2 | 9834.4 | 9836.4 |
5. Experiments
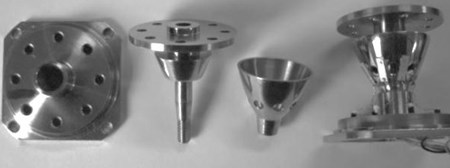
The actual object of PSR designed according to above parameter is shown in Fig. 8. Stick PZT piezoelectric electrodes on the surface of PSR, then fix the whole structure on the mounting base. A PSR is selected for practical experiments, including structural test, frequency response test, and vibration mode test.
Fig. 8PSR and machined metallic structure
5.1. Structural test
In order to verify the machining accuracy of PSR, a Hexagon Metrology CMM (measurement accuracy of 2 μm) is used to measure the main parameters, including the length, thickness, radius, parabolic smoothness, etc. Length, thickness, and radius are easy to process and measure, and the processing errors are around 10-2 mm by measurement, basically meeting the design requirements.
Parabolic smoothness is an important indicator of PSR, and it is difficult to process and measure. Fix PSR at first and measure the internal surface, then invert it to measure the outer surface. Get as many data points and draw the results shown in Fig. 9. The measured parabola is obtained by curve fitting as –0.2465+16.9435, closer to the designed parabola –0.1365+16.9435. The deviation is probably caused by processing error and measurement error.
Fig. 9Measurement of internal and outer surface of PSR
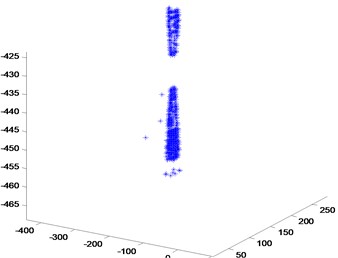
Fig. 10Resonating response of actual PSR
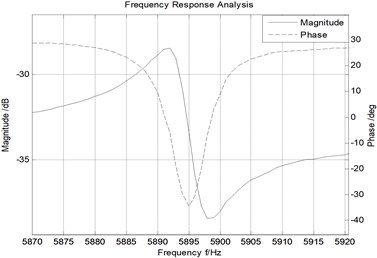
5.2. Frequency response test
A frequency response test is used to get the vibration characteristics of PSR. Use a TD1250C frequency response analyzer to test, and the result is shown in Fig. 10. From the figure we can see the amplitude and phase versus frequency curves, reflecting the vibration characteristics of PSR. Besides, the natural frequency of 5887.1 Hz is measured, slightly greater than the simulation result, probably caused by machining errors, material parameter errors, measurement error, etc.
5.3. Vibration mode test
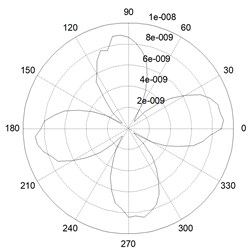
Vibration mode test is used to validate the work mode of PSR. A German Polytec PSV-400 laser vibrometer is used to measure the radial amplitude along the edge of PSR, and the measuring schematic diagram is shown in Fig. 11. Collect the amplitude data at the resonant frequency of 5887.1 Hz and draw the figure of vibration mode distribution shown in Fig. 12. Four antinodes and four nodes can be seen, which certify PSR is working at four-antinode mode, coinciding with the working principle schematic shown in Fig. 3. The test proves that PSR is reasonable feasibility in both principle and practice.
Fig. 11Vibration mode measurement of actual PSR
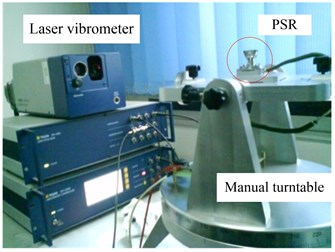
Fig. 12Vibration mode distribution of actual PSR
6. Conclusions
This article presents the modeling, simulation, prototype, and experiment of PSR, provides a theoretical basis for the structural design, and gives a reasonable structural parameter. It is proved that this method is feasible and effective by testing the actual resonator, and can be used to study continue, as well as resonant sensors of other structures.
References
-
Matveev V. A., Basarab M. A., Alekin A. V. Solid State Wave Gyro. National Defense Industry Press, Beijing, China, 2009.
-
Chikovan V. V., Okon I. M., Barabashov A. S. A set of high accuracy low cost metallic resonator CVG. Location and Navigation Symposium, Monterey, USA, 2008, p. 238-243.
-
Lynch D. D. HRG Development at Delco, Litton, and Northrop Grumman. Anniversary Workshop Sponsored by the Academy of Technological Sciences of Ukraine, Yalta, Ukraine, 2008.
-
Ning L., Zhong S., Qing L., et al. Characterization of the bell-shaped vibratory angular rate gyro. Sensors, Vol. 13, Issue 8, 2013, p. 10123-10150.
-
Yi Tao, Xuezhong Wu, Dingbang Xiao, et al. Design, analysis and experiment of a novel ring vibratory gyroscope. Sensors and Actuators A: Physical, Vol. 168, 2011, p. 286-299.
-
Langdon R. M. The vibrating cylinder gyro. Marconi Review, Vol. 45, 1982, p. 231-249.
-
Leissa A. W., Kang J. H. Three-dimensional vibration analysis of paraboloidal shells. JSME International Journal Series C, Vol. 45, Issue 1, 2002, p. 2-7.
-
Kang J. H. Field equations, equations of motion, and energy functionals for thick shells of revolution with arbitrary curvature and variable thickness from a three-dimensional theory. Acta Mechanica, Vol. 188, Issue 1-2, 2007, p. 21-37.
-
Su Z., Fu M., Li Q., et al. Research on bell-shaped vibratory angular rate gyro’s character of resonator. Sensors, Vol. 13, Issue 4, 2013, p. 4724-4741.
-
Sui Xiu-Wu, Xie Wang, Zhang Guo-xiong, et al. Application of finite element analysis in structure design of cylinder shell resonating density meter. Chinese Journal of Scientific Instrument, Vol. 29, Issue 2, 2008, p. 381-386.
-
Fu Zhi-Fang, Hua Hong-Xing Modal Analysis Theory and Application. Shanghai Jiao Tong University Press, Shanghai, 2000.
-
Shen Bo-Cahng, Yi Guo-Xing, Ren Shun-Qqing Finite element analysis on resonator’s characteristics of HRG. Chinese Journal of Inertial Technology, Vol. 12, Issue 6, 2004, p. 56-60.
-
Der Ho Wu, Wen Tung Chien, Chih Jen Yang, Yu Tang Yen Coupled-field analysis of piezoelectric beam actuator using FEM. Sensors and Actuators A: Physical, Vol. 118, 2005, p. 171-176.
-
Fan Shang-Chun, Wang Lu-Da, Guo Zhan-She Design and simulation od novel MEM resonant gyroscope. Chinese Journal of Inertial Technology, Vol. 17, Issue 1, 2009, p. 63-66.
-
Xiang Xi, Yulie Wu, Xiaomei Wu, et al. Investigation on standing wave vibration of the imperfect resonant shell for cylindrical gyro. Sensors and Actuators A: Physical, Vol. 179, 2012, p. 70-77.
About this article
The authors would like to thank the Beijing Key Laboratory of High Dynamic Navigation Technology, University of Beijing Information Science and Technology, China, for equipment access and technical support. This work was supported by National Natural Science Foundation of China (Grant No. 61031001), Beijing Science and Technology Project (Grant No. Z131100005313009), and Beijing Municipal Commission of Education (Grant No. PXM2013_014224_000093).
