Abstract
Site seismic effects are an important factor affecting the design ground motion input. It is well known that for a deep-covered soft-soil site similar to the Shanghai area, the site will exhibit nonlinear characteristics even under relatively small bedrock ground motion input. Therefore, corresponding to different probability levels of ground seismic motion, the seismic effect of the site is also quite different. In the current design codes, the differences in seismic effects are considered by adjusting the maximum value of the design response spectrum and the characteristic period, and the rationality of this adjustment needs further verification. For this reason, the paper takes the standard site model of 280 m cover thickness commonly used in current research as the benchmark, and utilizes the nonlinear time course analysis to study the seismic response characteristics and the variation law of the response spectra of the site under the frequent earthquakes, design earthquakes and rare earthquakes. The results show that: with the increase of the peak value of the input bedrock seismic wave, the amplification coefficient of the surface response wave of the deep-covered soft-soil site decreases gradually; With the increase of the bedrock input, the acceleration amplification coefficient of the deep soil layer increases obviously, which needs to be taken into account when designing the deep underground structure. The long period amplification effect of the case with larger bedrock input (the design earthquake and rare earthquakes) is obvious, and the amplification effect of the acceleration on the surface due to the nonlinearities of the soil is smaller; The current specification adjusts the maximum value and characteristic period of the design response spectrum to achieve the adjustment of different levels of seismic action, which may lead to the underestimation of the long-period response spectrum.
1. Introduction
Seismic wave propagates through the soil layer of the site. Therefore, different site conditions have different amplification or reduction effects on the propagation of seismic wave [1], which will directly affect the damage mode of underground buildings and the distribution of earthquake disaster degree. Wood was one of the first to study the effect of site conditions on seismic waves. He had conducted a detailed survey of the 1906 San Francisco earthquake and found that the degree of damage to buildings varied greatly depending on site conditions. In the 1923 Great Kanto Earthquake in Japan, many scholars also found that the earthquake damage of buildings on soft soil layer was several times more serious than that of buildings on hard soil layer [2].
In recent years, due to the rapid economic development of our country, a large number of high-rise or super-high-rise structures have been built in the eastern coastal areas, and most of these areas are deep-covered soft soil sites with a covering layer thickness of tens or even hundreds of meters [3], so it is necessary to further study and explore the earthquake response of these soft soil sites. In this paper, taking Shanghai as an example, a typical section of Shanghai urban area with a covering layer thickness of 280 meters [4] is used to study the difference of site seismic effects under different levels of ground motion input by using nonlinear time history analysis.
2. Establishment of soft soil site and its nonlinear analysis model
2.1. Soft soil site conditions
In this paper, a typical geological section of Shanghai urban area with a thickness of 280 m designed by Huang Yu et al. [4] is used to analyze the relevant seismic response. The names and physical parameters of each soil layer are shown in Table 1.
Table 1Parameters of typical geological section of deep overburden in Shanghai urban area
Layer type | Roof depth / m | Thickness / m | Unit weight / kN/m3 | Wave velocity / m/s | |
1 | Clay | 0 | 3 | 19.00 | 100 |
2 | Mucky silty clay | 3 | 7 | 17.50 | 130 |
3 | Muckv clay | 10 | 10 | 17.50 | 160 |
4 | Clay | 20 | 5 | 18.20 | 190 |
5 | Clay | 25 | 5 | 20.00 | 260 |
6 | Sand | 30 | 15 | 19.20 | 290 |
7 | Silty clay | 45 | 30 | 19.00 | 320 |
8 | Sand | 75 | 20 | 19.50 | 340 |
9 | Clay | 95 | 15 | 20.00 | 400 |
10 | Sand | 110 | 30 | 20.20 | 420 |
11 | Clay | 140 | 30 | 20.40 | 440 |
12 | Sand | 170 | 60 | 20.60 | 500 |
13 | Clay | 230 | 30 | 20.80 | 510 |
14 | Sand | 260 | 20 | 21.00 | 580 |
15 | Bedrock | 280 | Infinite | 23.90 | 2000 |
2.2. The establishment of nonlinear analysis model
In order to perform and model the nonlinear analysis of the soil layer, it is necessary to obtain the dynamic properties of the soil layer and the intrinsic parameters of the soil. This can be done by means of the M. B. Darendeli formula [5]:
where is the reference shear strain. Then and according to the regression, the nine parameters of the hybrid hyperbolic (HH) model are obtained. The hybrid hyperbolic model is a new one-dimensional stress-strain model proposed by Shi and Asimaki [6], which can be used to obtain the properties (e.g., shear strength) of both small-strain and large-strain soils.
Fig. 1Curves of shear modulus and damping ratio versus strain
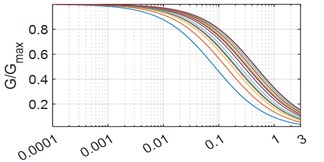
a) Shear modulus curve
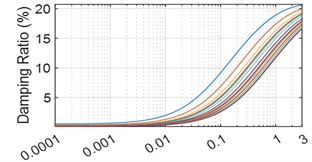
b) Damping ratio curve
Fig. 1 shows the relationship curves of shear modulus and damping ratio with strain for 14 layers of soil in a soft soil site in Shanghai. As can be seen in Fig. 1(a), the values of shear modulus of the soil layers all tend to decrease with the increase of strain. When the soil layer strain is 0.001, the soil layer shear modulus value decreases faster; at a strain of 3, the soil layer shear modulus values all fall below 0.2. As can be seen in Fig. 1(b), the soil layer damping ratio increases with the strain from 0.001, and at a strain of 3, the soil layer damping ratios are all in the 15-20 % interval.
2.3. Bedrock ground motion input
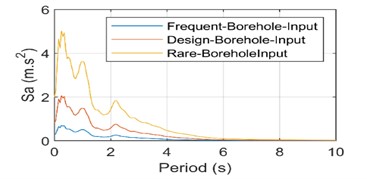
Although the strong earthquake observation network has been established in Shanghai in 1987, the strong motion records with engineering significance have not been obtained so far [7]. Therefore, the bedrock ground motion records required for the study can only be selected from foreign seismic records. According to the similarity of soft soil sites, this paper selects 10 bedrock ground motions of AOMH13 station from Japan’s KiK-Net strong earthquake network as input.
According to the PGA (peak ground acceleration) of surface input of frequent earthquake, design earthquake and rare earthquake used in time history analysis in the Code For Seismic Design Of Buildings [8], the PGAs of bedrock motion for frequent earthquakes, design earthquakes and rare earthquakes are 0.28 m/s2, 0.82 m/s2 and 2.00 m/s2, respectively. The 10 bedrock ground motion inputs are adjusted to three different levels of bedrock ground motion inputs according to the appropriate proportion for subsequent research.
3. Result and discussion
3.1. The stress and strain of soil at different depths under three level earthquakes
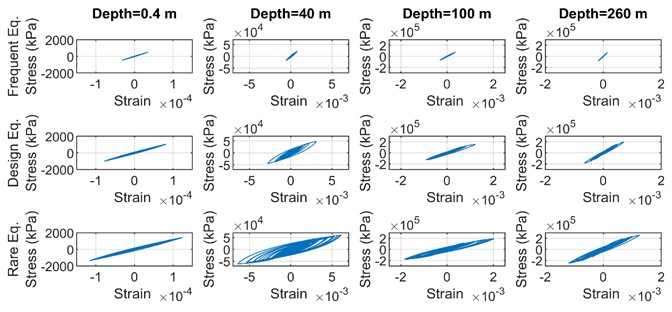
Taking the first seismic record of the above AOMH13 station as an example, the stress-strain time history curves of the simulated Shanghai site at 0.4 m, 40 m, 100 m and 260 m under the action of three different levels of earthquakes are shown in Fig. 2. It can be seen that from top to bottom, with the increase of ground motion input, the stress and strain of the soil layer gradually increases, and the time history curve gradually tends from the initial “linear” to “spindle”, indicating that the soil layer begins to appear nonlinear. In particular, the soil layer at 40 m has the greatest degree of nonlinearity, which may be due to the large stress level under the action of gravity and horizontal earthquake.
Fig. 2The stress-strain diagram of soil layer at different depths under three level earthquakes
3.2. The variation law of site response amplitude and amplification coefficient along the depth
Fig. 3 shows the variation curves of the displacement, velocity, acceleration and amplification coefficient of the Shanghai site along the depth under the earthquake action of three different levels. It can be seen from the figure that the surface displacement, velocity and acceleration responses are the largest under the earthquake action of three different levels. Under frequent earthquakes, designed earthquakes and rare earthquakes, the surface acceleration amplification coefficients are 2.4129, 2.1228 and 1.1778, respectively, it can be seen that the surface acceleration amplification coefficient decreases with the increase of seismic input, which is caused by the increase of soil shear strain level and the decrease of shear modulus. In addition, the curve of acceleration amplification coefficient decreases with the increase of depth in frequent earthquakes and designed earthquakes. In rare earthquakes, the acceleration amplification coefficient of deep soil layer increases obviously and is close to the surface acceleration amplification coefficient. The envelope of velocity and displacement is close to the linear distribution, and with the increase of seismic input, the increasing trend of velocity and displacement of the bottom soil layer is more obvious than that of the soil layer near the surface.
Fig. 3The variation law of site response amplitude and amplification factor along depth
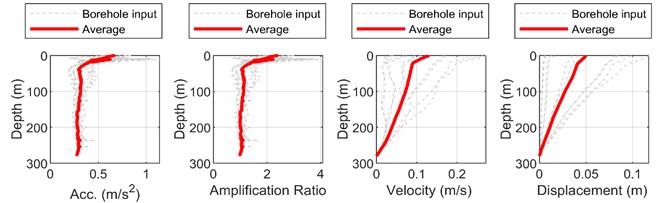
a) Frequent earthquake
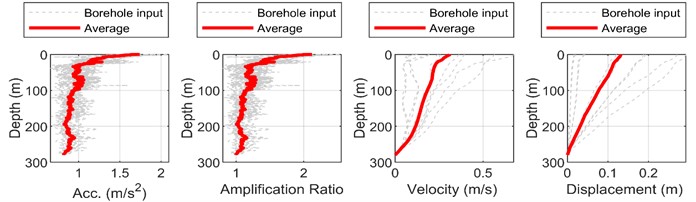
b) Design earthquake
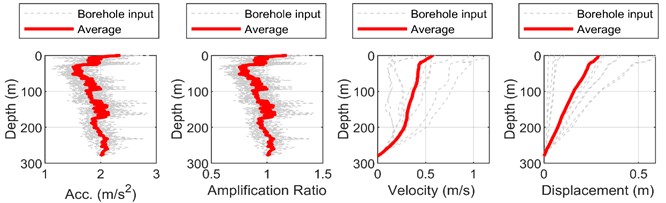
c) Rare earthquake
3.3. The variation law of response spectrum and spectrum ratio along soil depth
From Fig. 4, it can be learned that with the increase of bedrock input, the response spectral value increases significantly in the short period, indicating that the relative contribution of higher-order vibration mode is large after the emergence of soil nonlinearity; normalizing the acceleration response spectra, it can be observed that the Norm Sa value increases with the bedrock input in the short period, and the value decreases in the vicinity of the intrinsic period of the soil body. It can be found that the nonlinear factor of the soil layer leads to the reduction of the acceleration amplification effect, and the contribution of the higher-order vibration mode increases; the spectral ratio increases with the bedrock input, and the spectral ratio shows a shrinking tendency in the short period, and the value starts to increase significantly after 4 s, and the acceleration amplification effect is obvious in the long period; after the standardization of the spectral ratio, it increases with the bedrock input, and the soil body has an obvious amplification effect in the long period (the period is larger than 4 s). The maximum value of the spectral ratio occurs in the middle soil layer of the soil body at a depth of about 100 m.
Fig. 4Changing patterns of reaction spectra and their spectral ratios along the depth of the soil layer
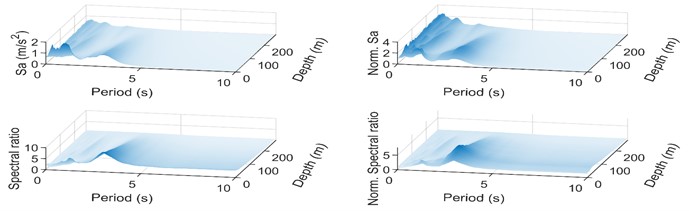
a) Frequent earthquake
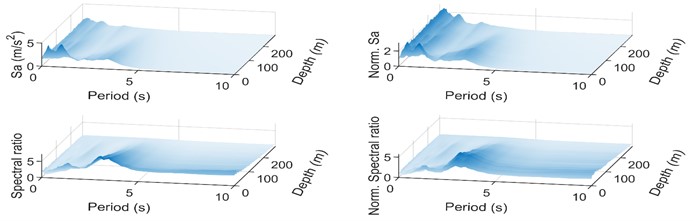
b) Design earthquake
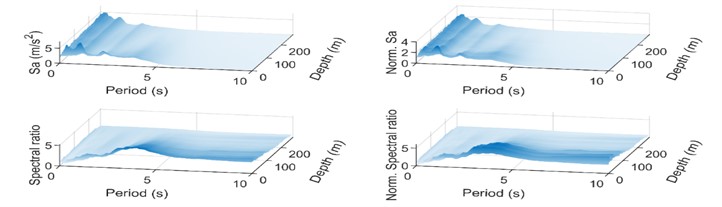
c) Rare earthquake
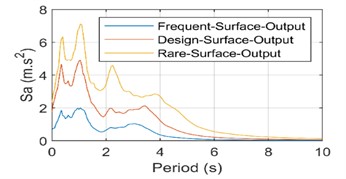
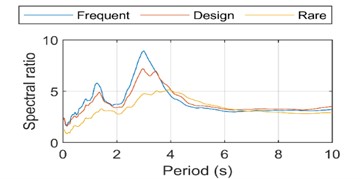
3.4. Surface response spectrum and its spectral ratio
Fig. 5(c) can be observed that the soil in the short period of less than 4 seconds, the spectral ratio with the increase of the input shows a decreasing trend, in the 4s seconds the value is 5; in the long period after 4 seconds, the three kinds of bedrock input case the spectral ratio value is basically equal, about 3. Fig. 5(d) will be normalized spectral ratio, the soil in the first 3 seconds of the three kinds of bedrock input case the normalized spectral ratio value is basically equal. The long period amplification effect of the soil layer with increasing bedrock input is found to be very obvious in the period segment after 3 seconds. Fig. 6 shows the ratio curve between the curves in Fig. 5(b), which can be used to examine the relationship between the adjustments of the design response spectra at different levels.it can be seen that if the adjustment is made according to the current code, there will be underestimation of the response spectra of the long period section for design earthquakes and rare earthquakes, and the underestimation will be more and more obvious with the growth of the period.
Fig. 5Surface response spectra and spectral ratio plots
a) Surface response spectrum
b) Standardized surface response spectra
c) Spectral ratio
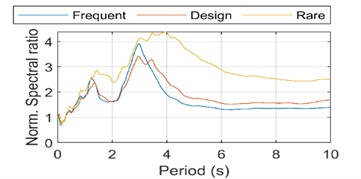
d) Standardized spectral ratios
Fig. 6Ratio curves between each standardized response spectrum curve
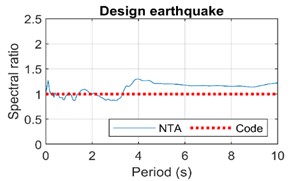
a) Ratio of design to multiple-occurrence seismic spectra
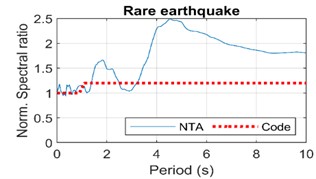
b) Ratio of rare-occurrence to design seismic spectra
4. Conclusions
Using the three parts of the analysis, it can be learned that: the amplification coefficient of the surface response wave of the deep soft soil site decreases gradually with the increase of the peak value of the input bedrock seismic wave at this site. The acceleration amplification coefficient of the deep soil layer increases significantly with increasing bedrock input; At larger bedrock inputs, the soil layer has a very obvious amplification effect in the long period. The normalized spectral ratio values at high inputs are almost twice as high as those at low inputs for the period segments after 3 s. The amplification effect of the surface acceleration is smaller due to the nonlinearity of the soil.
According to the current code, the adjustment of different levels of seismic action is achieved by designing the maximum value of the response spectrum and the characteristic period, which may lead to underestimation of the response spectrum in the long period section, which will be obvious with the growth of the period.
References
-
S. S. Yu et al., “Current situation and prospect of site seismic response analysis,” (in Chinese), Journal of Disaster Prevention and Mitigation Engineering, Vol. 41, No. 1, pp. 181–192, 2021.
-
G. B. Wang and L. D. Yang, “Three-dimensional seismic response analysis of Shanghai soft soil free site,” (in Chinese), Journal of Northwestern Seismological, Vol. 30, No. 4, pp. 326–331, 2008.
-
Y. C. Li, G. B. Zhang, and Q. J. Chen, “Response spectrum analysis of deep cover soft soil site considering design seismic grouping,” (in Chinese), Seismic Engineering and Reinforcement Reconstruction, Vol. 36, No. 5, pp. 132–137, 2014.
-
Y. Huang et al., “Seismic response characteristics of soft soil sites in Shanghai,” (in Chinese), Journal of Underground Space and Engineering, Vol. 1, No. 5, pp. 773–778, 2005.
-
M. B. Darendeli, “Development of a new family of normalized modulus reduction and material damping curves,” Ph.D. Thesis, The University of Texas at Austin, USA, 2001.
-
J. Shi and D. Asimaki, “From stiffness to strength: formulation and validation of a hybrid hyperbolic nonlinear soil model for site‐response analyses,” Bulletin of the Seismological Society of America, Vol. 107, No. 3, pp. 1336–1355, Jun. 2017, https://doi.org/10.1785/0120150287
-
Q. S. Chen, G. Y. Gao, and J. F. He, “Three-dimensional nonlinear seismic response analysis of soft soil site in Shanghai,” (in Chinese), Soil Mechanics, Vol. 32, No. 11, pp. 3461–3467, 2011.
-
“GB 50011-2010. Code for Seismic Design of Buildings,” China Architecture press, Beijing, China, 2016.
About this article

The authors have not disclosed any funding.
The datasets generated during and/or analyzed during the current study are available from the corresponding author on reasonable request.
The authors declare that they have no conflict of interest.
