Abstract
Assessing the nonlinearity of a site plays a crucial role in earthquake engineering. For some building structures and lifeline projects that need safety assessment after earthquakes, the analysis of nonlinear degree of sites can help accurately revealing the amplification effect of sites and evaluating the damage degree of buildings which is convenient for subsequent reinforcement and demolition work. The quantitation of nonlinear threshold of sites is an important method to evaluate the degree of site nonlinearity. In this paper, a nonlinear characteristic index reflecting the degradation of shear modulus is proposed based on the instantaneous frequency of the site calculated by using the vector auto-regression moving average (VARMA) model. Then, seismic records of class Ⅰ, Ⅱ, Ⅲ and Ⅳ sites specified as per code for seismic design of buildings in China are selected from the KiK-net network in Japan, and the threshold value of ground motion acceleration characterizing the nonlinear response of sites are provided. Finally, the variation of the nonlinear characteristic index (shear modulus degradation) vs. different (peak ground acceleration) PGA for four types of sites are presented.
1. Introduction
In recent years, as countries around the world continue to strengthen the construction of strong motion observation networks, more and more high-quality strong motion records have been obtained. These strong motion records provide strong support for site nonlinear seismic response analysis.
Beresnev et al. [1] conducted a modeling analysis based on the 1994 Northridge earthquake in the United States by using the random finite-fault method, and obtained the nonlinear situation of site response by comparing the site simulation results with the actual results. pavlenko et al. [2] first proposed a time-varying shear modulus estimation method to identify the nonlinear behavior of soils. Bonilla et al. [3] used the strong motion records of the KiK-net network to obtain the results of site shear wave velocity and predominant frequency changes through correlation and autocorrelation methods, and effectively identified the nonlinear characteristics of the site. Although the above scholars have carried out a lot of research on the nonlinear characteristics of the site, there is still no clear index for the degree of the site nonlinearity, and the research on the nonlinear threshold of the site is also rare. Based on the strong earthquake records of KiK-net network and the instantaneous frequency of the site calculated by VARMA model, this paper proposes the identification index of the nonlinear characteristics of the site, and gives the nonlinear threshold of the four types of sites and the nonlinear degree of the four types of sites under different PGA value intervals.
2. Instantaneous frequency and nonlinear characteristic index of the site
2.1. Identify the instantaneous frequency of the site through the VARMA model
In this paper, the instantaneous frequency of the site is obtained by VARMA model, and the nonlinear index of the site is proposed. Compared with short-time Fourier transform and wavelet transform, VARMA model can process non-stationary signals and suppress the interference of noise, so as to obtain more accurate frequency analysis results. It decomposes the acceleration records into several inherent modal parameters function (IMF) by empirical mode decomposition (EMD), and represents all IMF as VARMA models [4]. In the VARMA model, the corresponding relationship between the input and output of the structure can be represented by the following time-varying VARMA model [5]:
where consists of the IMFs, i.e., and is the th IMF. The autoregressive coefficients and the moving average coefficients are matrices. The vector is an -dimensional zero-mean Gaussian white noise process with covariance matrix, , is the identity matrix, and . The variable means the time instant , with as the sampling interval of the structure.
Convert the VARMA model of the formula into the corresponding state-space model as follows:
where, is the state vector; is Gaussian process noise; is the observation vector. Parameter can be estimated according to Kalman filtering method.
In this paper, VARMA(2, 2) model is used according to previous research [5]. For ground motion signals, the time-varying VARMA model can be used to model and analyze the input and output of the system, and then the instantaneous frequency of the system can be calculated based on the parameters of the model.
2.2. Nonlinear characteristic index of the site
The degree of nonlinearity of a site is usually assessed by comparing the shear modulus of the material (or fundamental frequency) and the reference amount calculated after strong motion. The reference amount is calculated based on the small strain shear modulus or weak motion.
The fundamental frequency of soil sediments can be expressed as:
where is the thickness of the soil layer and is the shear wave velocity. The soil shear modulus is expressed as:
For the soil nonlinearity under the condition of strong motions, shear modulus is:
For the soil nonlinearity under the condition of weak motions, shear modulus is:
Therefore, by comparing the shear modulus under strong motion and weak motion, the shear modulus reduction ratio can be estimated, that is, the nonlinear index proposed in this paper. The formula is as follows:
For the method of identifying site instantaneous frequency based on VARMA model, is the site instantaneous frequency calculated by weighted average of the strong seismic segment, and is the weighted average of the initial segment of the acceleration record.
3. Site nonlinear feature identification
3.1. The variation law of site nonlinear index under different PGA
The seismic records were selected from KiK-net in accordance with the four site categories I, II, III and IV as per Code for Seismic Design of Buildings in China (GB 50011-2010) with PGA greater than 0.15 m/s². For ground motions with small PGAs, they are very likely to be influenced by environment noise. For Class I site, 90 stations were selected, with a total of 9714 seismic records. For Class II site, 369 stations were selected, with a total of 30924 records. For Class III site, 34 stations were selected, with a total of 8214 seismic records. Class IV site selected 10 stations with a total of 3000 records.
The nonlinear characteristic index is calculated for the seismic record table selected for the four types of sites I, II, III and IV, and the scatter plot is fitted. The fitting formula is as follows:
where is the fitting parameter.
The relationship between nonlinear characteristic index and PGA of site I, II, III and IV is shown in Fig. 1, and the fitting parameters are 2.612×10⁻³, 3.776×10⁻³, 5.930×10⁻³ and 6.775×10⁻³ respectively.
It can be seen from the Fig. 1 that the nonlinear characteristic index of the four types of sites decreases with the increase of the value of PGA. From the fitting parameter of the nonlinear characteristic index of the four types of sites, it can be seen the fitting curve decline rate of the class Ⅳ sites is the largest, followed by the class Ⅲ and Ⅱ sites, and the class Ⅰ sites have the slowest decline rate. This is because the response mechanism of the hard site in earthquake is quite different from that of the soft soil site. The soft soil site has low stiffness, and seismic waves are easy to cause friction and deformation among soil particles, which leads to the nonlinear response of the site, and then reflects the decline rate of the nonlinear index degradation curve of the site.
3.2. The threshold of surface acceleration corresponding to the nonlinear characteristics of the site
An important method to evaluate the nonlinear behavior of the site is to study the nonlinear threshold of the site. Taking the MYGH04 station in kik-net network as an example, two seismic events are obtained, which are the seismic event “1211220242” (PGA = 0.49 m/s2); Seismic event “1103121519” (PGA = 0.70 m/s2). The 0-30s stress-strain time history curve at 2 m of the site can be obtained from the model calculation, as shown in Fig. 2 and Fig. 3. It can be seen from the figure that when PGA = 0,70 m/s2, the stress-strain time-history diagram begins to appear obvious “spindle type”, indicating that the soil layer is in non-linear. Further, each moment in the stress-strain time history curve of the seismic event “1103121519” was derived, and the shear modulus of each moment was obtained after smoothing, as shown in Fig. 4, where is the initial shear modulus of the site.
Fig. 1The relationship between nonlinear index of four types of sites and PGA
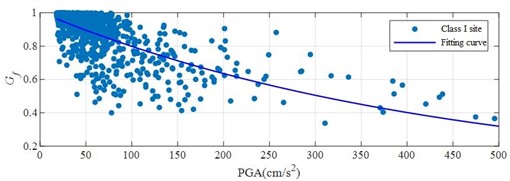
a) The relationship between nonlinear index of I site and PGA
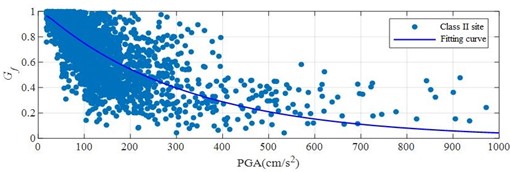
b) The relationship between nonlinear index of II site and PGA
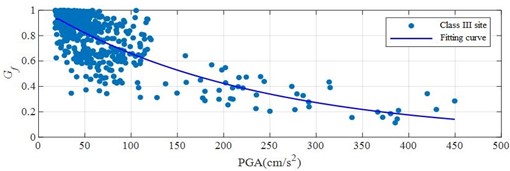
c) The relationship between nonlinear index of III site and PGA
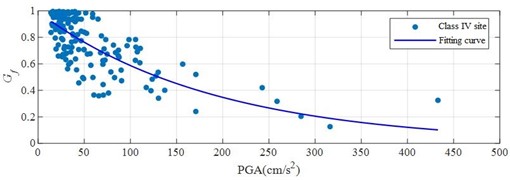
d) The relationship between nonlinear index of IV site and PGA
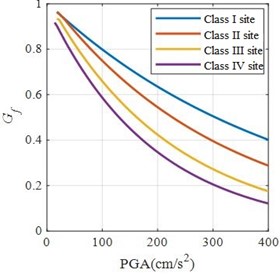
It can be seen from the shear modulus time history curve that when the soil layer is obviously non-linear, the shear modulus drops to 0.85. Therefore, when is equal to 0.85, it is taken as the threshold between the nonlinear and linear of the site. The fitting curve between the nonlinear characteristic index and PGA of the four types of sites in the previous section is drawn in the same diagram, as shown in Fig. 5, The PGA value corresponding to the fitting curve where equals 0.85 is taken as the acceleration threshold, in which the nonlinear threshold of class I site is 0.73 m/s2, the nonlinear threshold of class II site is 0.60 m/s2, the nonlinear threshold of class III site is 0.43 m/s2, and the nonlinear threshold of class IV site is 0.30 m/s2.
Fig. 2Seismic event “1211220242”, site 0-30 s stress-strain diagram
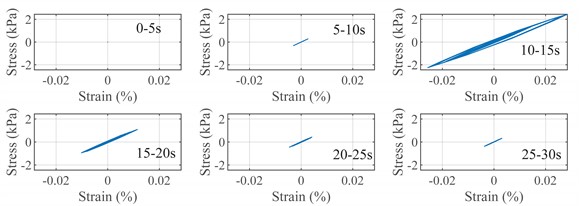
Fig. 3Seismic event “1103121519”, site 0-30 s stress-strain diagram
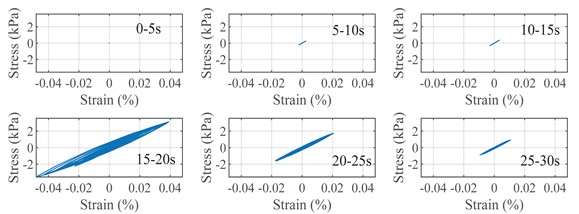
Fig. 4MYGH04 station, Seismic event “110312151 9”, shear modulus time-history diagram
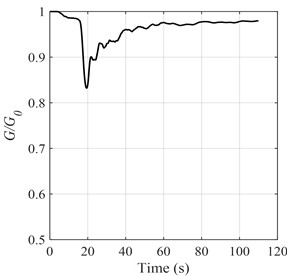
Fig. 5Nonlinear index fitting curves of I, II, III and IV sites
3.3. Nonlinear degree of four types of sites under different PGA
Assessing the degree of nonlinearity of the site is a very important part of earthquake engineering, because the nonlinear characteristics of the site will affect the propagation of the seismic wave when the seismic wave passes through the underground soil layer, and thus affect the damage degree of the seismic wave to the structure. By analyzing the nonlinear degree of the site, the filtering or amplifying effect of seismic waves on the sites can be given more accurately, and then the damage degree of the building in the earthquake can be evaluated more reasonably, and the corresponding anti-seismic measures can be taken. For example, when the PGA value range is 1.0-1.5 m/s2, the degree of nonlinearity is the average value of in the range of 1.0 m/s2 and 1.5 m/s2 in the fitting curve. The degree of nonlinearity of Class I, II, III and IV sites is shown in Table 1. It can be seen that Class I, II, III and IV sites all have higher nonlinear degree with the increase of PGA. In the same PGA range, Class IV sites have the highest nonlinear degree, followed by Class III and II sites, and Class I sites have the least nonlinear degree.
Table 1The degree of nonlinearity of I, II, III and IV sites
Site category | PGA value range (m/s2) | |||||
≤ 0.5 | 0.5-1.0 | 1.0-1.5 | 1.5-2.0 | 2.0-3.0 | ≥ 3.0 | |
I | 0.97 | 0.85 | 0.76 | 0.68 | 0.58 | 0.46 |
II | 0.94 | 0.82 | 0.70 | 0.60 | 0.48 | 0.37 |
III | 0.89 | 0.76 | 0.61 | 0.49 | 0.36 | 0.24 |
IV | 0.85 | 0.69 | 0.54 | 0.41 | 0.30 | 0.19 |
4. Conclusions
In this paper, based on the strong motion records of KiK-net network in Japan, the nonlinear feature characteristic is proposed to reflect the shear modulus degradation through the instantaneous frequency method calculated by VARMA model, and identifies the nonlinear characteristic of the site based on the nonlinear characteristic index . Firstly, the variation law of the nonlinear characteristic index on PGA of four types of sites are obtained. Then, according to the fitting curve of the nonlinear characteristic index and PGA, the nonlinear threshold of four types of sites is further determined. Finally, the nonlinear degree table under different PGA value intervals of class I, II, III and IV sites is given. The results of this paper quantify the nonlinear characteristics of the site, and provide a valuable reference for the study of nonlinear threshold and nonlinear degree analysis in engineering earthquakes.
References
-
I. A. Beresnev and G. M. Atkinson, “Stochastic finite-fault modeling of ground motions from the 1994 Northridge, California, earthquake. I. Validation on rock sites,” Bulletin of the Seismological Society of America, Vol. 88, No. 6, pp. 1392–1401, Dec. 1998, https://doi.org/10.1785/bssa0880061392
-
O. V. Pavlenko, K. Irikura, “Estimation of nonlinear time-dependent soil behavior in strong ground motion based on vertical array data,” Pure and Applied Geophysics, Vol. 160, No. 12, pp. 65–79, 2003.
-
L. Bonilla, P. Gueguen, and C. Gelis, “Contribution of K-NET and KiK-net data to the monitoring of nonlinear properties of the shallow crust,” in The 6th IASPEI / IAEE International Symposium: Effects of Surface Geology on Seismic Motion, pp. 172–177, 2021.
-
Y. M. Li, Y. F. Dong, and M. Lai, “Signal processing method based on EMD and VARMA models,” (in Chinese), Vibration and Shock, Vol. 29, No. 12, pp. 141–147, 2007.
-
Y. F. Dong, “The improvement of non-stationary signal processing method and its application in seismic engineering,” (in Chinese), Chongqing University, 2010.
-
L. J. Wei, “Identification of site nonlinear characteristics and adjustment of ground motion parameters based on strong motion records,” (in Chinese), Chongqing University, 2010.
-
Y. F. Dong, Z. X. Ma, and S. Chen, “Identification of site liquefaction based on surface and underground strong vibration acceleration records,” (in Chinese), Journal of Building Structure, Vol. 37, pp. 362–365, 2016.
-
GB 50011-2010. Code for Seismic Design of Buildings. Beijing, China: China Architecture Press, 2010.
About this article

The authors have not disclosed any funding.
The datasets generated during and/or analyzed during the current study are available from the corresponding author on reasonable request.
The authors declare that they have no conflict of interest.
