Abstract
In order to improve the data monitoring and information management capabilities of membrane gas measure device indirect metering terminals, a sensor network based data monitoring method for membrane gas measure device indirect metering terminals was proposed. The distributed and centralized sensor network node deployment method is used to achieve data collection for membrane gas measure device indirect metering terminals, and the collected membrane gas measure device indirect metering terminal data is segmented, fused, and reorganized. The distributed energy storage and constant volume two-level optimal control method is used to analyze the operation status of gas measure device indirect metering terminal data. The ZigBee networking protocol is used to build a network structure model for gas measure device indirect metering terminals, an integrated high-precision temperature and pressure sensor arranged parallel to the inner wall of the valve body is used to detect the temperature and pressure at the outlet of the membrane gas measure device. The temperature information is stored in DSP, and the user's expenses, system operation and maintenance, and peak shaving and valley filling benefits are taken as the parameters of the energy storage and constant volume outer layer model. The output stability of the indirect metering terminal data of the membrane gas measure device is analyzed in the high switching frequency mode. Combined with adaptive parameter adjustment, the indirect metering terminal control and data dynamic collection of the membrane gas measure device are realized. Realize dynamic monitoring of metering terminal data in wireless sensor network networking control mode. The test results show that using this method for indirect metering terminal data monitoring of gas measure devices has good output stability, strong dynamic fusion of sensing information, reduced metering errors, and improved metering accuracy of gas measure devices.
Highlights
- The distributed and centralized sensor network node deployment method is used to realize the data acquisition of the indirect metering terminal of the membrane gas metering device, and the collected data of the indirect metering terminal of the membrane gas metering device is segmented, fused and reassembled.
- The data running status of indirect metering terminal of gas metering device is analyzed by using distributed energy storage two-stage optimal control method with constant volume.
- ZigBee network protocol was used to establish the network structure model of the indirect metering terminal of the gas metering device. Integrated high-precision temperature and pressure sensors parallel to the inner wall of the valve body were used to detect the temperature and pressure at the outlet of the film gas metering device.
1. Introduction
With the development of automation control and intelligent instrument technology, using digital instruments to measure natural gas measure devices has become the main method for the development of gas measure devices in the future. Compared to traditional mechanical meters, using digital acquisition and information processing technology, a large number of membrane gas measure device gas measurement results are digitally processed. Through wireless sensor network control, remote control of gas terminals is achieved, reducing the probability of gas leakage and explosion. Adopt indirect gas measure device and methods to achieve high reliability and low cost management of gas measure devices [1]. The monitoring and management of gas measure devices mainly includes measurement digitization, intelligent safety valves, remote control, and other aspects. In combination with the design of automatic shut-off valves and wireless meter reading systems, realize the informatization reform of gas measure devices and ensure the safety of gas use [2].
In the design of indirect metering terminal data monitoring for membrane gas measure devices, ZigBee wireless communication technology and digital image recognition technology are currently mainly used. Omega gas flow meters and pressure detection devices are installed at the gas outlet of membrane gas measure devices. High accuracy gas measure device and leakage monitoring are realized through counting the rotation number of the core gear of the gas measure device [3]. Reference [4] provides a domestic liquefied gas leakage alarm and an automatic gas source cutoff device, including a gas leakage alarm component and an automatic gas source cutoff component. This method only has the detection function for overcurrent or leakage. Reference [5] uses a wirelessly controlled domestic gas safety valve and a timed self closing valve to replace natural gas with an air compressor airflow, and the measured results belong to a relatively ideal environment. In Reference [6], using the C-250 membrane gas measure device from the American Meter Company to build an intelligent meter reading scheme, a CMOS camera is set up to capture the measurement results of the gas measure device. This method sends the measurement data to the aggregation node, and then monitors the rotation of the gear through a Hall sensor. This method also has the problem of poor measurement accuracy. Aiming at the above problems, this paper proposes a data monitoring method for indirect metering terminals of membrane gas measure devices based on sensor networks. Firstly, distributed and centralized sensor network node deployment methods are used to achieve data collection for membrane gas measure device indirect metering terminals, and the collected membrane gas measure device indirect metering terminal data are segmented, fused, and reorganized. Then, the distributed energy storage and constant volume two-level optimal control method is used to analyze the operation status of gas measure device indirect metering terminal data, and the ZigBee networking protocol is used to build a network structure model for gas measure device indirect metering terminals, Taking the user's expenses, system operation and maintenance, and peak shaving and valley filling benefits as the parameters of the energy storage constant volume outer layer model, combined with adaptive parameter adjustment, the indirect metering terminal control and dynamic data acquisition of membrane gas measure devices are realized, and the dynamic monitoring of metering terminal data is realized under the wireless sensor network networking control mode. Finally, a simulation test is conducted to demonstrate the superior performance of the method in this paper in improving the data monitoring ability of the indirect metering terminal of the membrane gas measure device.
2. Wireless network sensor network structure and data acquisition for terminal data monitoring
2.1. Network structure model
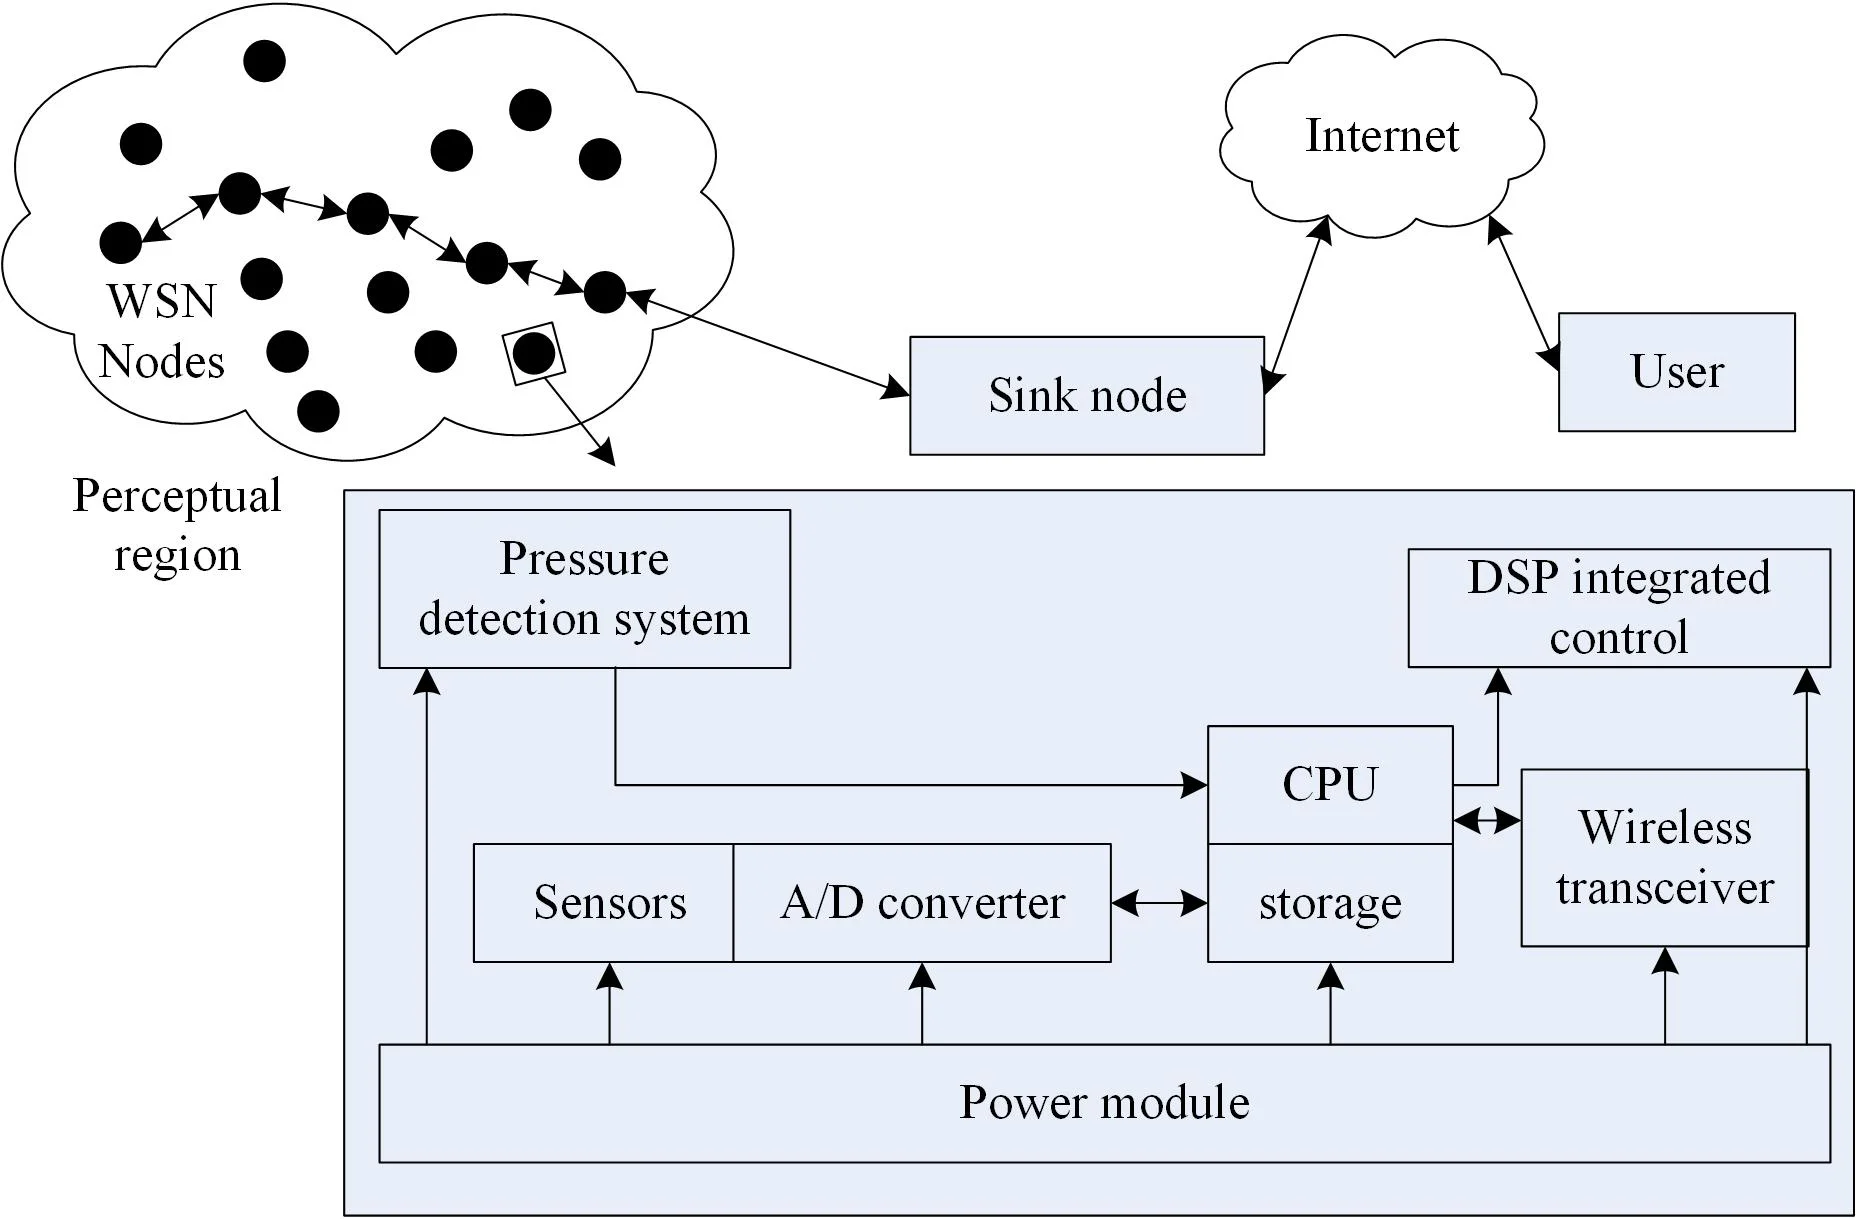
Diaphragm gas metering device records gas flow through continuous reciprocating motion of diaphragm, connecting rod mechanism and rotary valve. Based on the extraction of the gas measure device outlet pressure signal waveform [7], a distributed and centralized sensor network node deployment method is used to construct a wireless sensor network model. Through the output anti-interference design of distributed data, and the weak signal cycle extraction method based on STH-AMDF, realize anti-interference adjustment of the wireless sensor network distributed high-speed data acquisition system. According to the above system design description, the overall design architecture of the wireless sensor network for indirect metering terminal data monitoring of membrane gas measure devices is shown in Fig. 1.
According to the overall design architecture model of the wireless sensor network distributed data acquisition system for the membrane type gas measure device indirect metering terminal shown in Fig. 1, a packet fusion and information processing model for the wireless sensor network distributed data acquisition system is established by using the method of block combination control and DSP integrated information processing for a short time operation process under a certain fire state, and achieving flow rate measurement through signal amplification. The networking structure model of the wireless sensor network distributed data acquisition system for the membrane gas measure device indirect metering terminal is obtained, as shown in Fig. 2.
Fig. 1Analysis of the overall design architecture of the system
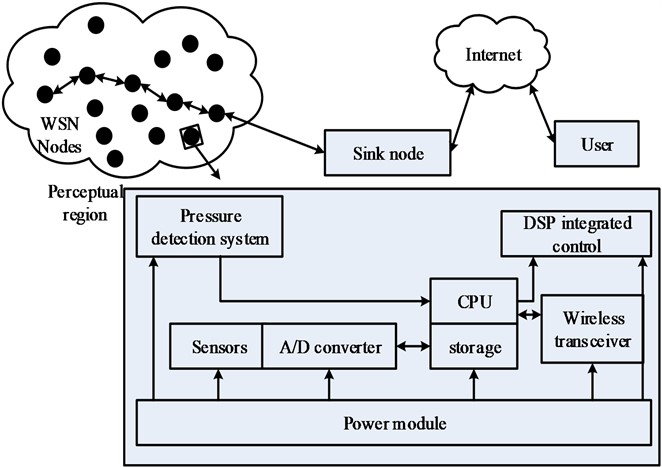
Fig. 2Wireless sensor network for indirect metering terminal of membrane gas measure device
On the basis of measuring the temperature of the gas medium and the pressure of the gas pipeline, the baseline drift noise removal method is used for long-term gas measure device testing at a fixed flow rate [8]. The membrane type gas measure device is mainly composed of three main parts: the meter body, the digital dial of the meter, and the inlet and outlet ports. It is divided into two small metering chambers through elastic membrane sheets, and is composed of rotating valves, connecting levers, and other mechanisms to obtain the output active power:
wherein, refers to the cyclic alternation of inlet and outlet, refers to the periodic boost power fundamental frequency, refers to the periodic value of the pressure signal at the outlet of the membrane gas measure device, and refers to the gas state parameter. The measurement error of natural gas volume is calculated by collecting the absolute pressure of the gas in two states, and for a fixed mass of gas, its volume is proportional to its temperature [9].
2.2. Indirect metering terminal data acquisition for membrane gas measure devices
Compression factor is an important parameter to describe gas state characteristics, establish a stability control model for the indirect metering terminal data of membrane gas measure devices, analyze the volume in the metering state and the volume in the standard state based on the correlation feature distribution of the indirect metering terminal data of membrane gas measure devices, analyze the high calorific value and relative density of the indirect metering terminal of membrane gas measure devices, and analyze the reference model for resistance characteristics [10]. The calculated volume of natural gas under standard conditions is expressed as:
wherein, is the gas temperature and pressure correction parameter for gas measure device. Combined with the analysis of the gas outlet pressure parameter of the membrane gas measure device, the pulse signal of the indirect metering terminal data state of the membrane gas measure device is obtained as follows:
wherein, is the filtering window, is the signal gradually approaching at the low frequency layer, and the extracted pipeline network pressure fluctuation characteristic line segment is used to construct a detection statistical analysis model for the sample data of the indirect metering terminal of the membrane gas measure device. , , combined with the periodic signal component characteristic points in the membrane gas measure device outlet pressure signal, uses the time domain feature analysis method to extract the membrane gas measure device outlet pressure signal after baseline drift noise, expressed as:
In the above formula, is the indirect metering data of the membrane gas metering device adaptively adjusts the gas flow rate, is outlet pressure measured by gas metering device, and is membrane gas metering device outlet pressure difference. Using damping parameter analysis, the optimization control of automatic data acquisition at IMT-MGMD is performed. Usually, when a user fires, he or she will press the firepower knob down to increase the gas output of the gas cooker. The steady-state working point of the meter is obtained as follows:
wherein, and respectively switch on and off the fire and detect the fire conversion. By the above analysis, a data adaptive control model for the indirect metering terminal of the membrane gas measure device is established [11]. After adjusting the switching frequency, the characteristic equation for the data monitoring stability of the indirect metering terminal of the membrane gas measure device is obtained as follows:
where, , , , , are the distributed joint control parameter of the indirect metering terminal data of the membrane gas measure device; , are the proportional coefficient and differential coefficient of the data parameter fusion of the indirect metering terminal of the membrane gas measure device. , , are monitoring coefficient of indirect metering terminal data of membrane gas metering device. The interval coupling branch output impedance of the indirect metering terminal data of the membrane gas measure device are , , , and the active and reactive power coordination scheduling method is used to detect the firing status through the heat source type flow rate detection module. The peak of the indirect metering terminal data distribution of the membrane gas measure device is obtained as follows:
wherein, refers to the filtering window width, refers to the high-frequency layer and the low-frequency layer, and refers to the baseline drift noise, refers to the drift noise, refers to damping parameter, refers to membrane gas measuring device outlet pressure signal, refers to pressure periodic signal collected by wireless sensor network. The reference value is compared with the original signal starting from the signal starting point. The distributed energy storage and constant volume two-level optimization control method is used to achieve the operation status analysis of the indirect metering terminal data of the gas measure device. The ZigBee networking protocol is used to construct the network structure model of the indirect metering terminal of the gas measure device [12].
3. Indirect metering terminal data monitoring for membrane gas measure devices
3.1. Stability analysis of data output from indirect metering terminal of membrane gas measure device
Build a reference sequence REF composition model for each stage, analyze the periodic value of the pressure signal at the outlet of the membrane gas measure device, and obtain the pressure periodic signal waveform model collected by the wireless sensor network as follows:
wherein, represents the peak position in the AMDF sequence, represents air port pressure period, and represents the AMDF spectrum of the periodic signal of the air port pressure; represents the signal strength of distributed data high-speed acquisition at the same time. An integrated high-precision temperature and pressure sensor arranged parallel to the inner wall of the valve body is used to detect the temperature and pressure at the outlet of the membrane gas measure device. The temperature information is stored in DSP as an important parameter for gas volume temperature and pressure correction, and the pressure information is used as a pending signal for weak signal periodic detection. The energy parameters to the outlet are:
wherein represents the energy consumption of distributed data high-speed acquisition output bit data packets; represents the energy parameter of the gas signal. The read in gas signal can be segmented by the time identifier of the fire conversion point, and a dynamic optimization model of the sensor network node is constructed. The output correlation parameter after data collection is obtained as follows:
wherein, is the time identification parameter of the fire conversion point, and represents the gas temperature and pipeline static pressure for gas volume temperature and pressure. During the time period , when the shutdown state is identified, the gas volume temperature and pressure correction data acquisition structure is performed based on the gas temperature and pipeline static pressure, and the autocorrelation matching set for metering terminal scheduling is obtained as follows:
The read gas signal can be segmented by the time identification of the fire conversion point. With the minimum energy consumption output as the constraint parameter, and the maximum transmit power as the constraint parameter, the weak signal cycle detection and consumption calculation can be achieved, and the feature distribution set is obtained. For any point , the adaptive parameter identification method is used to obtain the output time delay of data acquisition, which is recorded as:
wherein, represents the arrival time of data packets collected from the main body section, control section, sensor bracket, screw, screw sleeve, sealing piston, etc. For the wireless sensor network distributed data acquisition node Sink, the ambiguity probability density of the membrane gas measure device indirect metering terminal data acquisition node is obtained as follows:
wherein, represents the probability of error in estimating distributed data parameters for wireless sensor networks, and the obtained sample bandwidth distribution time length for data collection is t. The vector represents the modulation vector for distributed data collection for wireless sensor networks. Based on the above analysis, the user’s expenses, system operation and maintenance, and peak shaving and valley filling benefits are used as the parameters of the outer layer model for energy storage and capacity determination. Analyze the output stability of the indirect metering terminal data of the membrane gas measure device in the high switching frequency mode. Combined with adaptive parameter adjustment, non probe type and parallel arrangement are adopted. The sensor arrangement is within the main section to achieve monitoring of the metering data of the gas measure device. The implementation structure diagram is shown in Fig. 3.
Fig. 3Structure diagram of gas measure device metering data monitoring implementation rack
3.2. Hardware experiment and experimental test
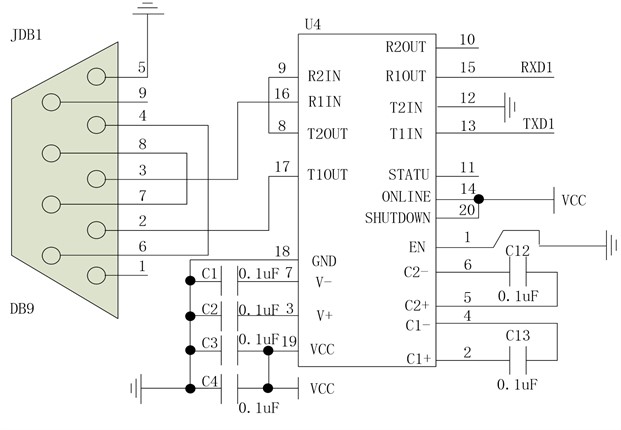
Based on the above algorithms for establishing data acquisition and information processing, the hardware design of the gas measure device metering terminal data monitoring system is implemented in an ARM embedded microprocessor and integrated DSP. The system uses the JTAG standard 14-pin interface. When using the JTAG simulator at a distance of more than 15 cm, to ensure the transmission needs of the simulated signal, buffers should be added to the signal lines TDI, TDO, TMS, and TCK, and TMS, TDI Apply a pull resistor to the EMU0 and EMU1 terminals and connect them to the power supply. Due to the system’s choice of a non buffered design, the connecting line between the JTAG interface and the PC parallel port should in principle not be greater than 15 cm in use. The embedded development of a distributed data acquisition system for wireless sensor networks is carried out in the ARM Cortex-M3 core. The bus interface software is used as the underlying data device for I/O control. When used, an external reference voltage of 2.048 (V) is required. The system uses the I2C communication protocol to read the DPS310 sensor and uses the UART communication protocol to upload gas consumption, temperature, and pressure information to the gas information management terminal. Establish the AD module of the wireless sensor network distributed data acquisition system. The hardware circuit design of the AD module is shown in Fig. 4.
Fig. 4Hardware integration design of the system
A total of 336.0 dm3 of natural gas was used in the experiment, and the calculated amount was 336.42 dm3. According to the experimental results, the maximum error rate between the measured true value and the program calculated value in a single group of tests is 4.83 %. Experimental instruments and equipment: gas storage tanks, pressure sensors, data acquisition cards or modules, computers or control systems. Experimental procedure: a) Prepare the gas storage tank and pressure sensor, and connect the sensor to the data acquisition card or module. b) Open the valve of the gas storage tank to allow gas to enter the sensor. c) Start the data acquisition device and start collecting gas pressure signals. In general, sampling frequency and sampling time can be set to meet the needs of the experiment. d) After collection, the signal is transmitted to the computer or control system for processing and analysis. Software such as MATLAB can be used for data processing and plotting to obtain the gas pressure signal image shown in Fig. 5(e). Analyze the experimental results, determine the source of error between the measured true value and the calculated value, and take appropriate measures to reduce the error. The gas pressure signal data acquisition output is shown in Fig. 5.
Fig. 5Output of gas pressure signal data acquisition
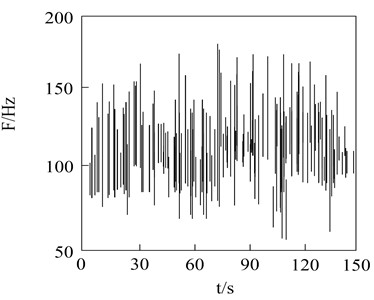
a) Time domain
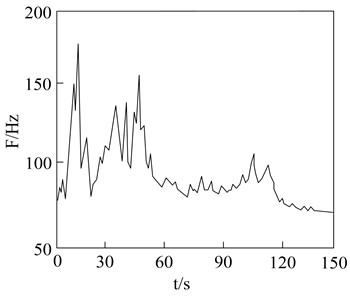
b) Frequency domain
Based on the above output analysis, the short-term gas pressure signal and its STH-AMDF spectrum are peak extracted, and the monitoring results of the indirect metering terminal data of the membrane gas measure device are shown in Fig. 6.
Fig. 6Extraction of spectral peaks for indirect metering terminal data detection of membrane gas measure devices
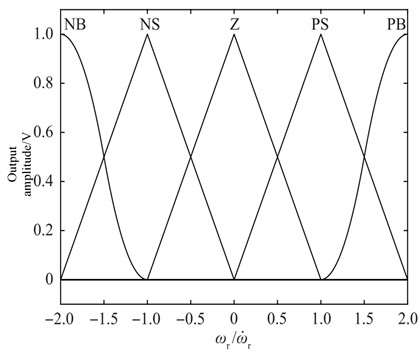
NB, NS, Z, PS and PB are five common filter types in digital signal processing. Narrow Bandpass Filter (NB): Narrow bandpass filter. NS Filter (Notch Stop Filter): notch filter Z Filter (Zero Phase Filter): zero phase filter. PS Filter (Phase Shift Filter): phase shift filter. PB Filter (Passband Filter): indicates a bandpass filter. Different methods are used to test the error of distributed data high-speed acquisition using wireless sensor networks. Integrated high-precision temperature and pressure sensors arranged parallel to the inner wall of the valve body are used to match the membrane type gas measure device. The error rate is calculated as follows:
wherein, represents total sample size. The comparison results are shown in Fig. 7.
Fig. 7Error comparison of distributed data high-speed acquisition
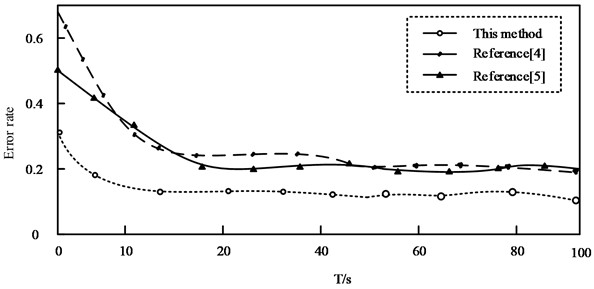
Analyzing Fig. 7 shows that the error rate of the method in this article is always below 0.3 to verify the accuracy of the signal cycle extraction algorithm. A total of 336.0 dm3 of natural gas was used in the experiment, with a calculated consumption of 336.42 dm3. According to the experimental results, the maximum error rate between the measured true value and the program calculated value in a single group of tests is 4.83 %. Due to the average cancellation effect of the positive and negative errors in each group, the cumulative error in all experiments is 0.13 %. The fluctuation amplitude is smaller than that of the other two methods, indicating that the accuracy of the system designed in this paper for high-speed distributed data acquisition is higher.
4. Conclusions
In this paper, a sensor network based indirect metering terminal data monitoring method for membrane gas measure devices is proposed. The distributed and centralized sensor network node deployment method is used to achieve data collection for membrane gas measure device indirect metering terminals, and the collected membrane gas measure device indirect metering terminal data is segmented, fused, and reorganized. The distributed energy storage and constant volume two-level optimal control method is used to analyze the operation status of gas measure device indirect metering terminal data. The ZigBee networking protocol is used to build a network structure model for gas measure device indirect metering terminals. An integrated high-precision temperature and pressure sensor arranged parallel to the inner wall of the valve body is used to detect the temperature and pressure at the outlet of the membrane gas measure device. The temperature information is stored in DSP, and the user’s expenses, system operation and maintenance, and peak shaving and valley filling benefits are used as parameters for the energy storage and constant volume outer layer model. The embedded development of a distributed data acquisition system for wireless sensor networks is carried out in the ARM Cortex-M3 core. The bus interface software is used as the underlying data device for I/O control. The DPS310 sensor is read using the I2C communication protocol, and the gas consumption, the temperature and pressure information is uploaded to the gas information management terminal. Realize dynamic monitoring of metering terminal data in wireless sensor network networking control mode. The test results show that using this method for indirect metering terminal data monitoring of gas measure devices has good output stability, strong dynamic fusion of sensing information, reduced metering errors, and improved metering accuracy of gas measure devices. Because this method can only monitor data from indirect metering terminals, it may not detect other factors that may affect gas metering, such as pipeline leakage or damage. Sensitivity, specificity, uncertainty and confidence intervals should be further explored in future studies.
References
-
W. Xuan, W. Shouxiang, Z. Qianyu, W. Shaomin, and F. Liwei, “A multi-energy load prediction model based on deep multi-task learning and ensemble approach for regional integrated energy systems,” International Journal of Electrical Power and Energy Systems, Vol. 126, p. 106583, Mar. 2021, https://doi.org/10.1016/j.ijepes.2020.106583
-
Z. Liang et al., “Short-term load forecasting based on VMD and PSO optimized deep belief network,” Power System Technology, Vol. 42, No. 2, pp. 598–606, 2018.
-
S. M. J. Jalali, S. Ahmadian, A. Khosravi, M. Shafie-Khah, S. Nahavandi, and J. P. S. Catalao, “A Novel Evolutionary-Based Deep Convolutional Neural Network Model for Intelligent Load Forecasting,” IEEE Transactions on Industrial Informatics, Vol. 17, No. 12, pp. 8243–8253, Dec. 2021, https://doi.org/10.1109/tii.2021.3065718
-
W. Wu et al., “A virtual phase-lead impedance stability control strategy for the maritime VSC-HVDC system,” IEEE Transactions on Industrial Informatics, Vol. 14, No. 12, pp. 5475–5486, 2018.
-
X. Wang and F. Blaabjerg, “Harmonic stability in power electronic-based power systems: concept, modeling, and analysis,” IEEE Transactions on Smart Grid, Vol. 10, No. 3, pp. 2858–2870, May 2019, https://doi.org/10.1109/tsg.2018.2812712
-
L. Yang et al., “Suppression method of high-frequency oscillation by improved notch filter for multi-parallel inverters connected to weak grid,” Transactions of China Electrotechnical Society, Vol. 34, No. 10, pp. 2079–2091, 2019.
-
Y. Ma et al., “An ADRC additional damping control strategy research on low frequency oscillation suppression of photovoltaic plants,” Power System Technology, Vol. 41, No. 6, pp. 1741–1747, 2017, https://doi.org/10.13335/j.1000-3673.pst.2016.3074
-
Zhang, Minghui, Zhou, Yatong, Kong, and Xiaoran, “Short-term electrical load prediction based on deep hybrid reservoir calculation model,” Power System Technology, Vol. 46, No. 12, pp. 4751–4761, 2022.
-
Y. Lu, Y. Teng, and H. Wang, “Load prediction in power system with grey theory and its diagnosis of stabilization,” Electric Power Components and Systems, Vol. 47, No. 6-7, pp. 619–628, Apr. 2019, https://doi.org/10.1080/15325008.2019.1587648
-
S. Zhang et al., “A novel two-stage model based on FPA-VMD and BiLSTM neural network for short-term power load forecasting,” Power System Technology, Vol. 46, No. 8, pp. 3269–3279, 2022.
-
Li et al., “Short-term load forecasting of regional power grid considering demand response in energy interconnection environment,” Automation of Electric Power Systems, Vol. 45, No. 1, pp. 71–78, Jan. 2021, https://doi.org/10.7500/aeps20200428001
-
Xiao Bai et al., “The method of spatial load forecasting based on the generative adversarial network for data scarcity scenarios,” Proceedings of the CSEE, Vol. 40, No. 24, pp. 7990–8001, 2020.
About this article

The authors have not disclosed any funding.
The datasets generated during and/or analyzed during the current study are available from the corresponding author on reasonable request.
Li Gao: writing – original draft preparation. Lulu Che: writing – review and editing.
The authors declare that they have no conflict of interest.
