Abstract
In this paper, we present the design steps of a low cost multi-channel accelerometer system accompanied with an open-source data acquisition software. Hardware part of the system, named KACC, is composed of battery powered tri-axial MEMS accelerometers that use IEEE 802.15.1 protocol for data transmission. The software part, named PyKACC, is developed under Python© open-source environment and handles initiation of data acquisition, data synchronization and data logging. The developed system is tested for synchronization and reliability via shake-table tests and results are presented.
1. Introduction
The accelerometers are widely used in studies such as human health monitoring [1-4], gesture (head, posture, etc.) detection [5-10] and driving safety systems [11-13]. Being one of the sensor usage areas, structural monitoring, as its name suggests, is the observation of a quantity of a structure for risk detection. The observation period depends on the purpose of monitoring, that is, long-term observations are preferred for determination of landscape shifts and aging effects whereas short-term observations are more suitable for forced vibration effects (such as earthquakes, wind and etc.) on the structure. Research activities in this area is reviewed by Kim et al. [14] including piezoelectric sensors, optical fiber sensors, wireless smart sensors, and vision-based sensing systems.
Investigating these effects before the field, forced vibration tests have to be achieved on the lab-scaled structures by using earthquake simulators, shake tables and etc. To determine the characteristics or damage of the structure, one or several parameters, such as relative displacement, velocity, the story drift, vibration frequency, damping and tilt have to be measured via suitable sensors. Damage detection methods can be generally classified as one of two types: local-based and global-based damage detection methods. Local-based damage detection methods attempt to identify damage based on screening structures at their component or subcomponent length-scales (e.g. cracks, yielding). Global-based damage detection refers to numerical methods that consider the global vibration characteristics (e.g. mode shapes, natural frequencies) of a structure to identify damage [15]. Implementation of the global-based damage detection requires densely located sensors with a sampling frequency that is sufficiently high to capture salient dynamic characteristics [16]. In addition, as the number of sensors increase, the synchronization problem of acquired data becomes to be an important issue.
For measurement of global-based damage detection, displacement and acceleration sensors can be used for characterization and testing. Sensors such as LDS (Laser Displacement Sensor), UDS (Ultrasonic Displacement Sensor), linear potentiometric or inductive displacement sensors (LVDTs) require a stable reference frame to derive relative displacement or position measurement [17, 18]. Relevant method is not suitable for, i.e. tall structures, for which it would require an additional effort to construct an accurate and stable reference frame for such sensors. However, accelerometers do not require any referencing with the advantage of easy installation and can be operated alone. Thus, accelerometers are mainly preferred for indirect estimation of displacement in lab-scale and large-scale structures.
For testing lab-scale structures, the cabling between the sensors and the data acquisition system is a big problem. Taking the raw data quality into consideration, the cable length belong to the sensor array and measurement system affects the signal-to-noise ratio of the data and causes noisy measurements. Furthermore, in addition to the cabling cost, it makes the establishment of the experimental setup more complex and affects the experiment comfort. For light structures, weight of the cables has to be taken into consideration in the simulation model of structure to ensure convenient matching between simulation and measurement results. For these reasons, with the first study of Straser and Kiremijdian [19], many researchers and industry have developed wireless accelerometer networks. Accelerometer type and size, sensor output (analog/digital), noise-level and bandwidth, microcontroller board, battery capacity, wireless communication protocol and software are the customizable parameters for those systems with the developing technology and enables tailored wireless accelerometer network designs [20].
For accelerometer type, the force-balanced accelerometer architecture (FBA) can be used for very precise structural monitoring applications as its fine accuracy, ultra-low noise and high-level output [21]. However, these type of sensors require dual-supply DC power and have very high price. Another type of possible low noise accelerometer architecture is Internal Electronic Piezoelectric (IEPE) sensor, which can measure acceleration signals over wide frequency ranges, typically 1 Hz to 10 kHz [22]. IEPE accelerometers are charge mode piezoelectric accelerometers with a charge amplifier built into the accelerometer. They require a constant DC power source and wired type of operation.
Today, Micro-electro mechanical system (MEMS) based accelerometers are another good alternative as they are precisely integrated, have very small size, capable of measuring low accelerations and have a low-cost. MEMS sensors that are to be used for real concrete structure health monitoring should have a high sensitivity with ultra-low noise floor since most ambient acceleration in civil structures are characterized by low-amplitude acceleration. The natural frequencies of civil structures are relatively small and hence the MEMS accelerometers designed for Civil SHM and earthquake sensing do not need to have large bandwidths [23]. Saboto et al. [20] gave a detailed review about latest wireless MEMS-based accelerometer sensor boards with focusing micro-vibration detection and analysis in SHM applications. In the review, optimal design parameters of accelerometers are summarized in Table 1.
Table 1Optimal values of accelerometer to micro-vibration detection [20] (1 g = 9.8 m/s2)
Parameter | Description | Optimal Value | Unit |
Noise-density | Noise output power spectral density | < 49 | µg/√Hz |
Sensitivity | Physical input – electrical output ratio | 1 | V/g |
Sensing range | Detectable amplitude range | ±1.471 | g |
Bandwidth | Detectable frequency range | 0.10-50 | Hz |
Resolution | Smallest detectable acceleration | 0.098 | mg |
However, through SHM applications on lab-scaled structures, micro-vibration sensitivity is not crucial as much as values given in Table 1. A huge number of commercial off-the-shelf (COTS) MEMS accelerometers and modules are available in the market with suitable acceleration range and bandwidth. One can use multi-axis MEMS accelerometers with analog output. However, for wireless sensing and storage, sensor data must be digitized. Sensor datasheets involve characteristics such as sensibility, sensibility versus temperature, zero-g offset, and zero-g offset drift versus temperature and noise density. For temperature-stable, accurate and low-noise measurements without additional noise sources and drifts to those known characteristics of MEMS sensors [24-26], it is required have i) a carefully designed analog-to-digital conversion stage including a precision temperature-stable reference voltage, ii) low offset and drift buffer, iii) suitably selected low-pass filter for anti-aliasing, iv) a high speed and good resolution ADC with high SINAD (signal-to-noise-and-distortion ratio) and high ENOB (effective number of bits), v) correctly designed PCB lay-out that minimizes ground-loops and electromagnetic interference. Examples using analog MEMS accelerometers can be seen in [20], which presents several disadvantages correlated with above parameters. Considering those required additional precise components and efforts for a careful circuit design, digital MEMS accelerometer is a more compact and time saving solution for lab-scale SHM applications. Today, digital MEMS accelerometers enable flexible operations with selectable ranges and output data rates (ODR) via standard serial communication protocols like I2C and SPI. As given in Table 2, in selection of digital MEMS accelerometer type, various parameters such as sensitivity, noise power density, power consumption, zero-g level, drift and etc. should be taken in consideration depending on the required measurement sensitivity and operation.
Table 2Some of digital output MEMS accelerometers in the market and its main characteristics
Model | Operating voltage (V) | Operating current (µA) | Noise (µg/√Hz) | Max. ODR (kHz) | Data output (Bits) | Initial zero-g output (mg) | Zero-g offset temp. coeff. (mg/°C) |
ADXL313 | 2.0 – 3.6 | 170 | 150 | 3.2 | 16 | ±50 | ±0.5 |
ADXL345 | 2.0 – 3.6 | 135 | 420 | 3.2 | 16 | ±35 | ±0.4 |
LSM303DLHC | 2.2 – 3.6 | 110 | 220 | 5.4 | 16 | ±60 | ±0.5 |
LIS3DSH | 1.7 – 3.6 | 250 | 150 | 1.6 | 16 | ±40 | ±0.5 |
LIS2DS12 | 1.6 – 2.0 | 18 | 120 | 6.4 | 16 | ±30 | ±0.2 |
For microcontroller board selection, designer should firstly decide the microcontroller tasks. If, for example, system has to calculate natural frequency of structure without using a laptop or any remote computer, then Field Programmable Gate-Array (FPGA), digital signal processor (DSP) or Application-Specific Integrated Circuit (ASIC) based microcontroller boards with high RAM capacity and fast microprocessors can be selected to achieve high-speed computational operations like buffering large-data, multiplying, filtering and Fast Fourier Transform (FFT). But if the microcontroller is only supposed to receive accelerometer data and send it to the wireless transmitter, a relatively low-speed and low capacity a general purpose microprocessor (GPP) microcontroller would be a better choice [27].
For wireless connection, common used method is Radio Frequency (RF), which is an omni-directional transmission and line-of-sight is not needed. A license free ISM (Industrial, Scientific, and Medical) band is defined by Federal Communication Commission (FCC), which includes frequency bands around 433, 868 MHz and 2.4 GHz for Europe. Transmitting power is limited to 1 W which results in a limited communication range. Generally, for wireless communication there are two-kinds of connections: star (single-hop) and peer-to-peer (multi-hop). The star connection includes a center server and multiple structural sensors, signal conditioning modules, and wireless sensing units. The responsibilities of the server include: (1) commanding all the corresponding wireless sensing units to perform data collection or interrogation tasks, (2) synchronizing the internal clocks of the wireless sensing units, (3) receiving data or analysis results from the wireless sensing units, and (4) storing the data or results. Any desktop or laptop computer connected with a compatible wireless transceiver can be used as the network server [28]. Star connection supports high sampling rates, large data size, precise node-to-node synchronization, and limited data loss, as the routing of data packets only needs a queue for all of the nodes to transmit directly to the base station [20]. For long-range communication, peer-to-peer connection where nodes between two communication endpoints work as relay nodes is used. Due to the increase of communicated data, interference that can produce data loss and time synchronization problems (e.g. jitter, delay, throughput, etc.) may occur among the nodes.
For wireless communication standards, IEEE 802.15.1 (Bluetooth) and the IEEE 802.15.4 (ZigBee) technologies have been seen as the primary standards to support a wireless real-time communication solution capable of coping with the limitations of open environment deployment [29]. Today, Bluetooth Low Energy (BLE) modules (Bluetooth 4.0) are available but they are not very suitable for high-rate data stream compared to Bluetooth Classic [30, 31]. For the other alternative of low energy wireless data transfer, ZigBee, today’s computers do not yet have a direct support for this data protocol. For useful and correct data evaluation, multi-channel data acquisition requires data transfer with instant time information to maintain time synchronization. If the start of the data and the sending period are known, time information can be estimated directly by using data index for each channel. In wireless data transfer, however, an amount of data might be lost depending on the wireless communication protocol. For this situation, direct approach will not work and time synchronization will be lost. Bluetooth is again more reliable transmission protocol that does not require additional management for data loss compared to ZigBee protocol.
Today, various wireless accelerometer systems can be found in the market, but they suffer from at least one of the following drawbacks;
i) High weight or large size,
ii) Offline recording or limited duration of real-time data recording,
iii) Low battery life,
iv) No support for multi-channel data acquisition,
v) Not customizable software,
Proposed system is designed by considering the drawbacks mentioned above. In the following sections the design and development steps of the proposed system and open source software are presented. To determine the synchronization and displacement measurement performance, the system was tested on a small scale model building that was vibrated periodically using a shake-table.
2. Hardware: the KACCs
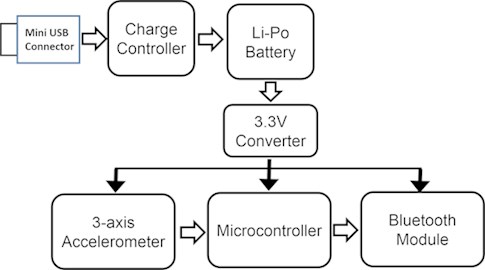
The block diagram and top view of the completed device is shown in Fig. 1 and Fig. 2. In the design process, the device was planned to 1) acquire tri-axial acceleration data with maximum SNR and minimum temperature dependency by an adjustable sampling rate and measurement range, 2) have the ability to be used as a mobile device, 3) have a long-lasting and easily rechargeable battery in acquisition mode, 4) be as small and cheap as possible. Considering the specifications mentioned above, we have use LSM303DLH breakout board. LSM303DLHC has a linear acceleration full-scale of ±2 g / ±4 g / ±8 g that is fully selectable by the user and a resolution of 12-bit reading per axis.
Fig. 1Block diagram of KACC
The board includes an I2C serial bus interface that supports standard mode and fast mode. The accelerometer and the magnetometer have separate 7-bit slave addresses on the I2C bus. The magnetometer’s slave address is 0011110b and cannot be changed. The accelerometer’s slave address has its least significant bit (LSB) determined by the voltage on the slave address selector pad (SA0_A). The carrier board pulls SA0_A to ground through a 4.7 kΩ resistor, setting the accelerometer’s slave address to 0011000b by default. The data output rate is adjusted to 100 Hz by setting bits DR1 = 0 and DR0 = 1 of the CTRL_REG1_A register. The internal high-pass filter is bypassed by resetting FDS bit of the CTRL_REG2_A to enable static acceleration data acquisition. The full-scale of acceleration range is set to ±2 g via setting bits FS = 1 and FS = 0 of CTRL_REG4_A register. The 12-bit acceleration data from each axis are written on two 8 bit registers, namely OUT_X/Y/Z_L_A and OUT_X/Y/Z_H_A.
To transfer acquired data with low power in a cable free environment for mobile and comfortable usage, IEEE 802.15.1 data protocol (Bluetooth) is used. A serial Bluetooth v2.0 + EDR module (HC-06) was chosen. It’s designed for 3.3 V level TTL but accepts 5 V TTL level as well. It supports baud rates from 1200 to 1382400 bps and can be powered with an input voltage between 3.3 V and 6 V.
To read 3-axis accelerometer data and communicate with Bluetooth module, a low-power 8-bit microcontroller PIC16LF877A is used. Device has a wide range of power supply level that is 2.0 V to 5.5 V. It supports I2C, SPI, USART communications and additional properties that enable further developments and modifications.
All electrical power that is needed to run the system is delivered via single-cell 3.7 V Li-Ion battery that has a weight of 22 grams and a dimension of 50.8 mm×33.5 mm×5.9 mm. Battery includes built-in protections against over voltage, over current, and minimum voltage. Battery voltage is regulated with 3.3 V fixed output boost converter TPS61097-33 that has an operating input voltage range of 0.9 V to 5.5 V. The boost converter is based on a current-mode controller using synchronous rectification to obtain maximum efficiency up to 95 %. The maximum average input current is limited to 350 mA. The fixed output device is packaged in a 5-pin SOT-23 package measuring 2.8 mm×2.9 mm.
For recharge of battery via mini-USB port, charge controller MCP73831 is used. It employs a constant-current/constant-voltage charge algorithm with selectable preconditioning and charge termination. The constant voltage regulation is fixed to 4.2 V. The constant current value is set to 100 mA via one external 10 kΩ resistor.
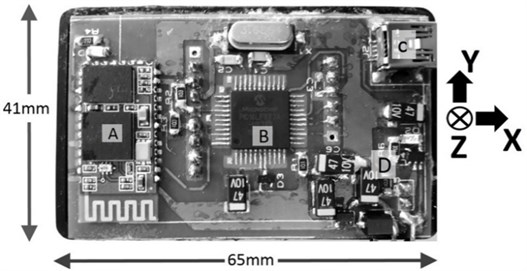
Fig. 2Top view and dimensions of KACC. Main components such as Bluetooth Module (A), microcontroller (B), mini-USB connector (C) and recharge circuitry (D) are visible from the top view. Accelerometer board is embedded on the rear side of the PCB and thus not visible from top view
When the device is in transmit mode, power consumption is measured as 120 mW, while in idle mode it is 17 mW, respectively. Thus, with a fully charged 3.7V 1000 mAh battery, the expected operation time is nearly 30 hours in transmit mode and 210 hours in idle mode which is enough mode laboratory testing.
3. Software: PyKACC
The software part, PyKACC, is developed under Python® (version 2.7.6) open-source environment. Through the development of software, Bluetooth data transmission was realized using a third-party Python library. The GUI of the software is developed via QT Designer, an open-source QT Tool that enables generation of “.ui” file that is then converted to Python GUI generator file. The GUI enables a) the selection of the KACC devices to be connected via check boxes, b) the setting of the name of the recording text file, c) initiation / finalization of the recording, e) the monitoring of multi-channel KACC data. For plotting KACC data, we have used a third-party scientific Python library that provides fast and interactive graphics. The received data sentence from KACCs is in form “X0000Y0000Z0000” where four hexadecimal digits are used to transmit 12 bits acceleration data acquired from each axis. The received data is divided into three vectors and written to a text (*.txt) file, where each column of the text file corresponds to an axis. To prevent receive (input) buffer overflows, the inquiry period and receiver buffer length of Bluetooth sockets should be optimized for multi-channel connections. In addition, Bluetooth connection with each KACC is established by a specific order and time lag which introduce delays between received data from different KACCs. To overcome these problems, after all of the desired KACC connections are established, the software only receives the data for a specific time interval to clear the accumulated data from the input buffers and then starts to record the synchronized data. The time interval is determined empirically. The data recording part of the software is tested under Microsoft Windows and Linux platforms.
4. Calibration and performance tests
Accelerometer sensors are normally calibrated by the sensor manufacturer using a six-element linear model [32]. The model involves a gain and offset in each of the three axes. The original factory accelerometer calibration is less accurate due to packaging and requires recalibration for reliable usage. For this, again, a six element model is used. That is:
where (g units) is the recalibrated output of the accelerometer that generates a factory calibrated output of in g units with an offset which is also in g units. By aligning + and – axis of KACC with gravity direction, the unknowns and can be solved where will be taken as +1 and –1, respectively. Thus, with KACCs aligned on their top, bottom, front, back, left and then right faces, yielding +1 g or –1 g in each channel and zero in the other channels, there have been made 18 measurements of which only 6 was used for six element model calculation. For each measurement, 60 seconds (6000 samples) of data were acquired. Afterwards, the recorded text files were loaded and analyzed for computation of model parameters. The calculated model parameters are shown in Table 3.
Table 3Six-element linear model parameters of KACCs calculated after alignments
Kacc | -axis | -axis | -axis | |||
1 | 1.01136 | 0.03535 | 0.9907 | –0.00321 | 1.02851 | 0.08383 |
2 | 0.98769 | 0.04037 | 0.98557 | –0.00945 | 1.00048 | 0.02219 |
3 | 1.00636 | 0.0131 | 0.99117 | –0.00004 | 1.02016 | 0.03485 |
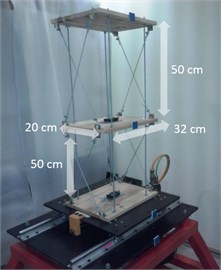
Synchronization and structural monitoring experiments were conducted on two-story shear type frame building model placed on shake table (Fig. 3). Out-of-plane movement of the building was prevented by using cross-braces installed between the floors in the longitudinal direction (-axis). Hence, the lateral and torsional vibration modes were minimized for the building.
Fig. 3Dimensions of the model building and installation on shake table
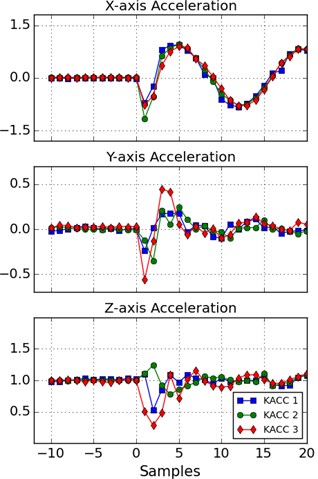
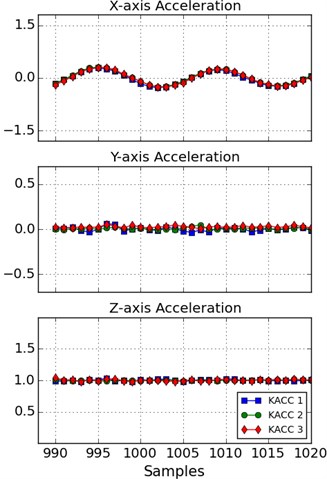
All the KACCs were placed on the first story level of the building and then hammer test was applied in + direction during a previously initiated silent recording in order to determine the synchronization of acquired data from different KACCs. Fig. 4 shows the overlaid KACC data where samples = 0 is the instance of hammer struck. Due to non-zero lateral and torsional bending of the model building, hammer impact had different initial effects on each KACC data. This yielded different peak values at initial samples of acceleration data (Fig. 4, left column graphs). However, as the transient response decayed, acceleration values became clearly more consistent and time synchronized, especially in -axis (Fig. 4, right column graphs).
Fig. 4Acquired data through impulse test: a) Hammer struck (Samples = 0) was applied in x-direction and affected all channels due to lateral and torsional bending of the model building, b) after transient response decayed, only x-axis acceleration had high amplitude due to model building dynamics
a)
b)
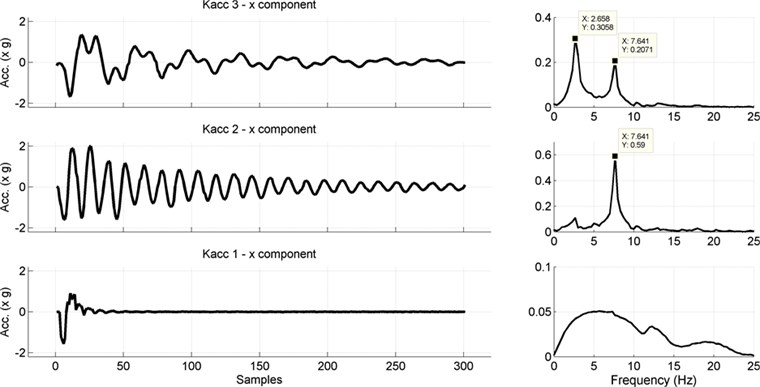
Once the synchronization was assured in hammer test, KACCs were placed their -axis aligned with movement direction on ground (KACC1), first story (KACC2) and second story (KACC3) levels of the building. A step displacement was applied to observe the forced vibration of the building. The ground level accelerometer (KACC1) data only reveal shake-table induced acceleration and do not involve any vibration response of the structure. However, the first floor accelerometer (KACC2) data reveal a damped oscillation with a dominant frequency of 7.641 Hz and a peak acceleration of 2 g. In addition, the top floor accelerometer (KACC3) data have two modes of vibration, with frequencies 2.658 Hz and 7.641 Hz. The data and corresponding spectrums are given in Fig. 5.
Fig. 5Observed x-axis KACC data and corresponding spectrums after step excitation. The ground accelerometer (KACC1, bottom row) data only display the step vibration response whereas the first (KACC2, middle row) and the second (KACC3, top row) accelerometer data display damped oscillating response of the model structure on x-axis
5. Conclusions
The design and realization of a wireless multi-channel accelerometer system with an open-source monitoring and recording software PyKACC is presented. Small and light-weight battery powered acquisition devices, named KACCs, enable cable free and multi-channel data acquisition at a rate of 100 Hz for more than 24 hours of continuous recording with time synchronization. Number of channels was 3 in this study, however it can be enlarged by additional KACCs. This specification is useful for indoor concrete laboratory vibration tests where cabling is an uncomfortable issue for multi-channel acceleration measurements. In addition, since KACC devices are small in scale, it is possible to setup dense KACC arrays for localized acquisition and damage detection. The operation duration may not be satisfactory for long-term observations (i.e. 1-2 months), however, the devices can also be powered with a USB power source in such cases. Further focus on this study will involve higher range transmission choices with additional packaging improvements and temperature dependency tests.
References
-
Jeon A. Y., Kim J. H., Kim J. H., Jung J. H., Ye S. Y., Ro J. H., et al. Implementation of the personal emergency response system using a 3-axial accelerometer. 6th International Special Topic Conference on Information Technology Applications in Biomedicine, 2007, p. 223-226.
-
Angius G., Raffo L. Cardiovascular disease and sleep apnoea: A wearable device for PPG acquisition and research aims. Computing in Cardiology, Vol. 39, 2012, p. 513-516.
-
Kantoch E., Augustyniak P. Human activity surveillance based on wearable body sensor network. Computing in Cardiology, Vol. 39, 2012, p. 325-328.
-
Arai K. Wearable physical and psychological health monitoring system. Science and Information Conference, 2013, p. 133-138.
-
Blackmon F. R., Weeks M. Target acquisition by a hands-free wireless tilt mouse. IEEE International Conference on Systems, Man and Cybernetics, 2009, p. 33-38.
-
Ji Hwan K., Nguyen Duc T., Tae Seong K. 3-D hand motion tracking and gesture recognition using a data glove. IEEE International Symposium on Industrial Electronics, 2009, p. 1013-1018.
-
Zhuxin D., Wejinya U. C., Li W. J. An optical-tracking calibration method for MEMS-based digital writing instrument. Sensors, Vol. 10, 2010, p. 1543-1551.
-
Ruize X., Shengli Z., Li W. J. MEMS Accelerometer based nonspecific-user hand gesture recognition. Sensors, Vol. 12, 2012, p. 1166-1173.
-
Jovanov E., Milosevic M., Milenkovic A. A mobile system for assessment of physiological response to posture transitions. 35th Annual International Conference on Engineering in Medicine and Biology Society, 2013, p. 7205-7208.
-
Kumar P., Pandey P. C. A wearable inertial sensing device for fall detection and motion tracking. 10th Annual Conference of the IEEE-India-Council, 2013.
-
Chang Ming Y., Chih Chung W., Chun Mei C., Tzu Lin Y. Vehicle driver’s ECG and sitting posture monitoring system. 9th International Conference on Information Technology and Applications in Biomedicine, 2009.
-
Guangyi S., Cheung Shing C., Wen Jung L., Kwok Sui L., Yuexian Z., Yufeng J. Mobile human airbag system for fall protection using MEMS sensors and embedded SVM classifier. Sensors, Vol. 9, 2009, p. 495-503.
-
Chih Yang C., Kai Chuin L., Li T. S. Design and implementation of intelligent driving controller for car-like mobile robot. International Conference on System Science and Engineering, 2010, p. 463-468.
-
Kim J. T., et al. Recent R&D activities on structural health monitoring in Korea. Structural Monitoring and Maintenance, Vol. 3, Issue 1, 2016, p. 91-114.
-
Lynch Jerome P., Kenneth Loh J. A summary review of wireless sensors and sensor networks for structural health monitoring. Shock and Vibration Digest, Vol. 38, Issue 2, 2006, p. 91-130.
-
Nagayama T., et al. Issues in structural health monitoring employing smart sensors. Smart Structures and Systems, Vol. 3, Issue 3, 2007, p. 299-320.
-
Park Jong Woong, Sung Han Sim, Jung Hyung Jo Development of a wireless displacement measurement system using acceleration responses. Sensors, Vol. 13, Issue 7, 2013, p. 8377-8392.
-
Sekiya Hidehiko, Kentaro Kimura, Miki Chitoshi Technique for determining bridge displacement response using MEMS accelerometers. Sensors, Vol. 16, Issue 2, 2016, p. 257.
-
Straser E. G., Kiremidjian A. S. A Modular, Wireless Damage Monitoring System for Structures. Technical Report 128, John A. Blume Earthquake Engineering Center, Stanford University, Stanford, CA, 1998.
-
Sabato Alessandro, Christopher Niezrecki, Fortino Giancarlo Wireless MEMS-based accelerometer sensor boards for structural vibration monitoring: a review. IEEE Sensors Journal, Vol. 17, Issue 2, 2017, p. 226-235.
-
Celik Ozan Cem Effect of AAC Infill Walls on Structural System Dynamics of a Concrete Building. Journal of Earthquake Engineering, Vol. 20, Issue 5, 2016, p. 738-748.
-
Levinzon Felix Piezoelectric Accelerometers with Integral Electronics. Springer, 2015.
-
Kavitha S., Joseph Daniel R., Sumangala K. High performance MEMS accelerometers for concrete SHM applications and comparison with COTS accelerometers. Mechanical Systems and Signal Processing, Vol. 66, 2016, p. 410-424.
-
Klusáček Stanislav, et al. Temperature and sensitivity analysis on MEMS vibration sensors with different principles of operation. Proceedings of 22nd International Congress on Sound and Vibration, Florence, Italy, 2015.
-
Bereska Damian, et al. Influence of temperature on measurements of 3-axial accelerometers and gyroscopes: Embedded into inertial measurement unit. IEEE International Conference on Signals and Electronic Systems, 2016.
-
Sawicki Aleksander, Wojciech Walendziuk Analysis of the thermal effect influence on the MEMS accelerometer sensors measurement results. Photonics Applications in Astronomy, Communications, Industry, and High-Energy Physics Experiments, 2016.
-
Nagayama Tomonori, Spencer Billie Jr F. Structural Health Monitoring Using Smart Sensors. Newmark Structural Engineering Laboratory, University of Illinois at Urbana-Champaign., 2007.
-
Wang Yang Wireless Sensing and Decentralized Control for Civil Structures: Theory and Implementation. Ph.D. Thesis, Stanford University, 2007.
-
Bartolomeu Paulo, et al. Survey on low power real-time wireless MAC protocols. Journal of Network and Computer Applications, Vol. 75, 2016, p. 293-316.
-
Mackensen Elke, Matthias Lai, Wendt Thomas M. Performance analysis of an bluetooth low energy sensor system. IEEE 1st International Symposium on Wireless Systems, 2012.
-
Afonso José Augusto, António José Maio F., Simoes Ricardo Performance evaluation of bluetooth low energy for high data rate body area networks. Wireless Personal Communications, Vol. 90, Issue 1, 2016, p. 121-141.
-
Pedley M. High Precision Calibration of a Three-Axis Accelerometer. Freescale Semiconductor Application Note, Document Number: AN4399, 2013.
About this article

This work was supported by Scientific Research Projects Coordination Unit of Istanbul University with Project Nos. 37676 and FBA-2017-24225.
