Abstract
Butt assembly plays a crucial role in the manufacturing process of aviation products, as its assembly quality directly impacts product performance. Current research on the butt assembly of large cylindrical components mainly focuses on attitude measurement or precise cabin attitude adjustment. However, these studies often overlook the influence of the cabin machining error and the attitude deviation during the docking process, as well as the prediction and assessment method of the docking quality. In this paper, the docking force in the assembly process is used as the evaluation basis of docking quality. The actual geometric docking data model is measured and constructed by a 3D scanner. Through a series of docking experiments, the coupling force data under different spatial attitudes are obtained. The docking quality assessing method of aviation components based on attitude measurement is established by examining the internal relationship between the docking area deviation, the maximum docking deviation distance, the space deviation angle and the maximum relay. This approach advances the quality prediction and assessment technology for large aviation components, offering a novel perspective on the assembly and docking of large aviation structures.
Highlights
- The method mainly focuses on the influence of the cabin machining error and the attitude deviation during the docking process.
- The docking quality assessing method of aviation components based on attitude measurement is established by examining the internal relationship between the docking area deviation, the maximum docking deviation distance, the space deviation angle and the maximum relay.
- The quality prediction technology offers a novel perspective on the assembly and docking of large aviation structures.
1. Introduction
Cabin docking is a fundamental and crucial aspect of the aerospace products manufacturing process, as its assembly quality directly affects the product performance index [1]. Aerospace cylindrical components are bulky, and most assembly errors occur in the docking assembly process of cabin sections. Using effective methods to improve the level of product docking and assembly and ensure the product performance is an urgent technical challenge that every aerospace manufacturing enterprise must address.
At present, the research on the cabin docking is concentrated on precise attitude adjustment of the cabin [2], precise control of the cabin attitude adjustment equipment [3], space measurement of the cabin attitude [4], docking path planning of the cabin [5] and so on. Current research can be categorized into two main aspects: studying the docking trajectory and attitude control based on the theoretical model of the product and the docking mechanism [6], or examining the feasibility of various docking methods based on visual guidance [7]. However, the actual assembly conditions are very complex with the machining error of the docking interface, the spatial attitude deviation between the cabins [8], the slight deformation during the docking process, etc. At present, most assembly quality tests are based on digitization and visual recognition. There is a lack of research on the docking and assembly quality prediction of large aviation components under the real docking and assembly conditions.
In this paper, the magnitude of the docking force is used as the metrics for evaluating docking quality. A 3D scanner is employed to measure and construct the actual geometric docking data model [9]. The docking force data of different spatial attitudes were obtained through multiple docking experiments.
The docking quality assessing method of aviation components based on attitude measurement is established by examining the internal relationship between the docking area deviation, the maximum docking deviation distance, the space deviation Angle and the maximum relay. This approach provides an effective theoretical and technical foundation for the docking of large-scale aviation structures.
2. Cabin docking method
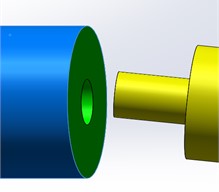
The common docking methods for large cylindrical components can be categorized into two aspects: The one is connection with multiple positioning pin holes, where the posture of the two cabins can be completely determined through two positioning pin holes (or four positioning pin holes) [10], as shown in Fig. 1. The other one is connection with the centering spigot and the phase pin hole, where centering spigot determines the central axis attitude of the cabin, and the phase pin hole determines the circumferential attitude of the cabin, as shown in Fig. 2. They together completely determine the attitude of the two cabins.
Fig. 1The connection method with multiple positioning pin holes (Photos taken by Songkai Liu at the Shenyang Institute of Automation on October 11, 2021)
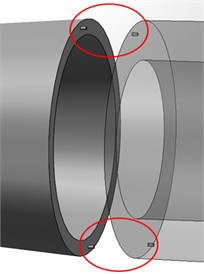
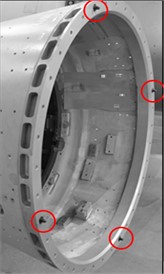
Fig. 2The connection method with the centering spigot and phase pin hole (Photo taken by Songkai Liu at the Shenyang Institute of Automation on October 11, 2021)
Regardless of which docking method is used for connection, the basic structure of positioning between cabin sections is a pin-hole fit (centering spigot can be regarded as a pin hole with a larger diameter). Two or more groups of pin holes are employed to completely determine the relative attitude between the cabins. A single pin-hole structure is analyzed firstly.
2.1. Mathematical model of docking force
Theoretically, when the spatial attitudes of the two cylindrical cabin sections are completely matched, the interaction force during the docking process is fixed. However, due to many factors, such as the size deviation of the docking pin hole, the spatial attitude deviation between the cabins, and the deformation of the cabin, the docking force between the cabins in the actual docking process is much larger than the theoretical value, and sudden spike may exist. The actual docking process needs to be analyzed through a large amount of experimental data.
The size deviation of the butt pin hole is the main factor affecting the docking force, and the space attitude deviation between the cabins is the main reason for the sudden spike of docking force in the actual docking process. The deformation of the cabin will cause the size change of the butt pin hole and the spatial attitude change between the cabin sections, thus affecting the docking force between the cabin sections. Therefore, we conduct theoretical and experimental analysis of the size data and spatial attitude data of the cabin before docking, and the docking force for exploring the mapping among them.
2.2. Pin hole structure analysis
Take the docking process of components with pin-hole structure as an example, where the six degrees of freedom of the active component need to be adjusted to match the passive one. Under ideal conditions, the interaction force during docking process reaches the minimum value when the axes of the pin and the hole are totally coincident. However, in the actual docking process, the ideal state of pin-hole docking can only be infinitely approached even with the help of precise attitude adjustment facility and 3D measuring instrument for attitude measurement. The difference of the interaction force between the ideal and actual process is determined by the attitude adjustment resolution and the attitude measurement error.
At present, there are mainly three ways to study the pin-hole docking problem: (1) directly measuring the spatial attitude of the pin-hole with 3D measuring equipment, such as a laser tracker [11, 12]; (2) evaluating the spatial attitude matching status by measuring the docking force of the pin-hole; and (3) both measuring the pin-hole attitude and the docking force with 3D measuring equipment and force sensors for controlling the docking process with double closed loop.
Fig. 3Diagram of the pinhole
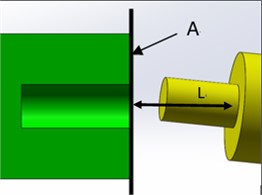
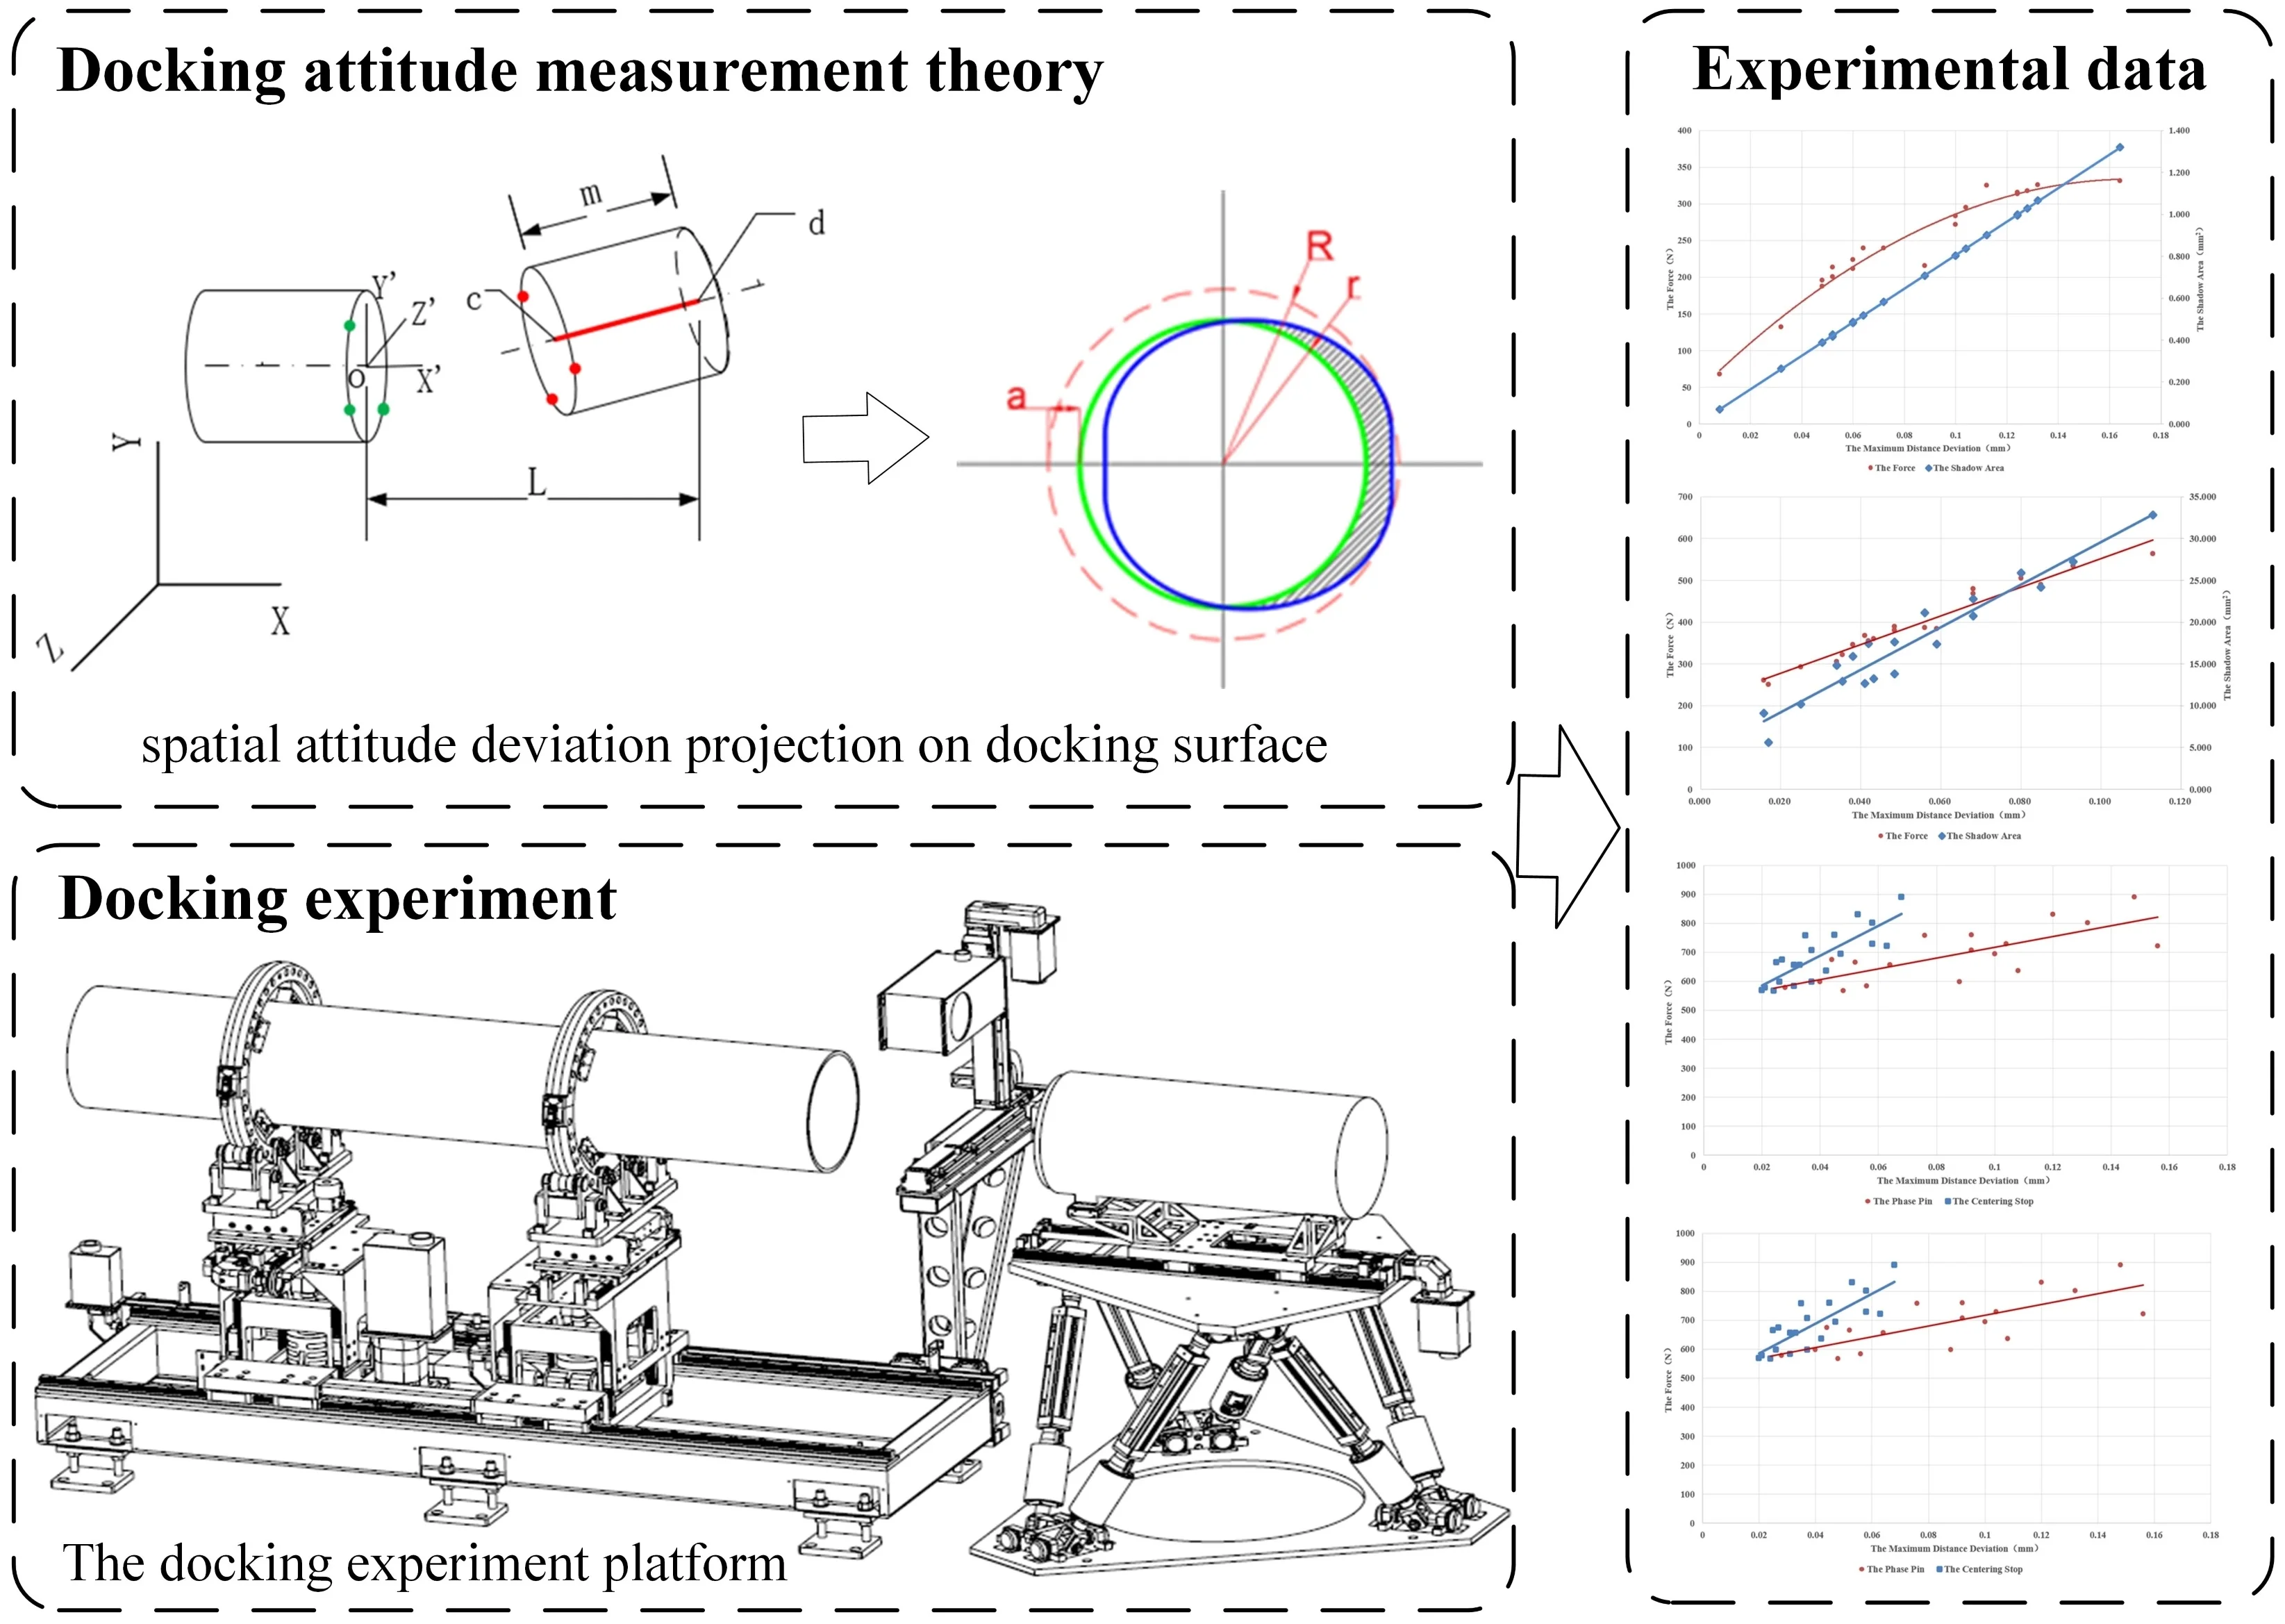
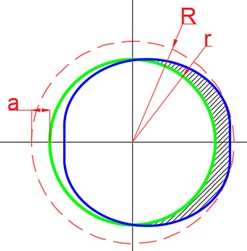
As shown in Fig. 3, the end face of the positioning hole is taken as the reference plane . The distance from the cross-section center of the root of the positioning pin to reference plane is . In Fig. 4, the blue line outlines the overall projection area of the positioning pin on reference plane . The red dotted line shows the maximum envelope circle of the projection area of the positioning pin on reference plane , with the radius of . The green circle is the cross-section of the positioning hole, with the radius of . The shadow area is the part of the positioning pin projection area outside the cross-section of the positioning hole, with the area of . The maximum distance between the cross-section of the positioning hole and the envelop circle is , that is, the difference between the radius of the maximum envelope circle and the radius of the positioning hole section circle ().
The shadow area and the maximum distance deviation are not only related to the relative attitude deviation of the pin and the hole, but also to the mating dimension of the pin-hole. When the axes of the positioning pin and the positioning hole are coincident for clearance fit, is zero, a is a negative value and the docking force is zero.
Through the above analysis, if the mappings from the shadow area and the maximum distance deviation to the docking force are established, then the docking quality can be evaluated by measuring and .
Fig. 4The pin’s projection on plane A
2.3. Measuring principle of pin-hole section size
The spatial attitude of the positioning pin-hole is random, so the spatial attitude of the positioning pin-hole needs to be transformed to the docking surface. Which information about the pin-hole attitude will be employed is first determined.
As shown in Fig. 5, the positioning hole is on the left side, while the positioning pin the right side. , , and are the centers of the positioning hole docking surface, the positioning pin front end and the positioning pin docking surface, respectively. If the coordinates of , , and , as well as the radii of the cross-section circles of the positioning pin and hole can be obtained, the shadow area and the maximum distance deviation can be easily calculated.
Fig. 5Schematic diagram of spatial attitude deviation
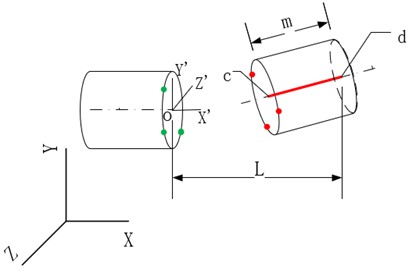
The coordinates of the three circle centers can be determined by multi-points on the circle. As shown in Fig. 5, the coordinate of the circle center can be calculated by coordinates of three green points, but more points lead to more accurate result.
The spherical function and spatial plane function can be expressed by:
The coordinates and radii of the circle centers can be calculated by intersecting the sphere and the spatial plane more accurately, compare with just using the sphere center. According to the least square fitting principle, the objective expectation function can be derived from Eq. (1):
where , , , , , , and are all unknown variables. By calculating the partial derivatives of with respect to , , , and , respectively, we can get:
The following equation can be obtained by rewritten Eq. (3) in matrix form:
Then, the unknown variables , , , and can be calculated as follows:
Similarly, the unknown variables , , and can be obtained by:
Using Eq. (5) and Eq. (6), the functional expression of the section circle of the locating pin hole is finally determined. From the spherical and the spatial plane functions, the spherical center coordinates are (/ 2, / 2, / 2) and the normal vector of the plane is . Assuming that the coordinate of the section circle center is , the following equations can be established:
Thus, the coordinates of , , and shown in Fig. 5 and the radius of the cross-sectional circle can be obtained. The shadow area and the maximum distance deviation can be obtained by coordinate transformation and spatial projection.
Using the above formula to program in MATLAB, the values of and can be quickly calculated by the effective point cloud data from 3D scanner.
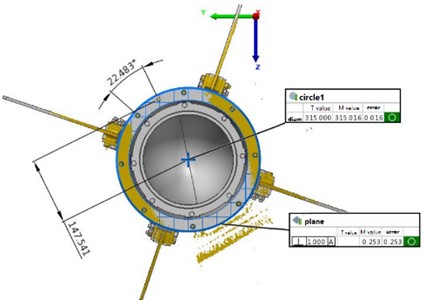
We can also use the point cloud data postprocessing software POLYWORKS for reverse modeling and directly obtain relevant data in the software, as shown in Fig. 6. Then, the values of and can be calculated through simple operations.
Fig. 6The display interface of cabin information
In the actual test, although the principle and programming of the first method are relatively complex, it is more convenient to realize the equipment automation for series operations of measurement, attitude adjustment and docking at the same time, the abnormal data obtained by scanning can be judged and eliminated manually to improve the data accuracy.
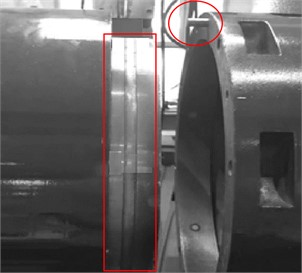
2.4. Design of experiment platform
To find the relationship between the docking force and the area deviation , as well as the docking force and the maximum distance deviation , a precision docking experiment platform is built according to the structure of an aviation component. Its structure is shown in Fig. 7. The experiment platform is mainly composed of a support platform, a support slewing mechanism, a main body attitude adjustment mechanism, an axial movement mechanism, a precision attitude adjustment platform and a docking drive mechanism.
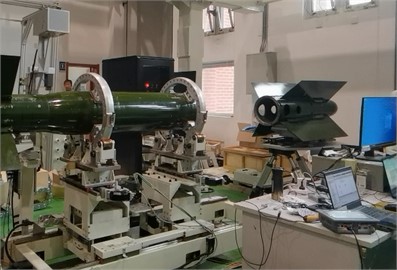
The main body attitude adjustment mechanism is installed on the axial moving mechanism, which is used to drive the two main body attitude adjustment mechanisms to move along the length direction of the platform. A support rotation mechanism is installed on each main body attitude adjustment mechanism for support and circular rotation of cabin section 1. The main body attitude adjustment mechanism can be used to adjust the degrees of freedom in three linear directions . The precision attitude adjustment platform is used for support of cabin section 2 and adjustment of the spatial attitude. A precise Stewart parallel mechanism is adopted for precise attitude adjustment of cabin section 2 in six degrees of freedom [13]. The docking drive mechanism on the precision attitude adjustment platform is employed for movement of cabin section 2 along the axis direction, equipped with a pressure sensor to measure the docking force between the cabin sections. Fig. 8 shows a photograph of the docking experiment platform.
The docking experimental platform can be used for precise attitude adjustment of space sections in six degrees of freedom, with minimum spatial displacement adjustment accuracy of 0.025 mm. With the above experimental platform, several sets of attitude adjustment and docking tests between two cabin sections under different spatial attitudes are conducted to test the docking force between the cabin sections. Since the mating length of the positioning pin holes is mostly approximately 20 mm, the docking process completes in a very short time, resulting in sudden spike of the docking force between the cabins.
Fig. 7Schematic diagram of the docking experiment platform: 1 – support platform; 2 – support slewing mechanism; 3 – main body attitude adjustment mechanism; 4 – axial movement mechanism; 5 – precision attitude adjustment platform; 6 – docking drive mechanism; 7 – cabin section 1; 8 – cabin section 2
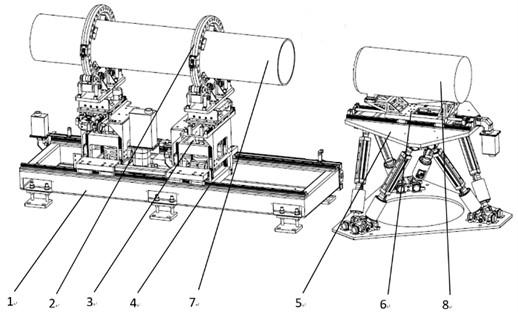
Fig. 8Physical picture of the docking experiment platform (Photo taken by Songkai Liu at the Shenyang Institute of Automation on October 11, 2021)
There are two main reasons for this phenomenon: one is that the ideal attitude of the pin hole cannot be achieved by docking attitude adjustment due to elastic deformation of the positioning pin during the docking process. The other one is inertial force exists in the docking process.
Based on the above reasons, we take the maximum docking force as the assessment metric for attitude adjustment.
3. Experimental data analysis
The commonly used connection methods, the centering spigot and the phase pinhole, were adopted in the experiments.
First, for phase pinhole connection, Table 1 shows 20 groups of the maximum distance deviation , the area deviation and maximum docking force .
Table 1Summary of the test data for single-phase pinhole
No. | (mm) | (mm2) | (N) | No. | (mm) | (mm2) | (N) |
1 | 0.06 | 0.487 | 211.3 | 11 | 0.1 | 0.802 | 271.5 |
2 | 0.124 | 0.994 | 313.4 | 12 | 0.128 | 1.027 | 317.8 |
3 | 0.132 | 1.066 | 325.8 | 13 | 0.052 | 0.427 | 213.6 |
4 | 0.1 | 0.803 | 283.5 | 14 | 0.06 | 0.482 | 223.5 |
5 | 0.032 | 0.264 | 132.4 | 15 | 0.052 | 0.417 | 200.4 |
6 | 0.104 | 0.836 | 295.2 | 16 | 0.112 | 0.900 | 325.3 |
7 | 0.164 | 1.32 | 331.4 | 17 | 0.124 | 1.000 | 315.5 |
8 | 0.048 | 0.389 | 187.3 | 18 | 0.008 | 0.069 | 67.8 |
9 | 0.088 | 0.707 | 215.6 | 19 | 0.048 | 0.387 | 195.7 |
10 | 0.072 | 0.581 | 239.3 | 20 | 0.064 | 0.517 | 239.3 |
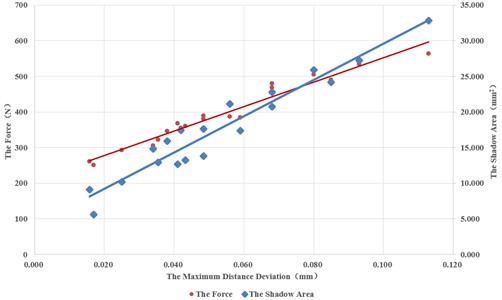
The test data and the fitted curves are shown in Fig. 9.
Fig. 9Relationship between a1 and S1, as well as a1 and Fmax
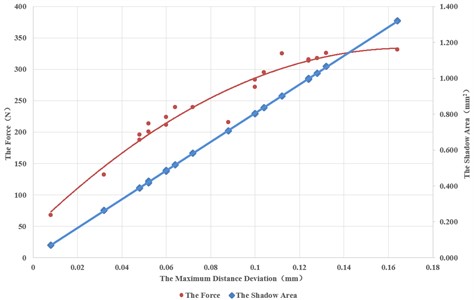
In Fig. 9, the horizontal axis represents the maximum distance deviation , the left axis is the larger force , and the right axis represents the area deviation . The red point represents the test data of the maximum force and the blue point represents the test data of the area deviation . It can be seen that there is an approximately linear relationship between the area deviation and the maximum distance deviation . The linear fitting formula is: , with fitness of 0.99. The relationship between the maximum force and the maximum distance deviation is also very obvious. Although there are some local deviations, it can be fitted using the following second-order polynomial with fitness of 0.95:
The same method was used to test the centering spigot connection. Table 2 shows 20 groups of the maximum distance deviation , area deviation and maximum docking force .
Table 2Summary of the test data of the centering spigot
No. | (mm) | (mm2) | (N) | No. | (mm) | (mm2) | (N) |
1 | 0.148 | 42.018 | FAIL | 11 | 0.113 | 32.848 | 562.9 |
2 | 0.08 | 25.907 | 505.5 | 12 | 0.048 | 17.646 | 380.2 |
3 | 0.056 | 21.133 | 386.5 | 13 | 0.042 | 17.444 | 354.3 |
4 | 0.068 | 22.763 | 480.1 | 14 | 0.016 | 9.065 | 260.4 |
5 | 0.025 | 10.184 | 292.6 | 15 | 0.035 | 12.901 | 321.4 |
6 | 0.041 | 12.638 | 368.2 | 16 | 0.059 | 17.341 | 383.6 |
7 | 0.017 | 5.576 | 250.5 | 17 | 0.048 | 13.821 | 389.6 |
8 | 0.034 | 14.842 | 305.4 | 18 | 0.038 | 15.887 | 345.7 |
9 | 0.093 | 27.238 | 534.6 | 19 | 0.068 | 20.719 | 468.5 |
10 | 0.085 | 24.166 | 489.1 | 20 | 0.043 | 13.222 | 360.3 |
Fig. 10 depicts the test data shown in Table 2 and the fitted curves. It can be seen that relationship between the area deviation and the maximum distance deviation is still linear. Since the data deviate from the fitted linear line more obviously, they can be only linearly fitted with the fitness of 0.93. The linear fitting equation is as follows:
Fig. 10Relationship between a2 and S2 and between a1 and Fmax
Since the fitted curve of the maximum force and the maximum distance deviation with second-order polynomial looks almost a straight line, we also fitted the data with a linear equation. The results are shown in the following table.
Table 3The fitted function of Fmax and a2
No. | Relevance type | Fitted function | |
1 | Linear | 0.96 | 3435.9 + 208.86 |
2 | Nonlinear | 0.97 | –11977 + 4898.6 +172.65 |
The above two tests are either for the phase pin hole or the centering spigot connection. However, during the actual docking process of the product cabin, the two connection methods are used at the same time. So the test combining the two connection methods were also conduct and the experimental data are shown in Table 4.
Linear and nonlinear fitting are performed with the area deviation and its maximum distance deviation for the phase pin hole and the centering spigot connection. Table 5 shows the fitness. It can be seen that the linear and nonlinear fitness are quite close, which can be also seem from Fig. 11.
Table 4Summary of the test data for the phase pin hole and the centering spigot
No. | (mm) | (mm2) | (mm) | (mm2) | (N) |
1 | 0.064 | 0.514 | 0.031 | 10.018 | 656.4 |
2 | 0.156 | 1.252 | 0.063 | 20.555 | 722.1 |
3 | 0.104 | 0.838 | 0.058 | 21.657 | 728.2 |
4 | 0.1 | 0.803 | 0.047 | 15.948 | 694.9 |
5 | 0.028 | 0.232 | 0.021 | 13.679 | 578.5 |
6 | 0.064 | 0.515 | 0.033 | 12.280 | 655.1 |
7 | 0.092 | 0.742 | 0.037 | 15.628 | 707 |
8 | 0.048 | 0.393 | 0.024 | 15.721 | 567.1 |
9 | 0.092 | 0.741 | 0.045 | 16.737 | 760.2 |
10 | 0.052 | 0.417 | 0.025 | 7.907 | 664.3 |
11 | 0.024 | 0.194 | 0.02 | 7.764 | 568.8 |
12 | 0.04 | 0.320 | 0.026 | 6.857 | 597.2 |
13 | 0.088 | 0.714 | 0.037 | 20.472 | 598.5 |
14 | 0.076 | 0.615 | 0.035 | 16.752 | 757.2 |
15 | 0.148 | 1.188 | 0.068 | 21.865 | 890.6 |
16 | 0.12 | 0.962 | 0.053 | 16.085 | 830.1 |
17 | 0.132 | 1.064 | 0.058 | 23.989 | 801.8 |
18 | 0.056 | 0.453 | 0.031 | 13.551 | 583.5 |
19 | 0.108 | 0.866 | 0.042 | 12.900 | 636.7 |
20 | 0.044 | 0.355 | 0.027 | 10.316 | 673.4 |
Table 5The correlation properties of S and a
Phase pin hole | Centering spigot | ||
Relevance type | Relevance type | ||
Linear | 0.999 | linear | 0.650 |
Nonlinear | 0.999 | nonlinear | 0.651 |
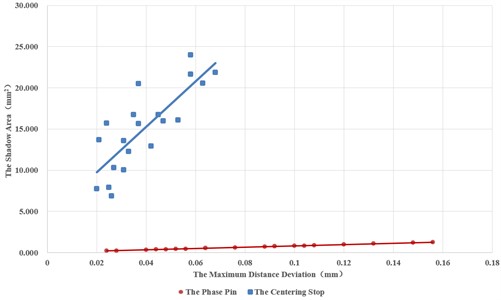
Fig. 11Relationship between a and S of the phase pin hole and the centering spigot
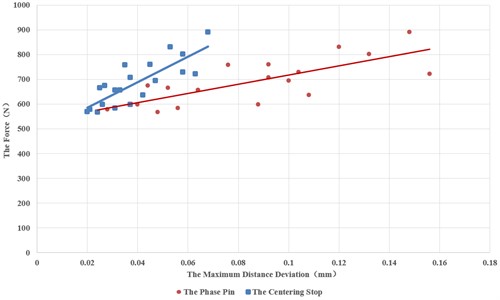
Similarly, the fitness of the relationship between the maximum force of the phase pin hole and the centering spigot and the maximum distance deviation is shown in Table 6. The fitted curves are shown in Fig. 12.
Table 6The correlation properties of Fmax and a
Phase pin hole | Centering spigot | ||
Relevance type | Relevance type | ||
Linear | 0.605 | Linear | 0.668 |
Nonlinear | 0.606 | Nonlinear | 0.668 |
Fig. 12Relationship between a and Fmax of the phase pin hole and the centering spigot
Except for the area deviation of the phase pinhole and its maximum distance deviation a, the fitness of the other relationships are all reduced to approximately 0.66.
The following conclusions can be drawn from the experiments: compared with the whole size of the large cylindrical components, the size of the phase pin is very small. Therefore, there exists a highly linear relationship between the area deviation S and the maximum distance deviation a. The relationship between the area deviation S of the centering spigot and the maximum distance deviation a is uncertain in multiple groups of experiments. The two variables are highly correlated when the centering spigot is used alone. However, when the phase pinhole and the centering spigot are used at the same time for the butt joint, the correlation between the two is relatively low. This indicates that there exists a shape and position deviation between the phase pin hole and the centering spigot caused by machining.
4. Conclusions
This paper takes the most common connection method in the aerospace field, “centering spigot and phase pinhole”, as its research object. Using a 3D scanner, we measure and construct the actual geometric model of the test piece, analyzing its structural form and spatial attitude deviation. In this paper, the complex spatial attitude data are transformed into the area deviation and the maximum distance deviation on the docking surface of the cabin, effectively simplifying the complex docking model into the relationship between docking force and area deviation , as well as docking force and maximum distance deviation .
There exists a multivariate and multi-order complex relationship between (the maximum docking force between the cabins) and (the area deviation of the phase pin hole and the centering spigot), as well as and (the maximum distance deviation of the phase pin hole and the centering spigot), which can be obtained through experiments.
Using the maximum docking force between the cabins as the basis for assessing product docking quality is both effective and feasible. Based on these experiments, the relevant learning algorithms in deep reinforcement learning can be used to construct a more accurate model between the docking force and machining and attitude error.
References
-
Yi W. M., Duan B. W., Gao F., and Han X. G., “Level docking technology in large cabin assembly,” (in Chinese), Computer Integrated Manufacturing Systems, Vol. 21, No. 9, pp. 2354–2360, 2015, https://doi.org/10.13196/j.cims.2015.09.010
-
Y. Li, L. Zhang, and Y. Wang, “An optimal method of posture adjustment in aircraft fuselage joining assembly with engineering constraints,” Chinese Journal of Aeronautics, Vol. 30, No. 6, pp. 2016–2023, Dec. 2017, https://doi.org/10.1016/j.cja.2017.05.006
-
Z. Mei and Y. Fan, “Flexible assembly technique for aircraft parts joining based on laser tracking and positioning,” (in Chinese), Journal of Beijing University of Aeronautics and Astronautics, Vol. 35, No. 1, p. 65, 2009, https://doi.org/10.13700/j.bh.1001-5965.2009.01.010
-
H. Zhao, L. Tian, and J. Zhao, “Analysis of attitude measurement accuracy and indoor evaluation method of photoelectric theodolite,” (in Chinese), Acta Optica Sinica, Vol. 38, No. 1, pp. 177–183, 2018, https://doi.org/10.3788/a0s201838.0112004
-
Z. Yongguo, H. Xiang, F. Wei, and L. Shuanggao, “Trajectory planning algorithm based on quaternion for 6-DOF aircraft wing automatic position and pose adjustment method,” (in Chinese), Chinese Journal of Aeronautics, Vol. 23, No. 6, pp. 707–714, Dec. 2010, https://doi.org/10.1016/s1000-9361(09)60273-9
-
D. Wu and F. Du, “A multi-constraints based pose coordination model for large volume components assembly,” Chinese Journal of Aeronautics, Vol. 33, No. 4, pp. 1329–1337, Apr. 2020, https://doi.org/10.1016/j.cja.2019.03.043
-
Q. S. Zha, Y. G. Zhu, and W. B. Zhang, “Visual and automatic wing-fuselage docking based on data fusion of heterogeneous measuring equipments,” Journal of the Chinese Institute of Engineers, Vol. 44, No. 8, pp. 792–802, Nov. 2021, https://doi.org/10.1080/02533839.2021.1978324
-
Z. Cui and F. Du, “A coordination space model for assemblability analysis and optimization during measurement-assisted large-scale assembly,” Applied Sciences, Vol. 10, No. 9, p. 3331, May 2020, https://doi.org/10.3390/app10093331
-
J. Shi, Z. Sun, and S. Bai, “Large-scale three-dimensional measurement via combining 3D scanner and laser rangefinder,” Applied Optics, Vol. 54, No. 10, pp. 2814–2823, Apr. 2015, https://doi.org/10.1364/ao.54.002814
-
L. Weidong, N. Ruxin, and L. Jianhua, “Computer aided analysis for connection precision of spacecraft section,” Computer Integrated Manufacturing Systems, Vol. 17, No. 4, pp. 732–739, 2011, https://doi.org/10.13196/j.cims.2011.04.62.liuwd.010
-
B. Muralikrishnan, S. Phillips, and D. Sawyer, “Laser trackers for large-scale dimensional metrology: A review,” Precision Engineering, Vol. 44, pp. 13–28, Apr. 2016, https://doi.org/10.1016/j.precisioneng.2015.12.001
-
Y. Cui, S. Schuon, D. Chan, S. Thrun, and C. Theobalt, “3D shape scanning with a time-of-flight camera,” in 2010 IEEE Conference on Computer Vision and Pattern Recognition (CVPR), Jun. 2010, https://doi.org/10.1109/cvpr.2010.5540082
-
G. H. Wu, L. H. Gong, X. W. Ji, Z. J. Wu, and Y. J. Gai, “Optimal design of 6-UPU parallel mechanism,” Key Engineering Materials, Vol. 480-481, pp. 1055–1060, Jun. 2011, https://doi.org/10.4028/www.scientific.net/kem.480-481.1055
About this article

This research is funded by National Defense Basic Scientific Research Program of China (No. JCKY202108B003).
The datasets generated during and/or analyzed during the current study are available from the corresponding author on reasonable request.
Songkai Liu organized activities to annotate and maintain research data for initial use and later reuse. He designed methodology, created models, and applied mathematics and calculation to analyze and synthesize study data. The overall reproducibility of experiments is verified, and he has written the initial draft. Jinkui Chu provided study materials and made the formulation of overarching research goals and aims. In research activities, he assumed management and coordination responsibilities. Geng Liu performed the experiments and data collection. In the process of test data processing, he designed and compiled a data processing program.
The authors declare that they have no conflict of interest.
