Abstract
metalworking today, the assessment of the degree of wear of the cutting wedge of the tool during its operation is an extremely relevant and in-demand task. Even though a large number of methods for monitoring tool life have been developed, there are no unambiguous mathematical dependencies that determine the degree of wear of the cutting wedge according to indirectly measured data. The article proposes a new mathematical apparatus that has not been used before, which makes it possible to adequately interpolate vibrations and temperature in the contact zone into tool wear. The study aim of the study is to develop a method for indirectly estimating the wear rate of the tool, based on a consistent model of intersystem communication describing the force, thermal, and vibration reactions of the cutting process to the shaping movements of the tool. The study consists of experiments on a measuring stand and numerical modeling of the obtained data in Matlab with a comparative evaluation of them with the results of modeling of the mathematical apparatus proposed in the article. The results show that the mathematical model proposed in the article is applicable for an adequate interpretation of experimental data.
1. Introduction
Modern technical solutions in the field of automating the processes of diagnostics and monitoring metal-cutting equipment, including monitoring the cutting tool wear, have come to a new, previously unattainable level. Here, we are talking about new digital control systems based on a wide use of various types of vibration transducers, including those with a digital output. The use of such control and monitoring systems makes it possible to provide higher quality control of metal processing on metal-cutting machines. However, digital vibration monitoring systems themselves do not provide for the optimal quality of metal cutting or maximizing the value of the wedge resistance. They only allow measuring the vibrational characteristics of the cutting process during working operations on metal-cutting equipment. For an adequate interpretation of the measured data arrays, a new mathematical description of cutting processes is required here, which would include the results of processing the measured data.
In the modern scientific journal, a large number of papers are devoted to evaluating the dynamics of cutting processes on metal-cutting machine tools, in which the assessment of the vibration activity of the cutting tool plays an important role [1-5]. The cutting temperature factor, whose effect is very well analyzed in [6], is of vital importance. The system connection with cutting dynamics is presented in [7]. In addition to temperature, the vibration dynamics of the cutting process is strongly affected by the evolution (wear) of the wedge [8-12]. Thus, in the study of V. L. Zakorotny and others [8], the restructuring of the cutting system dynamics with an evolutionary increase in the cutting-tool flank wear is considered. In the work of A. A. Ryzhkin [9], the influence of the temperature field in the tool on the formation of its flank wear is described. In their works, I. G. Zharkov [10] and V. P. Astakhov [11] consider the relationship of the vibration dynamics of cutting process and the wedge wear, including the effect of the temperature field on the formation of the tool flank wear [11], as well as the effect of flank wear through the tool clearance on the cutting force expanded along the decomposition axes [10]. Thus, it was experimentally shown in [10] that when the clearance – decreases from 4 degrees to 2 degrees, cutting force increases by almost 2.2 times, and the force in the feed direction – by three times, at the same time, the clearance of less than 2 degrees no longer allows cutting.
An important factor affecting the vibrational dynamics of the cutting process is the so-called temperature-speed factor [12], which determines the cutting force decrease with an increase in the machining speed. In this work, the causes and nature of the effect of speed on the cutting force are considered in detail. Here, the dependence of chip shrinkage on cutting speed, the length of chip contact with the cutter, and the cutting force, are experimentally determined. In the Russian segment of the scientific community of machine builders, the study of A. D. Makarov [13], is devoted to the evaluation of data obtained experimentally and discovers the interconnected nature of the cutting force and the temperature-speed factor of processing, is widely known. Here, the assessment of the influence of the temperature-velocity factor on the friction of the tool and the workpiece in the zone of their contact along the flank is of great interest. The author notes the presence of a pronounced local minimum of the friction factor when it depends on the temperature in the contact zone. The author hypothesizes the existence of an optimal, from the point of view of providing a minimum of tool vibrations, cutting speed and the corresponding contact temperature of the tool and the workpiece along the flank, at which the friction of the tool and the workpiece is minimal. The optimal temperature in the tool-workpiece contact zone, according to the author, is associated with the fact that at this point there is a minimum of friction due to adhesion between materials, and there is still a low increase in friction due to diffusion of contacting materials.
The influence of the so-called regenerative effect on the treatment process is a secondary cause of tool vibrations undercutting [14-21]. In the works of many European, and not only European authors, the possibility of establishing a chaotic character of tool vibrations during vibration regeneration is also noted [16]. In general, it was possible to establish that the major factor influencing the regenerative effect is the so-called “time delay” [17-20], which determines the process dynamics. In Russia, researchers are also involved in the description and analysis of the nonlinear regenerative dynamics of oscillations (vibrations) of the tool under metal cutting [21, 22]. However, only in the works of V. L. Zakovorotny’s scientific school [22], devoted to the analysis of the nonlinear dynamics of tool deformations, the connectedness of the entire machining process is considered. Therewith, the systemic nature of tool vibration activity during cutting is in focus. With this approach, the dynamic effects arising from the simulation more accurately reflect the nature of the interaction of the subsystem of deformation motions.
2. Methods and Materials
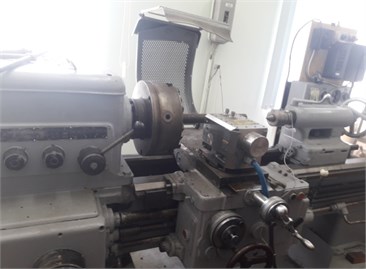
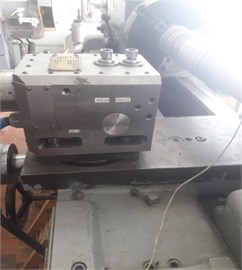
To synthesize a mathematical model of the relationship between wear, the measured temperature in the tool-workpiece contact zone, cutting force, and vibration activity of the tool, we conducted a series of full-scale experiments on a 1K625 lathe (see Fig. 1(a)) with the stand STD. 201-1 installed on it to study the cutting modes under turning (see Fig. 1(b)), as well as experiments on a homemade experimental complex (see Fig. 1(c, d)). The measuring stand STD. 201-1 provides measuring the force response distributed along the tool deformation axes, and temperature in the cutting zone through the effect of natural thermal EMF generated by the tool-workpiece contact. The measuring bench also includes three vibro-accelerometers, which gage vibrations along the tool deformation axes. The experimental machine was premodified. The engine control, which provides the operating modes on the machine, was switched to frequency regulation. Thanks to this, it became possible to smoothly adjust the cutting speed within the selected operating mode of the machine.
1K625 machine shown in Fig. 1, has been renewed; in particular, the engine control, which provides the operating modes of the machine, was transferred to frequency regulation. As a result, it became possible to smoothly adjust the cutting speed within the selected operating mode of the machine. The mode parameters in the experiments were as follows: cutting speed 124 m/min, feed 0.11 mm/rev, cutting depth 0.1 mm. For the entire period of the experiment, the cutting parameters remained unchanged. The selection of these parameters is due to the capabilities of the machine itself, for which, taking into account the material being processed, these are the most optimal cutting elements. As a tool, we used MR TNR 2020 K11 holder, and pentagonal insert 10113-110408 T15K6 as a cutter on it; as well as WNUM 120,612 (02114-120612) H30 (T5K10) KZTS — an interchangeable “broken triangle” hex insert, a cutting insert with an angle in the upper part (attack angle) 35°, and the base entering angle 80° (angle between the projection of the main cutting edge on the base plane and the feed direction) and α=16°. Both the holders and the cutting inserts are made in Russia (Elets, Barkovskogo St., 3, office 2). In the experiment, the holder was isolated from the machine support and the inner walls of the stand using textolite plates. The shaft from steel grade 45 (GOST) was machined. This steel grade is widely used both in Russia (GOST 2591-2006–Steel 45 (st45) — high-quality structural carbon), and in the USA and Germany. American ASTM A568M standard marks this type steel as AISI 1045, and in Germany, the DIN 17200 standard is Ck45. Steel 45 (st45) contains from 0.42 to 0.5 % carbon (this can be traced in the name of the steel grade), 97 % iron, as well as percentages of silicon, manganese, nickel, sulfur, phosphorus, chromium, copper, arsenic [23-25]. The shaft was manufactured using hot rolling technology. Before the experiment, the shaft was cut to a length of 75 cm, then the surface of the shaft was pre-finished and precisely aligned. The selection of this steel grade is due to its wide use in mechanical engineering, which is caused by the high quality of structural steel and its relatively low price in the steel market. A series of experiments was carried out. Note that the paper presents only part of the results of these experiments.
Fig. 1Testing equipment: a) 1k625 machine, b) measuring stand STD. 201-1
a)
b)
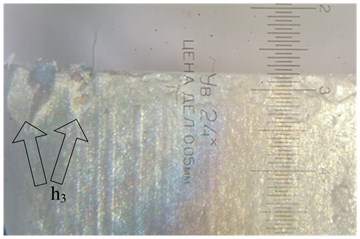
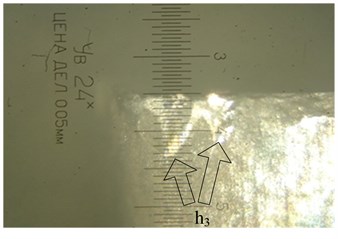
Fig. 2Photos of cutting plate WNUM 120612 (02114-120612)
a)
b)
The tool flank wear was assessed by photographs taken through a microscope. For this purpose, after each step, there were seven such steps, and the wedge was photographed. Fig. 2 shows an example of the photos.
The photographs shown in Fig. 2 illustrate the wear after the third and fourth steps of the experiment, respectively, where, after the third step of the experiment, the wear along the flank was estimated at 0.225 mm, and after the fourth step it was about 0.25 mm.
Fig. 3 shows a graph of the wear curve constructed from the data obtained from the analysis of photographs of the wear of the flank of the wedge.
Fig. 3Wear curve
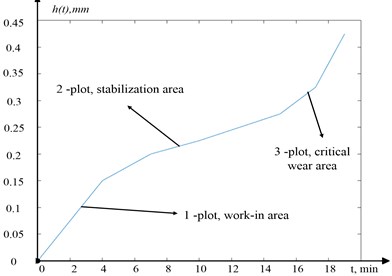
As can be seen from Fig. 3, the experimentally obtained wear curve fully corresponds to the wear curves obtained previously in other experiments, which indicates a fairly high degree of adequacy of the experimental data obtained.
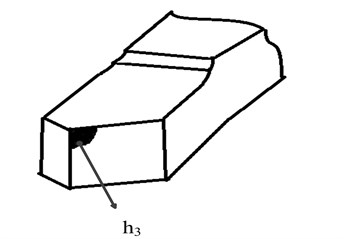
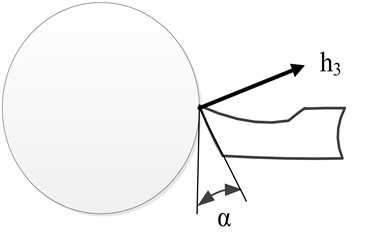
For further correct interpretation of the tool flank wear and taking into account its effect on the clearance – , let us consider an example of the wear formation and its relationship with the clearance, shown in Fig. 4.
Fig. 4Example of formed wear and its relation to clearance
a)
b)
As can be seen from Figure 4, the tool flank with a formed wear area will significantly differ in the clearance from the same face, but without wear. For an adequate interpretation of the data illustrating the experimental results, let us consider an explanatory illustration (see Fig. 5), which introduces deformation directions and the corresponding forces preventing shaping motions.
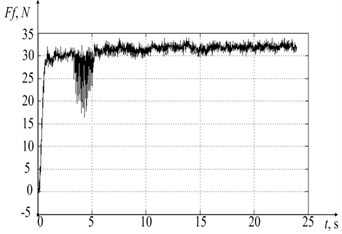
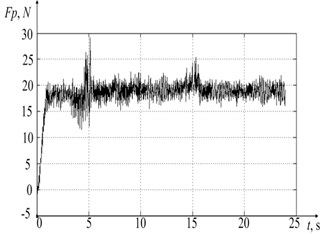
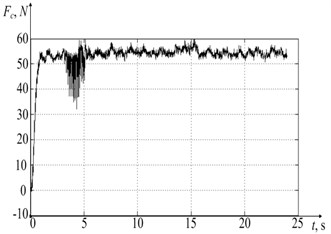
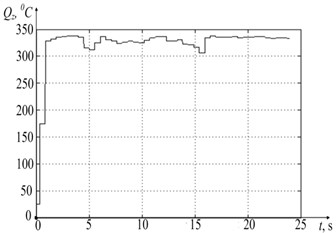
The experimental results with processed datasets on the force decomposed along the deformation axes and temperature in the tool-workpiece contact zone are shown in Fig. 6.
Fig. 6 shows the experimental data, where 6(a), 6(b), and 6(c), is the force preventing the tool shaping motions, decomposed along the deformation axes (see Fig. 5), as well as the graph of temperature variation in the tool-workpiece contact zone 6(d). Also in the experiment, values of the vibration velocity of the deformation motions of the tool tip, taken from the vibration transducers located along the deformation axes , were obtained. The data obtained on the vibration rates of the tool deformation motion made it possible to determine the real cutting speed and feed rate, and, consequently, the real path traveled by the tool tip during processing, and considering the real forces that are presented in Fig. 6, to calculate the arrays of power values released during cutting. The values array for analyzing the path traveled by the tool was calculated as follows:
where – cutting speed (mm/s), – tool tip deformation speed in the direction opposite to cutting (mm/s), – feed rate (mm/s), – tool deformation speed in the opposite direction to feed (mm/s), – tool deformation speed in the direction opposite to the radial one (mm/sec).
Fig. 5Deformation axes and cutting force components
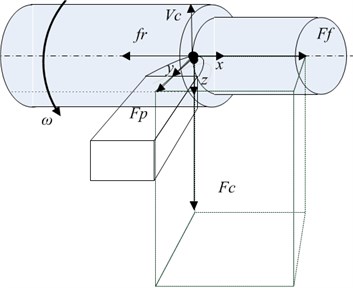
Fig. 6a), b), c) Results of measuring forces along the deformation axes and d) temperature
a)
b)
c)
d)
The calculation of the array of power values released during processing is represented by Eq. (2):
Thus, based on the experimental results, values arrays of the cutting force, decomposed along the axes of deformations, cutting speeds and feeds, the path traversed by the tooltip, as well as the power of irreversible transformations, were obtained.
3. Basic mathematical model
When developing the mathematical model of the dependence of temperature on the power of irreversible transformations released in the tool-workpiece contact zone, the author took into account the method of thermal potentials known in thermodynamics, which is based on the use of the Volterra integral operator [26-27]. A feature of the application of the method of thermal potentials in the case under consideration is that the temperature value at a given time and in a given tool-workpiece contact zone during cutting is determined not only by the current value of the heat released here (cutting power converted into heat), but also by the effect of power allocated on the entire previous path of the product processing time. The very methodology for converting cutting power into heat can be viewed in more detail in the following papers [28-29]. Based on the reasoning given in these works, the current temperature in the tool-workpiece contact zone can be presented as:
where , – dimensionless scaling parameters of the integral operator to be identified, – the coefficient of thermal conductivity, – the temperature value in the tool-workpiece contact zone, – the ambient temperature, – the coefficient characterizing the conversion of the power of irreversible transformations allocated in the tool-workpiece contact zone into temperature, – the path traversed by the top of the tool when cutting (the calculation is given in Eq. (1)), – power released during cutting (the calculation is given in expression 2), and – integration coordinates having the dimension of time and path .
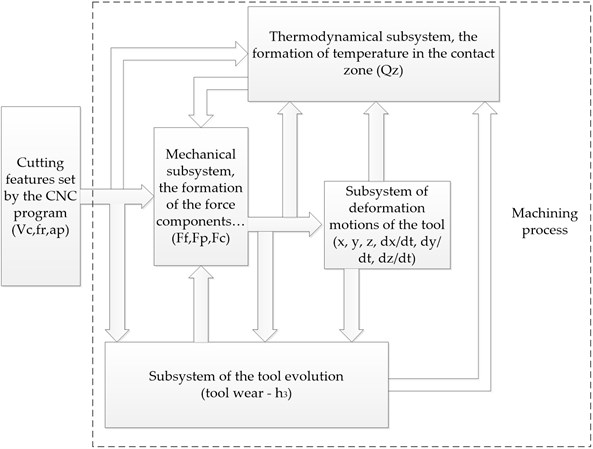
To form a consistent general model of the cutting control system, consider its division into interrelated and interacting subsystems of the cutting system, as shown in Fig. 7. Note that the relationship between these subsystems (see Fig. 7) is not constant, i.e., it evolves as the wear of the wedge develops, which is also represented as a separate subsystem.
The structure of the treatment process, shown in Fig. 7, can be expanded as follows. In the case of tool flank wear, a contact area is formed (see Fig. 4(a)), through which additional heat is transferred to the processing zone, i.e., some preheating of the zone occurs, which will become the cutting zone after one revolution of the spindle. Such preheating causes a certain rise in temperature in the cutting zone, which reduces the energy costs of chip formation and provides some stabilization of the cutting force. Thus, the process of increasing tool flank wear enables to stabilize the vibration activity of the tool after its run-in (the second section of the wear curve, Fig. 3), but already here there is a decrease in the tool clearance (see Fig. 4(b)). Paraphrasing this hypothesis, we can say that when cutting, the control system (see Fig. 7) tends to form such wear of the wedge, in which the force preventing cutting does not increase. It may even decrease slightly, resulting in a slowdown of the vibration activity of the tool, which determines the future roughness of the workpiece [30]. In case of such, the cutting system achieves some stabilization of the second segment of the wear curve by through reducing the vibration activity, as well as by some minimization of the flank friction coefficient [13]. However, while moving along this section of the wear curve, the cutting system loses a certain parameter stability corridor, primarily due to the subsequent decrease in the wedge clearance – , when the cutting system reaches the critical wear section (the third section on the wear curve, Fig. 3).
Fig. 7Cutting control system
In Eq. (3), there is such a parameter , which the author interprets as the time of existence of tool-workpiece contact along the flank (seconds). Taking into account the above reasoning, as well as the results of a series of experiments (see Fig. 6), we define this indicator as:
where – cutting speed with account for the smallness of value compared to , Eq. (4) can be rewritten as:
The effect of this constant on the temperature in the cutting zone is described as follows: the higher the tool flank wear, the greater value , the stronger the impact on the current tool-workpiece contact zone of the previous stages of the machining process. In other words, the greater , the stronger the preheating of the treatment zone. Similar arguments are also valid for the thermal conductivity coefficient . No additional explanations are required here, since this coefficient is directly included in the Fourier equation, and the larger this coefficient, the stronger the effect of the temperature released earlier undercutting the amount of the heat flux directed into the product.
To confirm the adequacy of the accepted mathematical model describing temperature variation during cutting, the author has processed the experimental data in the third and fourth steps, i.e., when the wear characteristic passes from the running-in area to the stabilization area. The graph of cutting temperature variations for the third step of the experiment is shown in Fig. 8.
Fig. 8Temperature graphs for the third step of the experiment
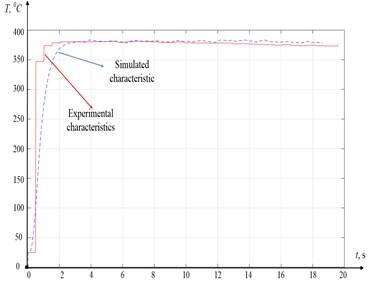
As can be seen from Fig. 8, the experimental and simulated characteristics have a high degree of convergence. There is some mismatch between them in the initial section, up to about the 3rd second of the experiment. This mismatch is explained by the low discretization of the measured thermopower signal. The same characteristic in the fourth step of the experiment is of greater interest (see Fig. 9).
Fig. 9Temperature graphs for the fourth step of the experiment
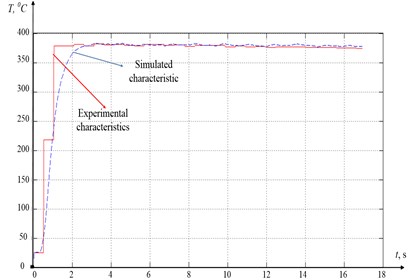
As can be seen from Fig. 9, in comparison to Fig. 8, the degree of convergence of the experimental and simulated characteristics is even higher here. This allows us to conclude that the mathematical model for the formation of thermodynamic feedback in the cutting control system proposed by Eq. (4) is adequate (see Fig. 7).
An important component of the cutting system is a subsystem that indicates the force response to the tool shaping motions (see Fig. 7). Here, when developing the model, as well as in the previous case, it is required to consider the relationship between the force response and the temperature in the tool-workpiece contact zone, as well as with wedge flank wear. When creating a mathematical model of the force response, we will divide this response into two components. The first component describes the reaction to shaping motions in the chip formation zone, and the second component describes the force response of the tool - workpiece contact interaction on the flank wear area.
To develop a consistent model of the cutting force, let us consider some approaches to describing the cutting force. So, in [31], there is the formula of K. A. Zvorykin, which can be presented as:
where and – friction angles at the contact areas of the tool and in the shear plane, respectively; - tensile strength of the material; – depth of the material layer to be cut; – feed rate per workpiece revolution.
The cutting force according to N. N. Zorev, is calculated from the following theoretical dependence [32]:
The analysis of Eqs. (8-9) allows us to make some generalization in the form of the following hypothesis:
where – a certain expansion coefficient of the general reaction force vector on the – the axis of the tool deformation. It should be noted that this approach is widely used within the scientific school of V. L. Zakorotny [22].
We impose normalization on the introduced coefficients , in the form:
The depth of processing will also depend on the deformations of the tool and the workpiece:
where – technologically specified machining depth without considering tool and workpiece deformations (determined by the CNC program).
The feed rate per revolution – can be presented as the following integral [22]:
where – fed rate, – workpiece rotation period.
The second component of the force opposing the shaping motions depends on the tool flank wear, therefore, based on the approach proposed in the work of V. L. Zakorotny [33], the force formed here will be described as:
where – compressive strength of the treated metal in [kg/mm2]; – force rise slope factor, – tool – workpiece contact area on the wedge flank, which will be defined as: , – coefficient determining the steepness of the nonlinear increase in the tool - workpiece contact area with a decrease in clearance . It is convenient to represent angle α itself as the sum of two angles, the very initial clearance and certain dynamic back angle due to the convergence or removal of the flank of the tool from the workpiece. Such clearance will be calculated from the following formula:
However, according to the study of I. G. Zharkov [10], in the process of tool wear, the angle also changes downward. As a hypothesis, this dependence will be defined as exponential (see Eq. (13)):
where – initial, before the formation of the flank wear, clearance, – slope factor of drop-in clearance value.
Through the entering angle – , we expand the force response on the deformation axes and (see Fig. 5), as follows:
The force response in the direction of the coordinate (see Fig. 5), is, originally, nothing more than the friction force, which can be given as:
where – friction coefficient.
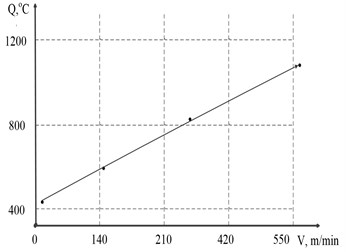
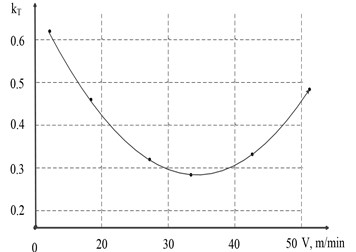
In the work of A. D. Makarov [13], an experimentally determined dependence of the friction coefficient characteristic on the cutting speed is given, which in turn almost linearly determines the contact temperature (see Fig. 10).
Fig. 10Dependences of the friction coefficients on the tool flank during cutting: a) dependence of the temperature in the contact zone on the cutting speed (Steel “E”, t= 0.5 mm, S= 0.21 mm /rev), b) friction coefficient for the case (Steel “HN51VMTYUKFR”, t= 0.5 mm, S= 0.09 mm/rev)
a)
b)
As can be seen from Fig. 10, the friction coefficient indeed decreases significantly with an increase in the contact temperature, which almost linearly depends on the cutting speed. In general, the reduction of the friction coefficient, in Fig. 10(b), amounts to almost 50 % with a 3-fold increase in cutting speed.
Using the approach proposed in Fig. 10, we identify the friction coefficient characteristic from the following expression:
where – some constant minimum value of the friction coefficient, – magnitude of the increment of the friction coefficient with a change in temperature in the contact zone, and are coefficients that determine the steepness of the fall and growth of the friction coefficient characteristic.
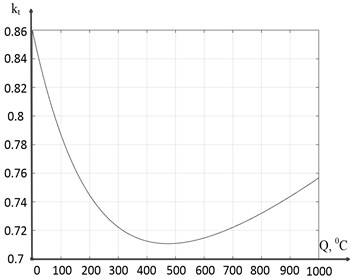
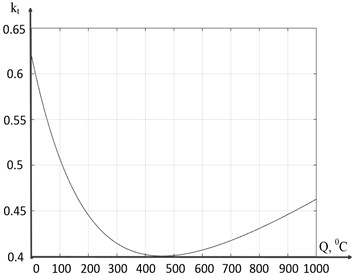
The results of modeling Eq. (16) for two different sets of parameters of this expression are shown in Fig. 11.
Fig. 11Simulated friction coefficient dependence: a) k0t = 0.41, Δkt = 0.45, Kf1 = 0.0046, Kf2 = 0.00042; b) k0t = 0.01, Δkt = 0.62, Kf1 = 0.0052, Kf2 = 0.00039
a)
b)
As can be seen in Fig. 11, compared to Fig. 10(a), both of these characteristics generally meet the task of modeling the friction coefficient, however, the characteristic shown in Fig. 11(b) interprets somewhat more accurately the dependence of friction on the temperature-speed factor of cutting described in the work of A. D. Makarov [13].
Thus, generalizing the description of the force response from the side of the cutting process to the tool shaping motions, we obtain the following equations describing the force reaction:
In addition to the power and thermodynamic subsystems of the cutting system, in the general structure of the control system (see Fig. 7) there is a subsystem of deformation motions of the tool tip, which was indirectly included in our reasoning, but is not directly represented by the model. Considering the dependences of reaction forces proposed by expression 18, as well as relying on the approach to modeling the dynamics of the deformation motion of the instrument used in the scientific school of V. L. Zakorotny [7, 8, 22, 33], assume that the tooltip deformation model will take the following form:
where [kg·s2/mm]; [kg·s/mm]; [kg/mm] – matrices of inertial coefficients, dissipation coefficients and stiffness coefficients, respectively.
Thus, the general mathematical model describing the deformation dynamics of cutting, taking into account the impact of force and thermodynamic feedback, which include, as a parameter, tool flank wear, can be represented by the following system of equations:
4. Simulation results and discussion
To simulate the system of Eq. (20), programs were developed in the Matlab and Matlab/Simulink 2014 environments. The simulation results for three options of the flank wedge wear are given below. For the first option, the value taken at the tool running-in area (0.14) was used, for the second value – at the wear stabilization area (0.25), and for the third value – close to critical wear (0.44) (see Fig. 3).
In all experiments, we assume that the system describing the tool deformation motions is characterized by the following parameters:
Orientation factors: 0,3369, 0,48, 0,81. Process conditions: depth 1 mm, feed 0,11 mm, spindle speed rpm, 400 kg/mm2, workpiece radius 35 mm, 80° and 16°.
To assess the quality of the formed surface in all experiments, the total vibration energy of the tooltip was rated. It was calculated as the rms value of vibration velocities for the measurement period .
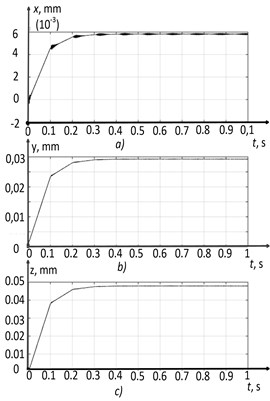
Consider the simulation option for the dynamics of the cutting system in the first section of the wear curve, where 14, the simulation results in the form of deformation coordinates and their corresponding phase trajectories are shown in Fig. 12.
Fig. 12Run-in section h= 0.14: a) x-coordinate, b) y-coordinate, c) z-coordinate, d) x-phase trajectory, e) y-phase trajectory, f) z-phase trajectory
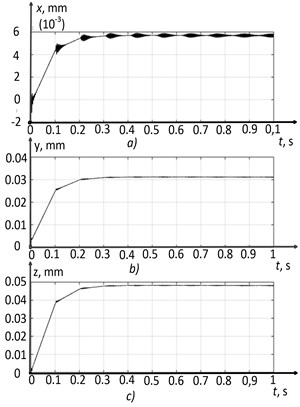
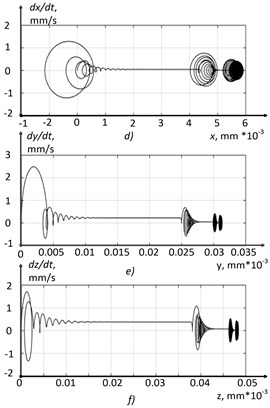
As can be seen from Figs. 12(a, b, and c), the deformation coordinates of the tool tip increase to a certain value, in the vicinity of which permanently tunable coordinate vibrations occur. The analysis of the phase trajectories presented in Figs. 12(d, e, and f), allows us to conclude the form of the cutting system phase portrait in this section of the wear curve. Here, the establishment of a two-dimensional torus is observed, as the main type of the phase portrait of the system. The total vibration energy value for this simulation case was 31 mm/s.
The results of modeling the cutting system dynamics in the second section of the wear curve are shown in Fig. 13.
Fig. 13Run-in section h= 0.25: a) x-coordinate, b) y-coordinate, c) z-coordinate, d) x-phase trajectory, e) y-phase trajectory, f) z-phase trajectory
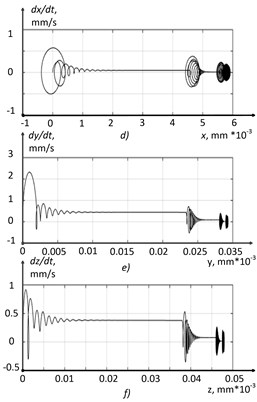
In the simulation option of the cutting control system shown in Fig. 13, the tooltip vibrations are smaller in amplitude than in the case shown in Fig. 12 (Fig. 13(a, b, c)). The indicator of the total vibration energy of the cutting tool tip was 23 mm/s, which is 25 % lower than the previous value. Namely, the process has become more stable, while the vibrations of the tip do not disappear completely, and the same two-dimensional torus is observed on the phase plane (see Fig. 13(d)). The explanation for this phenomenon is the nonlinear characteristic of the friction coefficient introduced in the previous section of the paper (see Eq. (17)), which has a pronounced local minimum at a temperature of 450 °C.
The results of modeling the system of integrodifferential Eq. (20) in the area of critical wear, the third part of the characteristic shown in Fig. 3, are shown in Fig. 14.
Fig. 14Run-in section h= 0.44: a) x-coordinate, b) y-coordinate, c) z-coordinate, d) x-phase trajectory, e) y-phase trajectory, f) z-phase trajectory
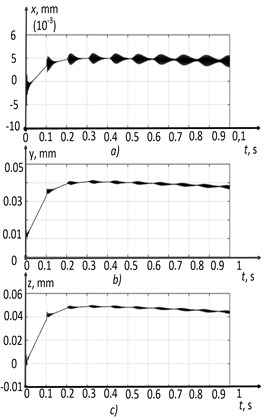
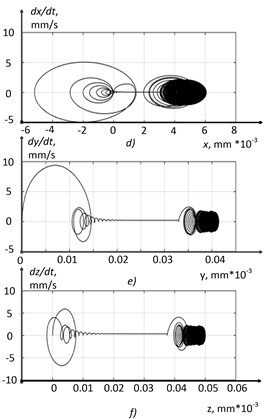
When critical wear is reached (0.44), the cutting control system loses stability (see Fig. 14). The amplitude of the tooltip vibrations increases (see Fig. 14(a, b, c)), and the total vibration energy reaches the value 79 mm/s, which is higher than the value in the first section by 255 % and in the second section by 343 %. Phase trajectories are transformed from a toroidal structure into a structure resembling an unstable cycle, i.e., here, the limit cycle is a repulsive manifold.
Note that the results obtained coincide with the experimental results, some of which are described in the previous section of the paper, and also published in several previous papers [28-29]. The experiments did show that in the second section of the wear curve there is a slight drop in the amplitude of the vibration activity of the tool, compared to the first section, and in the third section of the wear curve, a sharp increase in the amplitude of vibrations, significantly exceeding the amplitude of vibrations in the first and second sections.
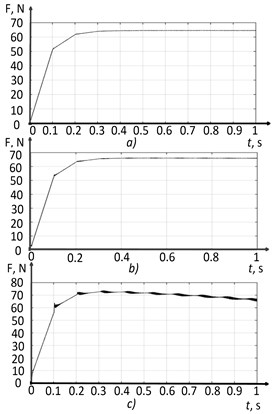
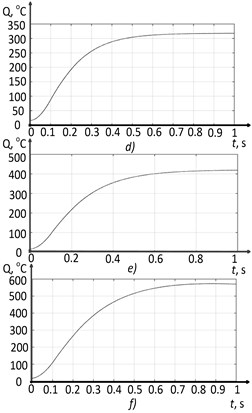
The results of modeling the total cutting force and temperature in the tool-workpiece contact zone are shown in Fig. 15.
As the tool flank wear area increases, the temperature in the tool-workpiece contact area also grows (see Fig. 15). In the second section, the temperature reaches values close to the local minimum of the curve reflecting the dependence of the friction coefficient on the contact temperature (see Fig. 11(b)). Due to this, the total force preventing the shaping motions of the tool is stabilized. As a result, the entire second section of the wear curve is stabilized, but after the wear reaches above a certain critical value, the entire treatment process is destabilized. After that, the cutting force increases significantly, due to both the growth of the contact area along the flank (see Eq. (14)), and the temperature value going beyond the zone of the local minimum of the friction coefficient.
Another reason for the loss of stability of the cutting system is the change in the time constant of the thermodynamic subsystem of the cutting system. As can be seen from Fig. 15(d, c, f), with increasing tool wear, not only does the temperature in the tool-workpiece contact zone grows, but also the response time of the thermodynamic subsystem of the cutting system to changes in the power of irreversible transformations. Mathematically, this is explained by the change in constant , which increases as the number of wear increases (see Eq. (6)). The experimental data confirm this position, and this effect is described in more detail in the previous work [29]. The change in the response time of the thermodynamic subsystem of the cutting system causes the following: at some stage of the evolution of the cutting system, the response of this system is so delayed concerning the power subsystem reaction that the temperature no longer compensates for the growth in cutting force.
In general, the effect of the wedge evolution undercutting on the stability of tool tip deformation vibrations during metal turning can be described as follows. Tool wear in the first section causes the formation of a tool-workpiece contact area on the wedge flank. This area begins to form its force interaction, which results in a change in temperature in the cutting zone, and after running in – to the stabilization of power and temperature components of the contact interaction. We can say that the running-in of the tool on the first section of the wear curve causes the optimization of temperature-force components of the cutting process, i.e., here, the cutting process tends to change the friction coefficient through searching for the extremum of its characteristic. After hitting this local minimum, the increase in wear of the wedge slows down, but subsequently, as a result of its slow growth, wear reaches a critical value at which, as a result of the destabilization of the temperature-force reaction, the entire system loses stability.
Fig. 15Processing force and temperature: a) cutting force in the first section, b) cutting force in the second section, c) cutting force in the third section, d) processing temperature in the first section, e) processing temperature in the second section, f) processing temperature in the third section
5. Conclusions
Thus, the effect of tool flank wear on the stability of the system of vibration motions of the tool under the conditions of metal turning on metal-cutting machines at three points of the wear curve has been studied. It is determined here that the loss of stability of the treatment process, when critical wear is reached, is associated with the destabilization of the temperature-force reaction to external disturbances. Destabilization is understood as a significant mismatch in response time between the power and thermodynamic subsystems of the cutting system, as well as the loss of the extreme nature of the nonlinear characteristic of the friction coefficient with a further increase in temperature of the tool-workpiece contact interaction.
The research conducted is of scientific interest. It has been found that it is the thermodynamic feedback formed undercutting that largely determines the nature of the complex dynamics of the treatment process. This particular relationship is both a stabilizing and destabilizing factor in the cutting process, evolving as the wedge-workpiece contact changes on the area formed during its wear.
So, the work is aimed at mathematical substantiation, in the form of an analysis of the model proposed by the author, the position put forward by A. D. Makarov, in which he claims that there is some optimal cutting mode from the point of view of the quality of the treated surface. In the article, based on the direct analysis of the author's nonlinear model of the contact interaction model of the tool and the workpiece, it is shown that such a mode exists and it is associated with special conditions formed on the back face of the cutting tool. The implementation of this mode in a certain area of wear of the cutting wedge is carried out due to the formation of thermodynamic feedback, which stabilizes the vibrations of the cutting wedge, thereby improving the quality of the treated surface. Such a rather complex, systematic approach to the description of a well-known, but not mathematically interpreted effect is used for the first time.
References
-
S. N. Huang, K. K. Tan, Y. S. Wong, C. W. de Silva, H. L. Goh, and W. W. Tan, “Tool wear detection and fault diagnosis based on cutting force monitoring,” International Journal of Machine Tools and Manufacture, Vol. 47, No. 3-4, pp. 444–451, Mar. 2007, https://doi.org/10.1016/j.ijmachtools.2006.06.011
-
H. Arslan, A. Osman Er, S. Orhan, and E. Aslan, “Tool condition monitoring in turning using statistical parameters of vibration signal,” The International Journal of Acoustics and Vibration, Vol. 21, No. 4, pp. 371–378, Dec. 2016, https://doi.org/10.20855/ijav.2016.21.4432
-
F. J. Alonso and D. R. Salgado, “Application of singular spectrum analysis to tool wear detection using sound signals,” Proceedings of the Institution of Mechanical Engineers, Part B: Journal of Engineering Manufacture, Vol. 219, No. 9, pp. 703–710, Sep. 2005, https://doi.org/10.1243/095440505x32634
-
S. Orhan, A. O. Er, N. Camuşcu, and E. Aslan, “Tool wear evaluation by vibration analysis during end milling of AISI D3 cold work tool steel with 35 HRC hardness,” NDT and E International, Vol. 40, No. 2, pp. 121–126, Mar. 2007, https://doi.org/10.1016/j.ndteint.2006.09.006
-
V. Lapshin, D. Moiseev, and V. Minakov, “Diagnosing cutting tool wear after change of cutting forces during turning,” 2nd International Conference on Material Science, Smart Structures and Applications: ICMSS-2019, Vol. 2188, No. 1, p. 030001, 2019, https://doi.org/10.1063/1.5138394
-
M. Bacci Da Silva and J. Wallbank, “Cutting temperature: prediction and measurement methods-a review,” Journal of Materials Processing Technology, Vol. 88, No. 1-3, pp. 195–202, Apr. 1999, https://doi.org/10.1016/s0924-0136(98)00395-1
-
V. L. Zakovorotny and I. A. Vinokurova, “Effect of heat generation on dynamics of cutting process,” (in Russian), Vestnik of Don State Technical University, Vol. 17, No. 3, pp. 14–26, 2017, https://doi.org/10.23947/1992-5980-2017-17-3-14-26
-
V. L. Zakovorotnyi, V. E. Gvindjiliya, and V. P. Lapshin, “Dynamics of tool deformation in the cutting system,” Russian Engineering Research, Vol. 41, No. 3, pp. 246–251, Mar. 2021, https://doi.org/10.3103/s1068798x21030230
-
A. A. Ryzhkin, Synergetics of Wear of Tool Cutting Materials (Triboelectric Aspect). (in Russian), Rostov-on-Don: DSTU Publ. House, 2004.
-
I. G. Zharkov, Vibrations during Processing by Blade Instrumentom. (in Russian), Leningrad: Mashinostroenie, 1986.
-
V. P. Astakhov, “The assessment of cutting tool wear,” International Journal of Machine Tools and Manufacture, Vol. 44, No. 6, pp. 637–647, May 2004, https://doi.org/10.1016/j.ijmachtools.2003.11.006
-
M. F. Poletika, “On the question of the influence of the properties of the processed material on the chip formation process,” (in Russian), Georesource engineering, Vol. 305, No. 1, pp. 12–20, 2002.
-
Makarov and A. D., Optimization of Cutting Processes. (in Russian), Moscow: Mashinostroenie, 1976.
-
B. Balachandran, “Nonlinear dynamics of milling processes,” Philosophical Transactions of the Royal Society of London. Series A: Mathematical, Physical and Engineering Sciences, Vol. 359, No. 1781, pp. 793–819, Apr. 2001, https://doi.org/10.1098/rsta.2000.0755
-
G. Stépán, “Modelling nonlinear regenerative effects in metal cutting,” Philosophical Transactions of the Royal Society of London. Series A: Mathematical, Physical and Engineering Sciences, Vol. 359, No. 1781, pp. 739–757, Apr. 2001, https://doi.org/10.1098/rsta.2000.0753
-
G. Litak, “Chaotic vibrations in a regenerative cutting process,” Chaos, Solitons and Fractals, Vol. 13, No. 7, pp. 1531–1535, Jun. 2002, https://doi.org/10.1016/s0960-0779(01)00176-x
-
Sri Namachchivaya and Beddini, “Spindle speed variation for the suppression of regenerative chatter,” Journal of Nonlinear Science, Vol. 13, No. 3, pp. 265–288, Jun. 2003, https://doi.org/10.1007/s00332-003-0518-4
-
P. Wahi and A. Chatterjee, “Regenerative tool chatter near a codimension 2 Hopf point using multiple scales,” Nonlinear Dynamics, Vol. 40, No. 4, pp. 323–338, Jun. 2005, https://doi.org/10.1007/s11071-005-7292-9
-
G. Stépán, T. Insperger, and R. Szalai, “Delay, parametric excitation, and the nonlinear dynamics of cutting processes,” International Journal of Bifurcation and Chaos, Vol. 15, No. 9, pp. 2783–2798, Sep. 2005, https://doi.org/10.1142/s0218127405013642
-
H. Moradi, F. Bakhtiari-Nejad, M. R. Movahhedy, and M. T. Ahmadian, “Nonlinear behaviour of the regenerative chatter in turning process with a worn tool: Forced oscillation and stability analysis,” Mechanism and Machine Theory, Vol. 45, No. 8, pp. 1050–1066, Aug. 2010, https://doi.org/10.1016/j.mechmachtheory.2010.03.014
-
A. M. Gouskov, S. A. Voronov, H. Paris, and S. A. Batzer, “Nonlinear dynamics of a machining system with two interdependent delays,” Communications in Nonlinear Science and Numerical Simulation, Vol. 7, No. 4, pp. 207–221, Dec. 2002, https://doi.org/10.1016/s1007-5704(02)00014-x
-
V. Zakovorotny and V. Gvindjiliya, “Correlation of attracting sets of tool deformations with spatial orientation of tool elasticity and regeneration of cutting forces in turning,” Izvestiya VUZ. Applied Nonlinear Dynamics, Vol. 30, No. 1, pp. 37–56, Jan. 2022, https://doi.org/10.18500/0869-6632-2022-30-1-37-56
-
“Metal products from nonalloyed structural quality and special steels,” GOST 1050-2013, General specification, 2021.
-
“Standard specification for general requirement for steel, carbon and high-strength low-alloy hot-rolled sheet and cold-rolled sheet (metric),” ASTM A568M, ASTM, 1990.
-
“Steels for quenching and tempering,” DIN 17200, Technical delivery conditions, 2015.
-
Belyaev, N. M., Ryadno, and A. A., Methods of the Theory of Teploprovodnost: Part 2. (in Russian), Moscow: Vysshaya shkola, 1982.
-
G. N. Polozhii, Equations of Mathematical Physics. (in Russian), Moscow: High School, 1964.
-
E. V. Bordatchev and V. P. Lapshin, “Mathematical temperature simulation in tool-to-work contact zone during metal turning,” Vestnik of Don State Technical University, Vol. 19, No. 2, pp. 130–137, Jun. 2019, https://doi.org/10.23947/1992-5980-2019-19-2-130-137
-
V. P. Lapshin, “Turning tool wear estimation based on the calculated parameter values of the thermodynamic subsystem of the cutting system,” Materials, Vol. 14, No. 21, p. 6492, Oct. 2021, https://doi.org/10.3390/ma14216492
-
C. Felho and G. Varga, “Theoretical roughness modeling of hard turned surfaces considering tool wear,” Machines, Vol. 10, No. 3, p. 188, Mar. 2022, https://doi.org/10.3390/machines10030188
-
A. M. Wolf, Metal Cutting. (in Russian), Leningrad: Mechanical Engineering, 1973.
-
N. N. Zorev, Questions of Mechanics of the Metal Cutting Process. (in Russian), Moscow: Mashgiz, 1956.
-
V. E. Gvindjiliya and V. L. Zakovorotny, “Self-organization and evolution in dynamic friction systems,” Journal of Vibroengineering, Vol. 23, No. 6, pp. 1418–1432, Sep. 2021, https://doi.org/10.21595/jve.2021.22033
About this article

This study was carried out with the financial support of the Don State Technical University.
The datasets generated during and/or analyzed during the current study are available from the corresponding author on reasonable request.
The authors declare that they have no conflict of interest.
