Abstract
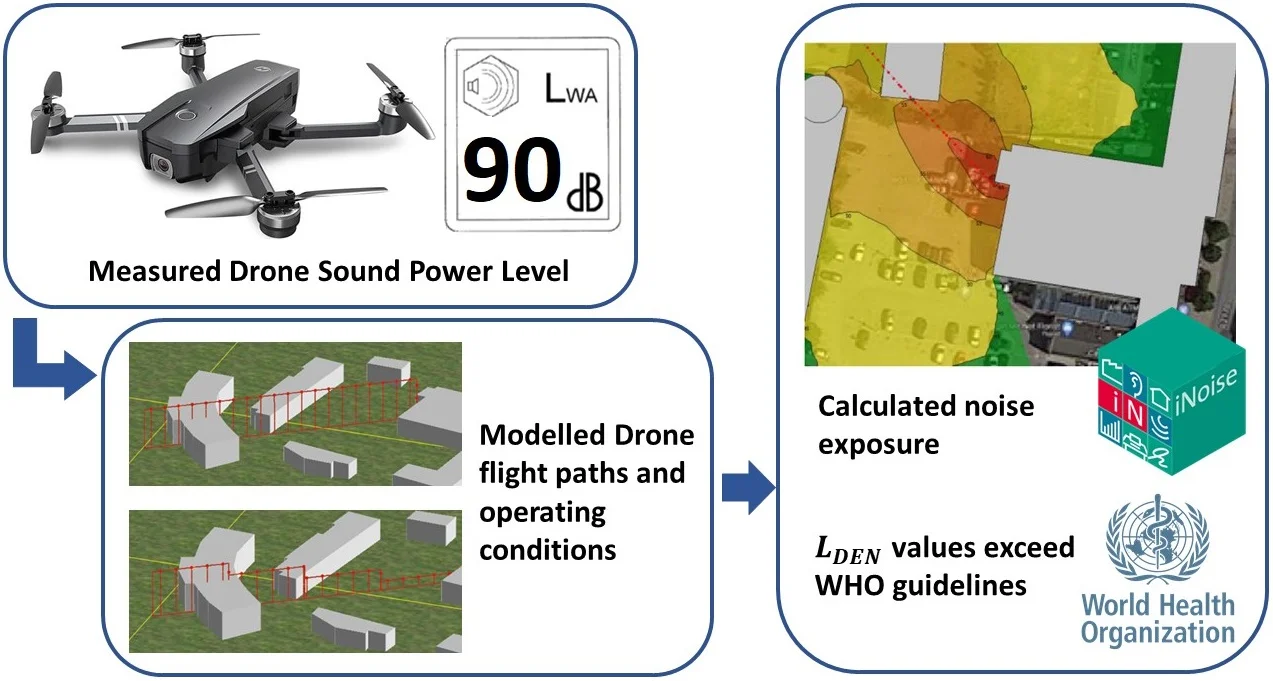
According to studies by Airbus, one of the biggest concerns among the public regarding drones is the noise they produce. ICAO have also stated that when drones are flown “low and in great numbers” they will cause a significant level of noise. To date there is literature around the public’s perception of drone usage and noise, however there is currently no recommended software package for modelling drone noise. There has also been little work done into the level of noise that is likely to be emitted by drones used in the commercial market for tasks such as parcel delivery. This research aimed to investigate the noise emitted by drones and determine suitable operating conditions and flight paths to mitigate this noise. The research also aimed to investigate the suitability of the software package ‘iNoise’ for modelling noise emission by drones. The results showed noise emission can be mitigated by maintaining high altitudes and high speeds, as well as vertical take offs and landings. Although many of the noise levels recorded in this research for different flight conditions and flow numbers were lower than the maximum recommended LDEN for road traffic noise, they did approach this value at low speeds. As the sound power level used in this project came from a small quadcopter, it is reasonable to assume larger, commercial drones will have a higher sound power level, thus increasing the need for noise mitigation measures. The research also demonstrated the suitability of iNoise for modelling noise emissions caused by drone activity.
Highlights
- Sound power measurements of a drone have been used to generate environmental noise maps for likely operating conditions and flight paths in a suburban setting
- High altitudes should be maintained for as long as possible, along with high landing and take-off velocities to best mitigate noise emissions at nearby residential buildings.
- Commercial implementations of ISO 9613 are found to be suitable for prediction of noise emission stemming from drone usage.
- The need for legislation surrounding noise emission by commercial drones was demonstrated, and the maximum number of fly overs per day was determined for each of the three flight paths tested.
1. Introduction
Drone usage has become widespread in recent years due to their range of applications from aerial photography, construction, and package delivery systems. Companies such as Amazon and Alphabet have begun trials using drones to deliver packages to their customers [1, 2] and pharmacies have trialed medication delivery using drones as well [3]. This comes with many advantages such as smaller waiting times for deliveries, and less Carbon dioxide emissions than conventional delivery methods. However, there is likely to be an increase in environmental noise, which could cause annoyance among residents living under/near regularly used flight paths [4]. A study by Airbus found that noise is one of the top concerns among the public in relation to increased drone usage [5]. It has been suggested that in environments with less road traffic, the annoyance of drone noise is significantly higher [6]. According to the World Health Organization, noise is a “growing concern” and has been linked with hearing loss, cognitive impairment, and cardiovascular disease [7].
Due to the serious nature of the possible adverse effects of noise exposure, it is important to understand drone noise and the expected levels of drone noise people may be exposed to. However, as of February 2021, there are no internationally adhered to regulations regarding noise emission from drones [8]. The International Civil Aviation Organization (ICAO) have discussed the possibility of future problems stemming from drone noise, stating “as new products and aircraft come into use, it may become apparent that additional noise and emission standards are necessary” [9]. The EU commission has recently implemented regulations for drone noise emission in the commission delegated regulations and the commission implementing regulations. [10, 11]. This regulation introduces the testing standards for determining the noise level of different classes of drones, as well as setting maximum sound power levels that have been allocated to certain classes of drone. Parts 13-15 of these regulations specifically addresses this. The method for determining the A-weighted sound power level for different classes of drones is discussed. The testing follows the ISO 3744:2010 standards. These regulations also describe the maximum allowable sound power level of the drone depending on its class and includes the requirements for a reduction in maximum sound power level from 2 years after the document came into force (1 July 2021), and from 4 years after the document came into force (1 July 2023). According to EU law, drones in the A2 class must maintain a minimum of 30 m horizontal distance from uninvolved people [12]. (This can be reduced to 5 m in ‘low speed’ mode. This may be unreasonable for take-offs/landings for package delivery purposes so may not be the case in the simulated models below). Australia is also beginning to introduce regulations for drone noise [8] and a review of the regulations was undertaken recently specifically to understand the need for drone noise regulations [13]. The review ended by recommending interim noise regulations specifically for commercial drones focusing on operations likely to have significant noise impacts (such as density of aircraft and location of operation) and a noise management framework that considers noise impacts during take-off and landing.
The development of noise regulations targeting drones by bodies such as the European Union suggests that it is likely that more regulations regarding drone noise will be established in other states as time progresses and more drones enter the skies. The purpose of this research is to understand the noise effects of different likely drone operating conditions and flight paths, and to determine possible mitigation measures to reduce the noise exposure experienced by people living near future ‘charging hubs’ and high-density flight paths, while also assessing the suitability of existing commercial software such as ‘iNoise’ to model noise emissions from drones.
2. Methodology
2.1. Technical calculation standards
The simulation is being carried out on commercial software iNoise. This software is targeted at “noise prediction for industry and wind turbines” [14]. It follows the calculation methods as set out in ISO 9613 parts 1 and 2 [15, 16]. Part one of ISO 9613 deals with sound attenuation due to atmospheric absorption, while part two deals with the general calculation method to predict the levels of environmental noise and equivalent continuous A-weighted sound pressure levels. Since the issue of drone noise is relatively new, there is no standardized software package that is used to calculate noise of this type. iNoise has been chosen as the modelling software due to its compliance with the ISO 17534 example problems for environmental noise calculation”.
2.2. Location selection
One of the key objectives of this project is to simulate a noise map of drone positions over an urban area using noise modelling software iNoise. Therefore, it was important to select a location that was both likely to see an increase in drone use and was simultaneously close to a residential zone. There were also technical issues to consider. Google Earth provides information on the dimensions in a plan view for most locations, heights where only available in selected areas that had been rendered in 3D. 3D renders were only available in the city centres and surrounding locations, where the density of houses or other residential buildings was lower, and the traffic noise was likely to be higher. Findings from Torija et al. [6] suggest that road traffic largely effects the public perception of drone noise. As this research aims to investigate the effect of drone noise rather than traffic noise, a quieter, suburban area would be better than a city centre location.
Donabate, Co. Dublin was chosen as the location as it is a quiet suburban town. Due to its various businesses, it is a likely hub for drone use in the future. The location contains a supermarket, coffee shops, pharmacies, and a restaurant. These are all businesses that could potentially employ drones to carry out deliveries in the future.
As it was not 3D rendered on Google Earth, building heights had to be manually measured. A laser measure (Wesco WS8910) was used. According to its technical data sheet, it has a measuring range of 0.3-40 meters with an accuracy of ±1.5 mm.
2.3. Sound Power Measurements
The drone used for physical testing was a HolyStone HS700 model. This model has 8 propellers, a MTOM of 630 g with dimensions of 434×434×151 mm. It has a flight time of 22 minutes on a full battery and has a maximum control range of 3280 ft (1000 m).
The sound power measurements were obtained by following the guidelines set by ISO 3744. [15].
Table B1 was used which allows the user to obtain the microphone positions. Positions 1-10 are considered the mandatory points which are needed to obtain a sound power measurement. Sound absorbing panels were used in the indoor tests to increase the acoustic performance of the room. A hemispherical measurement surface of radius of 1 m was chosen to comply with the requirements of the room and outdoor area. The LeQ (A) sound pressure level readings were obtained at the positions 1-10 using a Svantek 971 sound level meter. These sound pressure levels can then be converted to sound power level using Eq. (1):
where is the average sound pressure level and can be translated to , where is the chosen radius.
A reference sound source was used to obtain an estimate of uncertainty in the procedure. The reference source has a known output which can validate the experimental values. The RSS used is the Acculab RSS-101, which is designed according to ISO 6926 [17] and ANSI S12.5.
3. Results
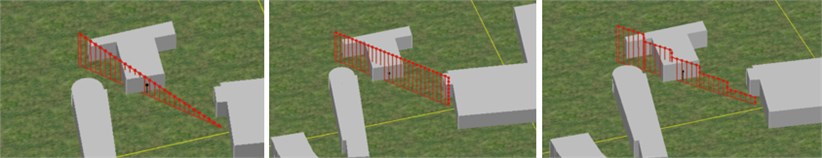
Three different Landing/Take off paths were analyzed in this research. Flight path 1 (FP1) was a uniform descent rate to the ground. Flight path 2 (FP2) included flight at a constant altitude and a vertical descent to the ground, while flight path 3 (FP3) included descending in a step profile. A graphic of the three can be seen in Fig. 1. Several models were created, each of different altitudes. The models in this paper each had an altitude of 14 metres (as measured directly over the receiver position, so to clear the heights of surrounding buildings.). One of the aims of this project was to determine the approach that will cause the least amount of noise exposure at the closest residential building. The value was recorded here at a height of 4 metres from the ground, at the most exposed façade of the building (as per measurement standard used by the WHO while determining values [7]). The calculation method used by iNoise for moving sources like this involve calculating the SPL at discrete locations along the flight path for a given velocity. The formula used for this calculation is shown as Eq. (2):
where is the SPL, is the sound power level, is the distance from the source to the receiver and is the operating time correction, defined in Eq. (3):
where is the length of the route (m), is the number of movements, is the velocity (m/s), is the judging time (s) and is the number of point sources that the route has been divided into.
Fig. 1L-R: flight paths 1, 2, and 3
From these formulae, the three physical variables that will alter the noise exposure at the receiver are:
– Drone velocity.
– Drone altitude.
– Number of fly overs per period.
To keep the number of permitted flyovers high (as to increase the number of drone deliveries that can be carried out) the landing velocity and flight altitude should be maximised. The velocity was varied first. The day period was the one investigated as it was deemed to be the most likely to have the biggest increase in drone activity. The results of varying the velocity can be seen in Table 1, and in Figs. 2-3. It was assumed that flights occurred only during the day hours for the model. Background noise was measured at 57 dB(A). The results in table 1 show the total value and the of drone noise only (in brackets, with reference to 0 dB as the background noise). Sources were placed every 1.5 m along the flight path for each case.
Table 1Results of varying velocity
Velocity [Km/Hr] | Flight path | for 25 daytime flights [dB(A)] | for 50 daytime flights [dB(A)] | for 100 daytime flights [dB(A)] | for 150 daytime flights [dB(A)] | ||||
1 | FP1 | 57.4 | (45.3) | 57.6 | (48.2) | 58.1 | (51.3) | 58.5 | (53) |
FP2 | 57.3 | (44.0) | 57.5 | (47.1) | 57.9 | (50.1) | 58.2 | (51.8) | |
FP3 | 57.4 | (45.7) | 57.7 | (48.7) | 58.2 | (51.6) | 58.7 | (53.3) | |
10 | FP1 | 57.1 | (35.3) | 57.2 | (38.3) | 57.2 | (41.3) | 57.3 | (43) |
FP2 | 57.1 | (34.0) | 57.1 | (37.2) | 57.2 | (40.1) | 57.2 | (41.8) | |
FP3 | 57.1 | (35.7) | 57.2 | (38.7) | 57.2 | (41.7) | 57.3 | (43.3) | |
Fig. 2FP3, velocity 1 Km/Hr, 150 daytime flights
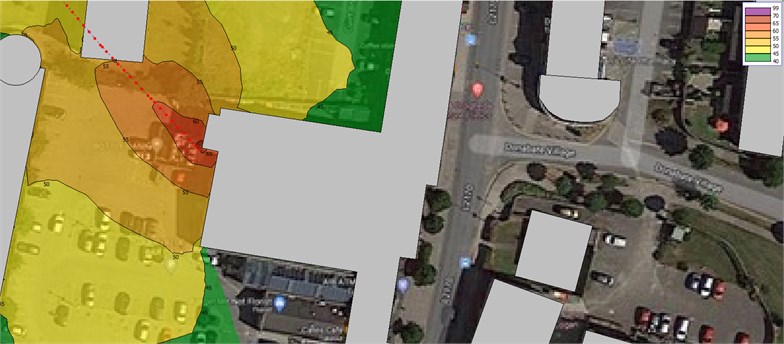
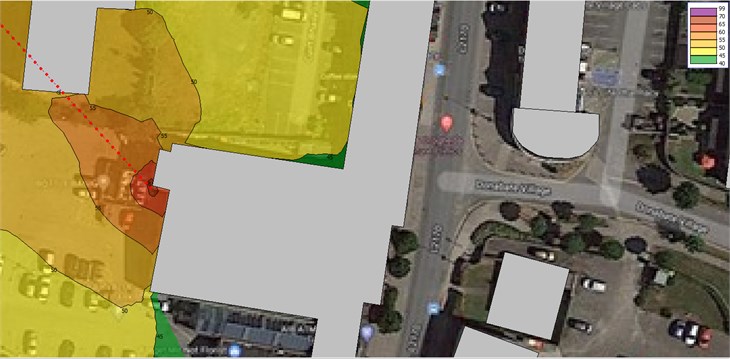
Fig. 3FP2, velocity 1 Km/Hr, 200 daytime flights
4. Conclusions
The results show in each case that the velocity of the drone impacts the noise exposure level at the residential building below the flight path. Increasing the velocity in each case caused a reduction in the value, suggesting that at higher velocities, the impact caused by noise can be reduced. Even with a high background noise level, the number of drones flying has a measurable effect on the measured value at the residential complex. The results also show that as the altitude of the drone across its flight path increases, the value at the residential complex decreases. Multiple simulations were carried out, each at a different altitude. Modelled altitudes started at a height of 10 metres above the receiver location (to clear all surrounding buildings). Models were then completed in intervals of 10 m up to a maximum of 30 m above the receiver location. The results shown in Table 1 each assume a 14 m altitude above the receiver position (10 m distance between receiver and drone). Each case demonstrates that the noise exposure at the residential complex below the flight path is reduced with a higher altitude. This cannot be increased indefinitely however as the drone will eventually reach a maximum altitude that it can still operate. Flying at very high altitudes may also not be suitable in certain locations, such as those near airports.
From the results shown in Table 1, FP2 performs best in all cases and is the only one of the three that does not exceed the WHO recommended maximum value for road traffic noise at 1 Km/Hr. These results also show that 150 flights per day is the maximum allowable number of flights for FP1 and FP3 assuming a 1 Km/Hr landing speed and a 14 m altitude above the measurement position (Fig. 2). This can be increased to 200 flights per day for FP2 assuming the same conditions (Fig. 3). For landing velocities of 10 Km/Hr (and the same altitudes as before), FP2 can have up to 2000 flights per day and remain under the recommended maximum for road traffic noise. FP1 and FP3 could maintain 1500 flights per day, while remaining under the WHO recommended maximum for road traffic noise.
All three flight paths exceeded the maximum recommended for aircraft noise at a velocity of 1 Km/hr. It must also be noted that the drone used in this model is a small quadcopter. Larger commercial drones are likely to have higher sound power levels and thus will need to choose a flight path that minimizes the effect of their noise at the buildings below their flight paths. Using the measured values for the Holystone HS700, an estimated breakdown of the future maximum allowable sound power level (81 dB for drones with a mass less than 900 g, as recorded in European legislation, coming into effect as of 1 July 2023) as a function of 1/3 octave bands could be established. Modelling the same scenarios as above using these numbers gives a maximum of 1530 flights for FP2 at 1 Km/Hr and a maximum of 15300 flights at 10 Km/Hr.
To achieve the best reduction in noise at the building, a combination of maintaining high altitude for as long as possible, along with a quick descent/ascent is the best takeoff/landing technique. The target maximum allowable sound power level as mentioned in EU legislation is a significant reduction in the noise levels emitted by the drone, however if they can be achieved, will allow for considerably more flights to take place.
From the results, iNoise can also be shown to be a reliable and easy to use software to model drone movements and noise emission. The calculation methods as set out in ISO 9613 parts 1 and 2 are followed, and the results are in line with what would be expected for a drone of this size and sound power level.
References
-
Wilke J. A drone program taking flight. About Amazon, 2019, https://www.aboutamazon.com/news/transportation/a-drone-program-taking-flight.
-
Wing, https://wing.com/.
-
Molloy D., Copestake J. Drone-to-door medicines trial takes flight in Ireland. BBC News, 2020, https://www.bbc.com/news/technology-52206660.
-
Watkins S., et al. Ten questions concerning the use of drones in urban environments. Building and Environment, Vol. 167, 2020, p. 106458.
-
Yedavalli P., Mooberry J. An Assessment of Public Perception of Urban Air Mobility (UAM). Airbus UTM: Defining Future Skies, 2019.
-
Torija A. J., Li Z., Self R. H. Effects of a hovering unmanned aerial vehicle on urban soundscapes perception. Transportation Research Part D: Transport and Environment, Vol. 78, 2020, p. 102195.
-
Environmental Noise Guidelines for the European Region. World Health Organization, 2018, WHO Regional office for Europe, Copenhagen, Denmark, 2021.
-
Noise Regulation for Remotely Piloted Aircraft (RPA) – Drones. Department of Infrastructure, Transport, Regional development and Communications, Australian Government, 2020.
-
Unmanned Aircraft Systems: UAS. International Civil Aviation Organization, Montréal, 2011.
-
Commission Implementing Regulation (EU) 2019/947 - of 24 May 2019 - On the Rules and Procedures for the Operation of Unmanned Aircraft. Official Journal of the European Union, 2019.
-
Commission Delegated Regulation (EU) 2020/1058 of 27 April 2020 amending Delegated Regulation (EU) 2019/945 As Regards the Introduction of Two New Unmanned Aircraft Systems Classes. Official Journal of the European Union, 2020.
-
EU Drone Regulations – Outline. Irish Aviation Authority, 2019.
-
Noise Regulation Review for Remotely Piloted Aircraft (RPA) and Specialised Aircraft. Department of Infrastructure, Transport, Regional development and Communications, Australian Government, 2020.
-
iNoise – Noise Prediction for Industry and Wind Turbines. DGMR Software, https://dgmrsoftware.com/products/inoise/.
-
ISO 9613-1:1993, Acoustics — Attenuation of Sound during Propagation Outdoors — Part 1: Calculation of the Absorption of Sound by the Atmosphere. ISO, 1993, https://www.iso.org/cms/render/live/en/sites/isoorg/contents/data/standard/01/74/17426.html.
-
ISO 9613-2:1996. Acoustics — Attenuation of sound during propagation outdoors — Part 2: General method of calculation. ISO, 1996, https://www.iso.org/cms/render/live/en/sites/isoorg/contents/data /standard/02/06/20649.html.
-
ISO 6926:2016, Acoustics — Requirements for the performance and calibration of reference sound sources used for the determination of sound power levels. ISO, 2016, https://www.iso.org/standard/42873.html.
Cited by
About this article

