Abstract
Rolling element bearing faults account for main causes of rotating machine failures. It is crucial to identify the incipient fault before the bearing steps into serious fault condition. The Hilbert envelope spectrum has been proved powerful and with high practical value to detect transient components in vibration signal but sensitive to noise. Based on the conventional singular value decomposition (SVD) theory, accumulative component kurtosis (ACK) is introduced to de-noising of vibration signal processing. The proposed ACK-SVD emphasizes the accumulative components (ACs) rather than the single singular component (SC) to select the effective SCs to recover signal. The superiority of the ACK-SVD over traditional SVD de-noising is verified by both simulated signals and actual vibration data from two rolling element bearing rigs. The results demonstrate the proposed method can efficiently identify the rolling element bearing faults, especially the early ones with strong background noise.
1. Introduction
Rolling element bearings (REBs) are critical mechanical components in rotating machinery with extensively application fields especially in modern industrial areas and their working state directly affects the performance of the whole machinery and the production efficiency. Compared to other components used in modern rotating machinery, REBs failures account for approximately 45 % of the machine breakdowns [1, 2] and moreover, the REBs-related faults lead to the 40 % among the most failures in induction motors according to failure surveys by the electric power research institute [3] (EPRI). Consequently, it has practical value to implement condition-monitoring and fault-diagnosis to REBs in case of machine shutdowns, as well as the economic losses and industrial casualties.
Among the variety of methods developed for rotating machinery fault diagnosis, signal processing technique based on the vibration signals is commonly used for the fault detection as the vibration signals carry the very important information about anomalies caused internally in the structure of the machinery. There are two steps commonly accepted to achieve the fault diagnosis and detection: (1) fault feature extraction and (2) identification of the fault pattern. The former step is vital to the whole process because it affects not only the complexity but also the accuracy of the fault diagnosis [4]. Addressing the fault feature extraction, different to the traditional analysis method such as time-domain statistics index, FFT analysis, the advanced and effective strategies have been proposed in the past decades, including Wavelet Transform (WT) [5-7], spectral kurtosis [8, 9], empirical mode decomposition (EMD) [10-12], minimum entropy deconvolution [13, 14], and stochastic resonance [15, 16]. WT can decompose and reconstruct signals via extending or compressing the wavelet basis, and it can perform the time-frequency characteristics of the signal with variable resolution, but the appropriate selection of mother wavelet depends on the researchers’ empirical experience, the signal itself, and the parameters to preset. Moreover, the WT will lose the self-adaptability at different scales once the wavelet base is selected [17]. EMD can perform the intrinsic mode function (IMF) components extraction from the complex multi-component signal adaptively. With the aid of Hilbert transform applied to the IMFs, the signal’s integrity of time-frequency distribution can be achieved. However, there are still some problems unsolved, mode-mixing, endpoint effect and the lack of theoretical background in details.
SVD is a non-parametric signal analysis tool which can be implemented without pre-defined basis functions. Additionally, SVD is considerably fast-calculating, easier-applicable comparing with other signal processing techniques. Owing to the above merits, SVD has been applied not only signal de-noising but also the fault feature extraction. Reza Golafshan improves the SVD reliability to the fault detection process by eliminating the background noise and the effectively selecting of singular value (SV) with probable highest kurtosis [18]. Different to the work in ref [12], where Yu D. et al. combines the EMD with Hilbert transform together to propose the local marginal spectrum which is verified effective in fault diagnosis of rolling bearings by practical vibration signals, SVD has been applied to feature matrix formed by the IMFs and residue from EMD process, the SVs forms the feature vectors based on which the Mahalanobis distance to the normal state can be calculated to measure the fault condition of rolling bearings [19], while, the SVD has been also used to form the condition feature vectors on the product function obtained by local mean decomposition (LMD) to vibration signals [20].
In a word, the key of SVD-based de-noising methods is commonly to find an appropriate threshold to select the sensitive SVs and their corresponding SCs which are used to reconstruct a matrix with lower rank for the processing subsequently. The current methods always attach importance to the fact that the significant SVs indicate their corresponding SCs dominant in the signal. From this view, many schemes selecting the sensitive SVs has been put forward such as the difference spectrum of singular values (DSSV), the ratios of neighboring singular values (NSVRs), and another novel method to select the sensitive components is to estimate some index indicated by each SC [21]. The basic principle of the kurtogram [22] is to use the kurtosis as a measure to detect the presence of impulse components and to indicate the frequency band where these occur, inspired by this method and the significance of kurtosis, ACK is proposed to estimate the impact of each single SC to the final recovered signal by the kurtosis index, the detailed flow chart is shown in Fig. 3. Envelope spectrum is one of the extensive applied techniques [23] in academic research and engineering applications to extract the fault-induced frequency but sensitive to the noise contained in the acquired vibration signal, consequently, the envelope spectrum is applied to evaluate the performance of ACK-SVD. The simulation and experimental results demonstrate the effectiveness in the fault diagnosis of rolling element bearing compared the traditional method DSSV, which proves a remarkable improvement of SVD in early incipient faults of rotating machinery.
The remainder of this paper is organized as follows. Section 2 reviews the principle of SVD based de-noising, as well as limitations. Subsequently, the accumulative component kurtosis (ACK) based SVD is proposed to signal de-nosing. The effectiveness of the proposed method is verified by simulation study and experiments in Section 3 and 4, respectively. Finally, conclusions are drawn in Section 5.
2. Principle of SVD and application to the signal de-noising
2.1. Principle of SVD
The SVD is a matrix factorization method from the mathematical view, and its definition is, for a matrix , there exist two orthogonal matrices: and , which satisfy the following equation:
where or its transposition, which is decided by whether or . , is zero matrix, and . These parameters (1, 2,…, ) are defined SVs of , and .
2.2. The implement of SVD based de-noising to vibration signal
The mechanical fault vibration signal presents itself a series of impulses resulting from contact between the fault component and the health one, typically the case of spall faults, cracks or excessive gap in gears or rolling element bearings. While the raw signal collected from actual working situation may contain the machine noise which is supposed to be stationary or white Gaussian noise. Hence, the essential distinction between the background noise and the fault induced periodic impulses results in the difference of Hankel matrix, in turn, the SVs. Based on the state above, the SVD based de-noising methods seek decorrelating data space in terms of a set of new data variables which are mutually orthogonal and optimize certain statistical measures such as SVs. The data space redefined by these new variables is called the feature space which is a lower dimension space relative to the original one, and this property usually is called dimension reduction [24]. The transformation from data space to feature space hopefully brings greater separation between the signal and the noise.
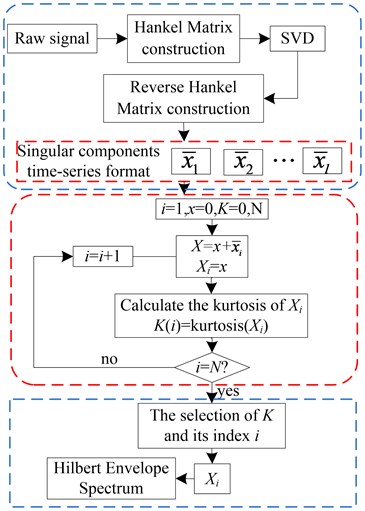
The vibration signals collected from the REBs housing are usually time-series data, it could not be subjected to the SVD techniques directly as the SVD is always applied to the matrix analysis, consequently, it is a necessary pretreatment to transform the one-dimensional signal to matrix before applying the SVD techniques, and Hankel matrix is commonly used and convinced an effectively method [24]. The dimension reduction makes the SVD a useful tool for de-noising of vibration signals which consisted of three main steps mentioned later and the SVD based de-noising flow chart shown in Fig. 2.
Step 1: transform of time-series vibration signal to matrix.
The measured signal in practice is a time-series signal and its Hankel matrix is shown in Eq. (2):
where , , and is a constant integer, the key parameter called delay step in the reconstruction of Hankel matrix; the . The delay step always is 1, and could be three times the number of components in the raw signal [25, 26].
Step 2: SVD implementation.
According to Eq. (4), the Hankel matrix can be decomposed into sub-matrix which satisfies the Eq. (3), and in the form shown in Eq. (4):
where is the th column vector of left singular matrix , , is the th column vector of right singular matrix . Actually, the every sub-matrix in Eq. (4) corresponds to a (SC) in the raw signal.
Step 3: Reverse Hankel construction.
According to the construction of Hankel matrix shown in Eq. (2), the in the raw signal can be obtained by the first row vector combined the last column vector without the first element of the Hankel matrix depicted in the Fig. 1. By comparison, another reconsitution method named diagonal averaging is more reasonable to obtain each element by averaging along the anti-diagonals of the corresponding shown in Ref. [21, 27]. Both methods derived from the principle of Hankel matrix demonstrate that the raw signal can be reconstructed perfectly if all the SCs are added together. Accordingly, shown in the Fig. 2, there are two different ways to transform the SCs into the time-series signal which depend on the reverse Hankel construction implement to the SCs in Hankel matrix or their matrix sum, the method I is adopted in present work.
Fig. 1The transformation from Xi to xi in the raw signal
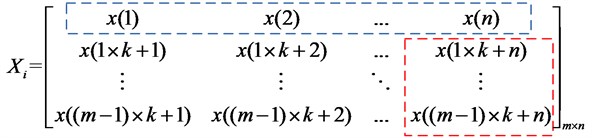
Fig. 2The flow chart of the SVD based de-noising

2.3. The ACK SVD de-noising method
The crucial step in the SVD based de-noising method is to find the appropriate subspace spanned by the periodic impulses signal from the space by the raw vibration signal. Moreover, the related research almost focus on the SVs or their extensions such as DSSV, mean value of SVs and CCSVD, while, the recovered signal is often neglected. Hence, the ACK is proposed to efficiently select the effective SCs to constitute the de-noised signal.
Specifically, the ACK-SVD is firstly to decompose the raw vibration signal into series of SCs in time-series format by the method I mentioned in Fig. 2, which is the same as the traditional SVD based de-noising. Then, the SCs is added together one by one to recover the which represents the purified signal, the kurtosis of X is calculated and set to the variable ACK once a new SC is added. Lastly, the maximum of ACK is sought out or the relative difference of ACKs is less than a certain level, the singular order can be obtained, then is the desired purified signal. Additionally, the relative difference is defined as the Eq. (5). The processed signal is then fed into Hilbert envelope analysis to investigate fault information indicated by the vibration signal:
Fig. 3The flow chart of ACK
3. Simulation validation
3.1. Vibration model for rolling element bearing
To highlight the advantages of the proposed method, simulated signals are generated according to the fault mechanism [28]. When a local defect occurs on the contact surface between different components of a rolling element bearing, successive impulses produced by the contact of the defect zones may excite resonances in the bearing and the machine. The impulse response function of the bearing-housing-sensor system can be illustrated in Eq. (6):
where is the resonant frequency excited by defect impact, is the coefficient of resonance damping and is the phase. Considering the successive motion of the rolling elements, the simulated vibration signal can be written as Eq. (7):
The first part represents the displacement caused by the quiescent load and the rotating speed, where specifies the rotating frequency, the nominal time interval between two adjacent impulses, is random variable of the time lag between two impacts caused by the presence of slip which is an unpredictable behavior, the random usually accounts for 1-2 % of , and represent the amplitude due to the static load and the unbalance load of the rotator, respectively. The last part represents background noise and is referred to the Gaussian distributed white noise.
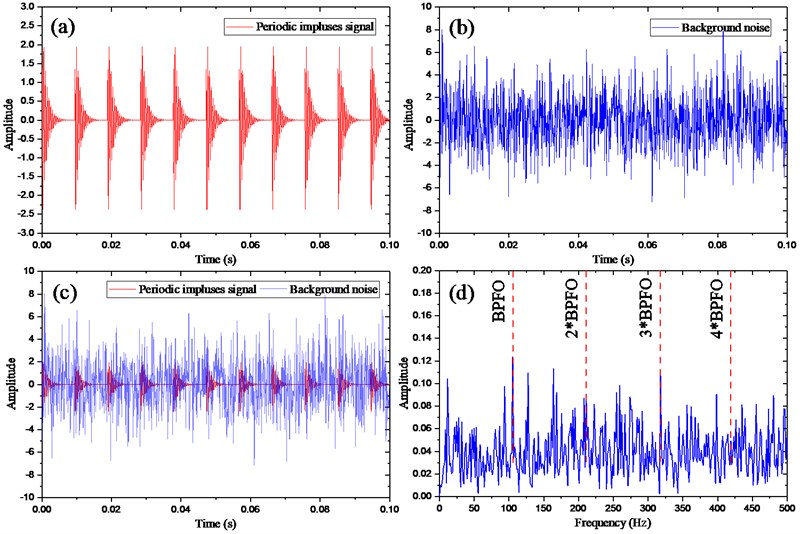
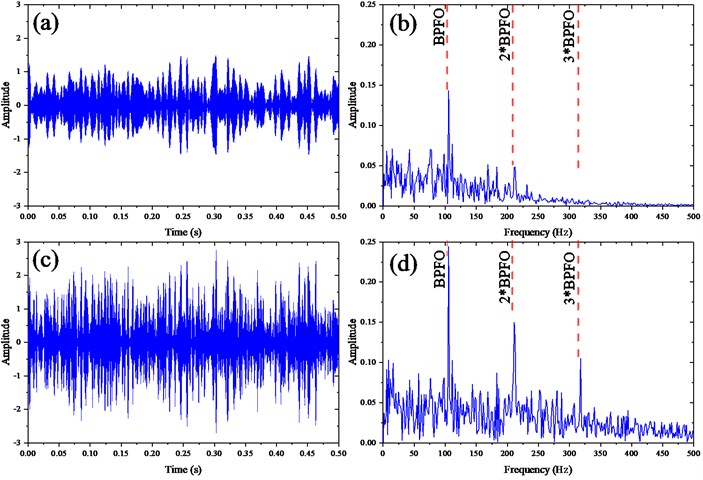
For the brief but rational simulation, this section discusses the localized defect on outer race whose fault characteristic frequency (i.e. BPFO) is 105.5 Hz, and 12 kHz of the sampling rate (i.e. ), 2 kHz of resonant frequency that excited by defect impact, and 0.1s of the data length, respectively. The rotating speed of the shaft with inner race is 1772 rpm. The last term is the Gaussian noise with SNR –7 dB. With the parameters mentioned above, the periodic impulses signal and the background noise are shown in Fig. 4(a) and (b), respectively; the mixed signal and its envelope spectrum in Fig. 4(c) and (d), respectively. Moreover, the Fig. 4(c), from which it is obvious that the periodic impulses completely buried by the heavy background noise, and its envelope spectrum presented in Fig. 4(d) provides little useful information about the fault.
Fig. 4Simulation signals of outer race defect: a) periodic impulse signal; b) the back noise signal; c) the mixed signal; d) the Hilbert envelope spectrum of the raw signal
3.2. The contrastive analysis between the ACK-SVD and DSSV
As mentioned in above section, the DSSV is often employed to select the effective SVs and the SCs furtherly. The mixed signal shown in Fig. 4(c) is subjected to conventional SVD technique to obtain the SV sequence, which is plot by the blue color and the difference spectrum of SV by the black one as shown in Fig. 5. According to DSSV principle, the first two SVs of relative high value are chosen as the effective ones and their corresponding SCs the efficient ones to the de-noising signal constructing. The ACK varies with the number of SC added together as shown in Fig. 6, the peak arises after the fifth SC added, which is consistent with the kurtosis maximum rule, then, the singular order is 5. Since the kurtosis is sensitive to the impulses signal, it is reasonable to say the former five SCs in time-series format have the common peaks and they strengthen each other leads to the growing of ACK. When later SCs containing the random background signal, they may weaken the peaks and strengthen the trough in the accumulative signal, in other word, the transient periodic impulses enhances when added together but the random noise keep unchanged due to the merit of Gaussian noise. Consequently, the kurtosis of the accumulative signal reduces or keeps little change as the more SCs are added. Based on the analysis above, the waveform of recovered signal by DSSV method is shown in Fig. 7(a) and its envelope spectrum in Fig. 7(b); meanwhile, the Fig. 7(c) displays the recovered signal by ACK-SVD and its envelope spectrum is shown in Fig. 7(d).
Fig. 5Singular values and the difference spectrum
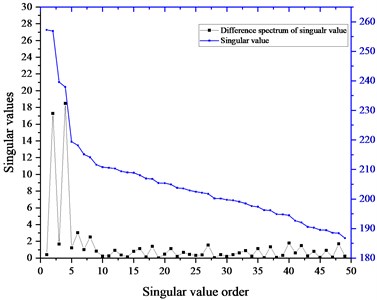
Fig. 6The accumulative component kurtosis
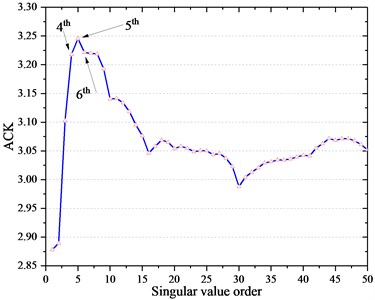
Fig. 7The waveforms by DSSV and ACK-SVD: a) the waveform of recovered signal by DSSV; b) the envelope spectrum of the signal in a); c) time-series format of recovered signal by ACK-SVD; d) the envelope spectrum of the signal in c)
From waveforms shown in the Fig. 7(a) and Fig. 7 (c), the signal recovered by ACK-SVD has relative high amplitude and more obvious impulses component than the one by DSSV. More to the point, the envelope spectrums presented in Fig. 7(b) and Fig. 7(d) illustrate the ACK-SVD’s superiority over the DSSV with more harmonic frequencies and higher amplitudes even though the presence of neglected background noise. Up to now, with the illustration based on the simulation, it is rational to demonstrate the ACK-SVD method can identify the fault-related frequencies with the aid of Hilbert envelope spectrum.
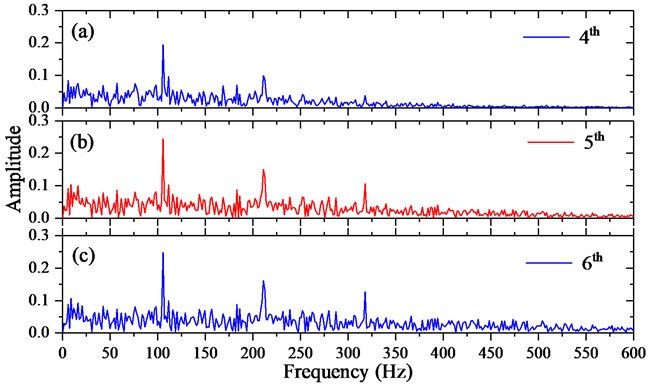
To state the accumulative singular component with relative high kurtosis carrying the clear fault-induced information, the 5th one who has the biggest kurtosis and its two neighbors named 4th and 6th have been presented in Fig. 8 labeled with a), b) and c), respectively, from which it’s not hard to conclude that the accumulative singular component with relative big kurtosis has relative larger amplitudes at each fault-induced frequencies that is easier to get the fault information in the presence of noise. Moreover, it proves the ACK-SVD efficient.
Fig. 8The envelope spectrum of maximum ACK and its near two one: a) envelope spectrum of the former four singular components; b) envelope spectrum of the former five singular components; c) envelope spectrum of the former six singular components
4. Experimental verification
To investigate the effectiveness of the proposed ACK-SVD method for weak signal extraction, two experimental cases are taken into account including bearing signals with slight defect seeded artificially and an early outer race defect resulting from the natural degradation of fault.
4.1. Case 1: bearing fault signals with slight defect on inner race
4.1.1. The experiment setup of bearing fault test
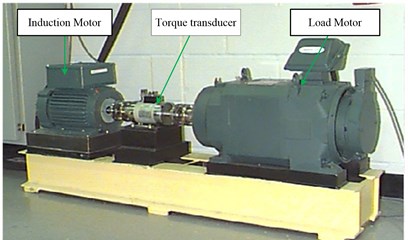
As shown in the Fig. 9, the bearing test rig is constituted of a 2 HP induction motor, a load motor and a torque transducer. The induction motor drives the shaft of the torque transducer coupled with the shaft of load motor which provides the working load to the test bearing. The defect diameters ranging from 0.007 to 0.040 inches at inner raceway, rolling element (i.e. ball) and outer raceway of the induction motor bearings were introduced by electro-discharge machining (EDM) separately. After faults seeded, fault bearings were reinstalled into the induction motor and the vibration data was collected by acceleration sensors under loads ranging from 0 to 3 HP and the rotating speed from to 1797 to 1720 rpm. The accelerometers were attached to the housing with magnetic bases to acquire vibration data at the sampling frequency 12 kHz.
A vibration signal with slight defect on the inner raceway surface was obtained from the Case Western Reserve University (CWRU) Bearing Data Centre Website [29]. The structural parameters and detailed information of the tested bearing with inner raceway defect are listed in Table 1 and Table 2, respectively.
Table 1The structural parameters of the tested bearing
Inside diameter (mm) | Outside diameter (mm) | Thickness (mm) | Ball diameter (mm) | Pitch diameter (mm) |
25 | 52 | 15 | 8.1818 | 44.2 |
Table 2Detailed fault information of the test bearing
Defect location | (D×W) (in.) | Rotating speed (RPM) | (Hz) | (Hz) | (Hz) | (Hz) |
Inner raceway | 0.011×0.007 | 1772 | 11.76 | 139.2 | 159.9 | 105.87 |
Fig. 9The bearing test rig
4.1.2. Experiment result analysis
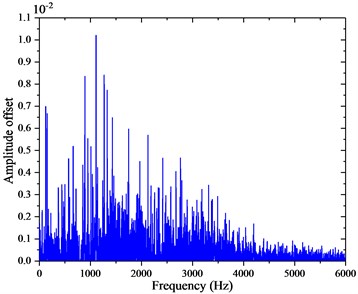
As signal in time-domain could reflect the vibration characteristic to some extent, the waveform of the slight defect on the inner raceway is shown in Fig. 10(a), from which the obvious transient impulses indicate the fault state of the bearing and from its corresponding envelope shown in Fig. 10(b), the failure is confirmed to be the inner raceway defect further. Moreover, the signal in Fig. 10(a) is fed into ACK-SVD to obtained the de-noised signal presented in Fig. 10(c), from waveforms depicted in Fig. 10(a) and Fig. 10(c), it is difficult to tell the differences between the origin signal and the de-noised one as same as the envelop spectrums shown in Fig. 10(b) and Fig. 10(d), respectively. The difference is further demonstrated by the absolute deviations of envelop amplitudes depicted in Fig. 11 which is so small that could be overlooked. In addition, the rotating frequency 29.3 Hz and the double rotating frequency 58.6 Hz along with defective frequency 159.7 Hz, second harmonic 319.4 Hz and third harmonic 479.1 Hz are clearly observed both in Fig. 10(b) and Fig. 10(d), which further indicates the ACK-SVD effective in the fault detection.
Fig. 10Vibration signal with slight defect on inner raceway: a) waveform in time domain and its corresponding spectrum in b); c) waveform in time domain under ACK-SVD and its corresponding spectrum in d)
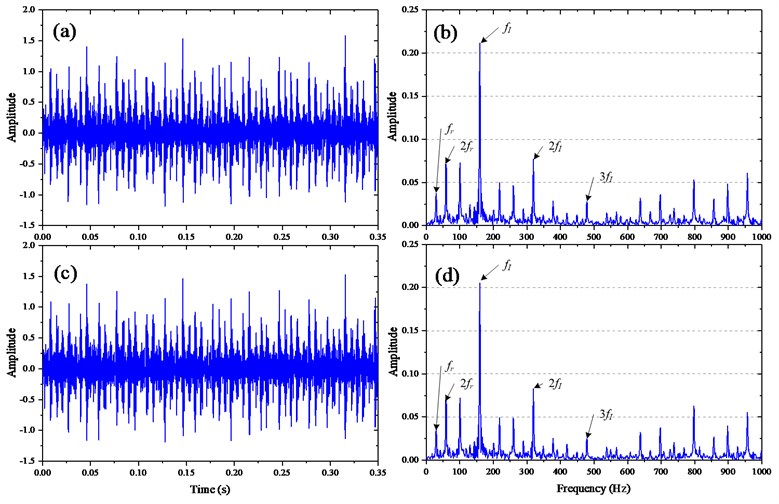
Fig. 11The absolute amplitude deviations in frequency domain.
The detailed analysis above validates the proposed ACK-SVD in the bearing fault detection with slight defect seeded artificially, and the ACK-SVD performance does accord with DSSV with the negligible error. However, as the same to the most bearing fault detection researches [30-32] which pay attention to the mature faults with a relative high vibration root mean square (RMS) and apparent transient impulses in waveform which make it easier to identify faults, the artificial seeded defect cannot reflect the degradation and propagation of the initial fault whose occurrence is crucial to the bearing condition monitoring and fault detection. Therefore, it is necessary to investigate the effectiveness of the ACK-SVD especially in the early period of defect where the transient impulse is so weak that is submerged in the background noise. In the next section, the ACK-SVD and conventional SVD were applied to the incipient fault vibration signals from an accelerated bearing life test and their performances were evaluated by time and frequency domain.
4.2. Case 2: Accelerating experiment of bearing
4.2.1. Experiment setup
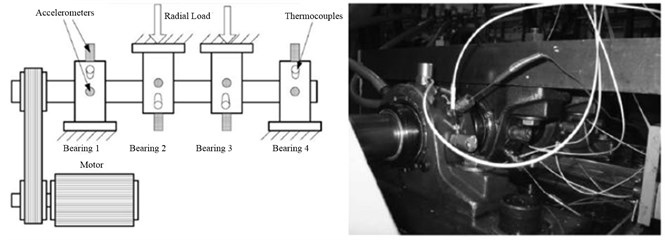
For the purpose to demonstrating the ACK-SVD method effective, a bearing run-to-failure experiment of the detecting the rolling bearing outer race fault was conducted. As shown in Fig. 12, the four Rexnord ZA-2115 bearings were installed on the shaft with rotational speed 2000 rpm which was driven by motor through rub belts, each bearing was equipped by two accelerometers from x and y direction, and the radials load with 2.7 KN was applied to the bearing 2 and 3. The test bearing was double rows with 16 rollers in each one, a pitch diameter of 2.815 in, roller diameter of 0.331 in, and the tapered contact angle of 15.17°. Eight vibration sensors could synchronously collect the vibration signal with the data acquisition of a National Instruments DAQ Card-6062E at the sampling rate 20 kHz and data length is 20480 points. With an oil circulation system regulating the flow and temperature of the lubricant by which all the bearings are forced lubricated, the test could be switch down if the magnetic adhering the wearing or fault-induced debris in oil circulation or the temperature exceeded a certain level.
According to the paper [7], the outer race ball pass frequency (BPFO) of test bearing can be obtained by Eq. (7) with the structural and kinematical parameters of the experiment bearing mentioned before:
where is number of balls, is the diameter of the rolling element, is the groove section size, is the contact angle, and is the shaft rotating frequency.
Fig. 12Bearing test rig and sensor locations
4.2.2. The experiment results analysis
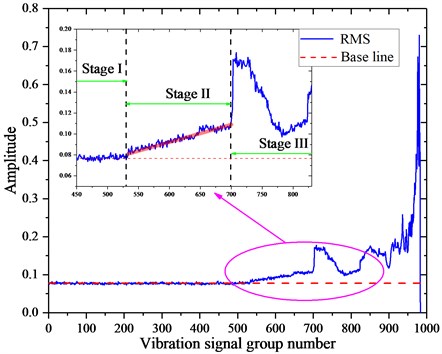
The vibration data set with run-to-failure process collected from February 12, 2004 10:32:39 to February 19, 2004 06:22:19 was employed here for further analysis. At the end of the test, outer race failure occurred in bearing 1, and RMS values of the entire life cycle were applied to describe the degradation process of the bearing 1 shown in Fig. 13, which indicated the degradation process of bearing could be divided into three stages, moreover, the base line shown in Fig. 13 was calculated by the average of RMS values with group number from 0 to 400, where the REB was in normal working state. The RMS almost keeps little change for a relative long period in stage I where the normal vibration comes mainly from the bearing inherent characteristic resulting from the wearing; since the occurrence of the defect, the RMS increases little proportionally until stepping into stage II where the small spall or cracks expands and later is smoothed by the excessive rolling depression which accounts for the RMS fluctuating, but the average value of RMS is higher than the one in the stage I. At the stage III, the RMS grows exponentially to an extensively high level where the spall or the cracks expand seriously. From the analysis above, the bearing status in the stage III is so extensively urgent that other components could suffer abnormal vibration which may lead to worse situation any time, even the unpredictable accidents. This means it necessity to alarm if the bearing condition steps into stage III, leaving enough response time for the maintenance personnel to take action prior to catastrophic failures. Furthermore, the stage II should be labeled as the incipient period due to the linear predictability and appropriate vibration intensity level of RMS. It should be pointed out that the RMS grows to a very high level suddenly at the end of the stage II, the burst in RMS indicates the rolling element bearing’ health deteriorates seriously. All in all, as the fault detection in early stage is very crucial to the condition monitoring, the stage II should be highly emphasized.
Fig. 13The run-to-failure RMS of bearing 1
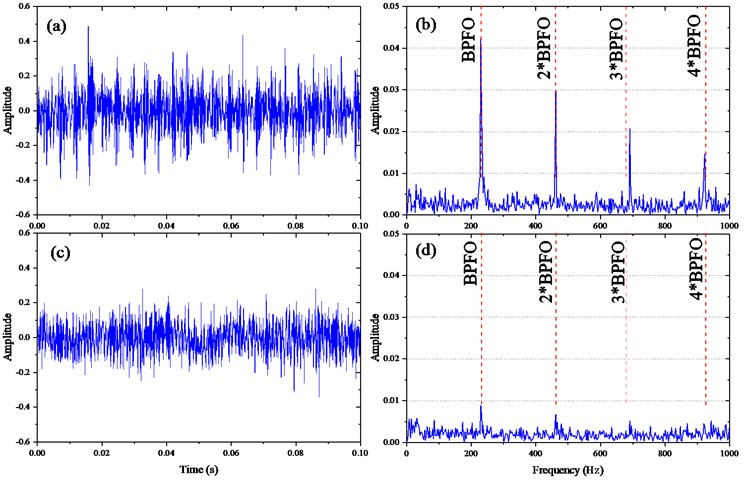
The waveforms and envelope spectrums of vibration signals collected at the start and the end point of the stage II were presented in Fig. 14, specifically, Fig. 14(a) and (c) indicate that the transient impulses are more apparent as the RMS growing, which results from the amplitude of fault-induced impulses is higher than the one of background noise and this trend becomes more apparent as the bearing fault degrades. Meanwhile, the Fig. 14(b) and (d) show the envelope spectrums of the signals from Fig. 14(a) and (c), respectively, which present defective frequency and its harmonics at the end of stage II are clearly observed and relative higher than the start of stage II. Based on the analysis above, it is reasonable that the vibration signal shown in Fig. 14(c) serves as the incipient fault signal and should be subjected to further analysis.
Fig. 14The vibration signals with different time: a) the waveform with a serious defect at the end of stage II and its envelope spectrum in b); c) the waveform with a slight defect at the start of stage II and its envelope spectrum in d)
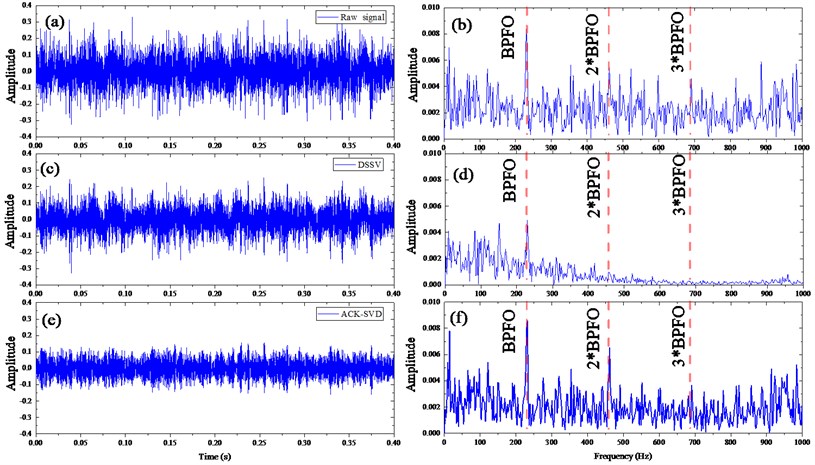
The incipient fault signal is subject to the SVD techniques to obtain the SVs and the difference spectrums presented in Fig. 15. As the principle of conventional SVD, the first four singular components are taken to recover the de-noised signal whose waveform and envelope spectrum are depicted in Fig. 17(c) and (d), respectively. Based on the ACK-SVD method, the ACK index changes as shown in Fig. 16 from which we can see the ACK grows largely to a level and remains slight fluctuation due to the more information but less noise components carried by the former singular components and less information but more background noise the later ones. While, the relative difference parameter e in the Eq. (5) is 0.24 % when the 13th SC is added, the value of is so small that the ACK remains static or little change while more SCs are added together, moreover, the trend of ACK varies with ignorable changes after the order 13. Hence the first 13 SCs are chosen to represent the purified signal. The Fig. 17(a) and (b) show the waveforms without process and their envelope spectrums, Fig. 17(c) and (d) with the DSSV principle and Fig. 17(e) and (f) with the ACK-SVD method applying 13 as the value of singular order .
The waveforms in Fig. 17(a), (c) and (e) manifest little information about the fault except that the unprocessed vibration signal indicates transient peaks as well as the one processed by conventional SVD, but the envelope spectrums show that the signal with conventional SVD lose some vital information to confirm the fault compared with the unprocessed signal. Moreover, the waveform obtained by ACK-SVD has relative small amplitude which makes itself more like normal vibration signal, however, its envelope spectrum shown in Fig. 17(f) manifesting the clearer fault characteristic frequency and its harmonics which makes it efficient for fault diagnosis in spite of the presence of background noise. Overall, the proposed ACK-SVD method has better fault detection ability of the incipient fault of rolling element bearings.
Fig. 15Difference spectrum of singular values of real vibration signal
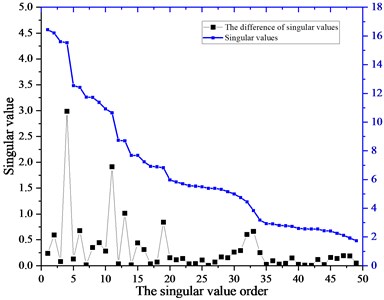
Fig. 16The kurtosis values of the accumulative singular components
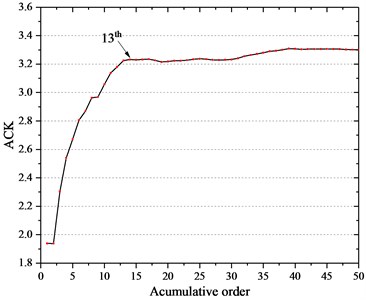
Fig. 17Vibration signal of rolling element bearing early fault and their envelope spectrums: a) the waveform without process of incipient fault and its envelope spectrum in b); waveform with conventional SVD of incipient fault in c) and its envelope spectrum in d); waveform with ACK-SVD in e) and its envelope spectrum in f)
5. Conclusions
In this paper, the ACK-SVD method is put forward to the mechanical vibration signal de-noising. Unlike the existing SVD methods, a new index based on the kurtosis is applied to evaluate the effect of each single singular component to the recovered signal, which can efficiently reduce the noise. The effectiveness of the proposed ACK-SVD method is demonstrated by the simulated and experimental vibration signal. Results show that the proposed method can successfully detect the fault of rolling bearings, especially the incipient one. The main contributions of the proposed strategy include:
1) A novel index named accumulative component kurtosis (ACK) is raised to evaluate the effect of singular components to the recovered one. The appropriate selection of the sensitive singular component is conducted according to the ACK.
2) ACK-SVD has the superiority to detection the fault characteristic frequencies over the conventional SVD in the fault early stage, which is vital to the incipient fault diagnosis.
3) As the ACK-SVD algorithm is almost based on the matrix calculation, it is supposed to be efficient in time-consumption, which has high value in the online monitoring or real-time detection of defects.
In this preliminary study, the proposed method was tested and demonstrated to be effective to do fault diagnosis of rolling element bearing. As to the engineering application value, the ACK-SVD method should be applied to adequate practical cases to prove.
References
-
Nandi S., Toliyat H. A., Xiaodong L. Condition monitoring and fault diagnosis of electrical motors - a review. IEEE Transactions on Energy Conversion, Vol. 20, 2005, p. 719-729.
-
William P. E., Hoffman M. W. Identification of bearing faults using time domain zero-crossings. Mechanical Systems and Signal Processing, Vol. 25, 2011, p. 3078-3088.
-
Bellini A., Filippetti F., Tassoni C., Capolino G. A. Advances in diagnostic techniques for induction machines. IEEE Transactions on Industrial Electronics, Vol. 55, 2008, p. 4109-4126.
-
Zhao H., Sun M., Deng W., et al. A new feature extraction method based on EEMD and multi-scale fuzzy entropy for motor bearing. Entropy, Vol. 19, 2016, p. 14.
-
Liu Z., Cao H., Chen X., et al. Multi-fault classification based on wavelet SVM with PSO algorithm to analyze vibration signals from rolling element bearings. Neurocomputing, Vol. 99, 2013, p. 399-410.
-
Wang T., Liang M., Li J., et al. Rolling element bearing fault diagnosis via fault characteristic order (FCO) analysis. Mechanical Systems and Signal Processing, Vol. 45, Issue 1, 2014, p. 139-153.
-
Wang Y., Xu G., Liang L., et al. Detection of weak transient signals based on wavelet packet transform and manifold learning for rolling element bearing fault diagnosis. Mechanical Systems and Signal Processing, Vol. 54, 2015, p. 259-276.
-
He D., Wang X., Li S., et al. Identification of multiple faults in rotating machinery based on minimum entropy deconvolution combined with spectral kurtosis. Mechanical Systems and Signal Processing, Vol. 81, 2016, p. 235-249.
-
Leite V. C. M. N., Da Silva J. G. B., Veloso G. F. C., et al. Detection of localized bearing faults in induction machines by spectral kurtosis and envelope analysis of stator current. IEEE Transactions on Industrial Electronics, Vol. 62, Issue 3, 2015, p. 1855-1865.
-
Wang H., Chen J., Dong G. Feature extraction of rolling bearing’s early weak fault based on EEMD and tunable Q-factor wavelet transform. Mechanical Systems and Signal Processing, Vol. 48, Issue 1, 2014, p. 103-119.
-
Lei Y., Lin J., He Z., et al. A review on empirical mode decomposition in fault diagnosis of rotating machinery. Mechanical Systems and Signal Processing, Vol. 35, Issue 1, 2013, p. 108-126.
-
Yu D., Cheng J., Yang Y. Application of EMD method and Hilbert spectrum to the fault diagnosis of roller bearings. Mechanical Systems and Signal Processing, Vol. 19, Issue 2, 2005, p. 259-270.
-
Song W., Li M., Liang J. K. Prediction of bearing fault using fractional Brownian motion and minimum entropy deconvolution. Entropy, Vol. 18, Issue 11, 2016, p. 418.
-
Gao Y., Villecco F., Li M., et al. Multi-scale permutation entropy based on improved LMD and HMM for rolling bearing diagnosis. Entropy, Vol. 19, 2017, p. 176.
-
Wang J., He Q., Kong F. Adaptive multi-scale noise tuning stochastic resonance for health diagnosis of rolling element bearings. IEEE Transactions on Instrumentation and Measurement, Vol. 64, Issue 2, 2015, p. 564-577.
-
Lu S., He Q., Kong F. Stochastic resonance with Woods-Saxon potential for rolling element bearing fault diagnosis. Mechanical Systems and Signal Processing, Vol. 45, Issue 2, 2014, p. 488-503.
-
Li T., Xu M., Wei Y., Huang W. A new rolling bearing fault diagnosis method based on multi-scale permutation entropy and improved support vector machine based binary tree. Measurement, Vol. 77, 2016, p. 80-94.
-
Golafshan R., Sanliturk K. Y. SVD and Hankel matrix based de-noising approach for ball bearing fault detection and its assessment using artificial faults. Mechanical Systems and Signal Processing, Vol. 70, 2016, p. 36-50.
-
Wang Z., Lu C., Wang Z., et al. Fault diagnosis and health assessment for bearings using the Mahalanobis-Taguchi system based on EMD-SVD. Transactions of the Institute of Measurement and Control, Vol. 35, Issue 6, 2013, p. 798-807.
-
Tian Y., Ma J., Lu C., et al. Rolling bearing fault diagnosis under variable conditions using LMD-SVD and extreme learning machine. Mechanism and Machine Theory, Vol. 90, 2015, p. 175-186.
-
Zhao M., Jia X. A novel strategy for signal denoising using reweighted SVD and its applications to weak fault feature enhancement of rotating machinery. Mechanical Systems and Signal Processing, Vol. 94, 2017, p. 129-147.
-
Wang Y., Xiang J., Markert R., et al. Spectral kurtosis for fault detection, diagnosis and prognostics of rotating machines: A review with applications. Mechanical Systems and Signal Processing, Vol. 66, 2016, p. 679-698.
-
Li Y., Xu M., Liang X., et al. Application of bandwidth EMD and adaptive multi-scale morphology analysis for incipient fault diagnosis of rolling bearings. IEEE Transactions on Industrial Electronics, Vol. 64, Issue 8, 2017, p. 6506-6517.
-
Rungpitaxmana S., Chaturantabut S. Dimension reduction for systems with parametrized boundaries for Fisher’s equation. AIP Conference Proceedings, Vol. 1790, Issue 1, 2016, p. 150023.
-
Zhao X., Ye B. Selection of effective singular values using difference spectrum and its application to fault diagnosis of headstock. Mechanical Systems and Signal Processing, Vol. 25, Issue 5, 2011, p. 1617-1631.
-
Xu X., Zhao M., Lin J. Detecting weak position fluctuations from encoder signal using singular spectrum analysis. ISA Transactions, Vol. 71, 2017, p. 440-447.
-
Muruganatham B., Sanjith M. A., Krishnakumar B., et al. Roller element bearing fault diagnosis using singular spectrum analysis. Mechanical Systems and Signal Processing, Vol. 35, Issue 1, 2013, p. 150-166.
-
Cong F., Chen J., Dong G., et al. Vibration model of rolling element bearings in a rotor-bearing system for fault diagnosis. Journal of Sound and Vibration, Vol. 332, Issue 8, 2013, p. 2081-2097.
-
Case Western Reserve University Bearing Data Center, http://csegroups.case.edu /bearingdatacenter/home.
-
Safizadeh M. S., Latifi S. K. Using multi-sensor data fusion for vibration fault diagnosis of rolling element bearings by accelerometer and load cell. Information Fusion, Vol. 18, 2014, p. 1-8.
-
Zhang X., Zhou J. Multi-fault diagnosis for rolling element bearings based on ensemble empirical mode decomposition and optimized support vector machines. Mechanical Systems and Signal Processing, Vol. 41, Issue 1, 2013, p. 127-140.
-
Laha S. K. Enhancement of fault diagnosis of rolling element bearing using maximum kurtosis fast nonlocal means denoising. Measurement, Vol. 100, 2017, p. 157-163.
Cited by
About this article

The authors are grateful to the Center for Intelligence Maintenance Systems (IMS), University of Cincinnati for freely providing the experimental data and so as to the Case Western Reserve University (CWRU) Bearing Data Centre. This work is supported by the National Natural Science Foundations (Grant Nos. 51175419) and Shaanxi Key Laboratory of Machinery Manufacturing Equipment Construction Project, which are highly appreciated by the authors.
Longlong Li had done the most simulation work and write the paper while Yahui Cui had proposed the conception of this manuscript. Runlin Chen checked the simulation program. Xiaolin Liu had modified the figures and Yawei Cao had partially down the data processing.
