Abstract
As is well-known, fault samples are essential for the fault diagnosis and anomaly detection, but in most cases, it is difficult to obtain them. The negative selection mechanism of immune system, which can distinguish almost all nonself cells or molecules with only the self cells, gives us an inspiration to solve the problem of anomaly detection with only the normal samples. In this paper, we introduced the Support Vector Data Description (SVDD) and negative selection mechanism to separate the state space of machines into self, non-self and fault space. To estimate the abnormal level of machines, a function that could calculate the abnormal degree was constructed and its sensitivity change according to the change of abnormal degree was also discussed. At last, Iris-Fisher and ball bearing fault data set were used to verify the effectiveness of this method.
1. Introduction
The research to the machine diagnostic methods is the core problem in the equipment fault diagnosis. Over the past twenty years, many new and effective fault diagnosis methods have appeared and achieved a widespread use already. These methods have played a huge role in improving the reliability of equipment and promoting the economic benefit and social benefit.
The failure of rotating machine is often expressed in the form of large vibration and cyclic occurrences, so the vibration spectrum monitoring method is the main means for the rotating machine maintenance and management. In this method, the key to solve the problem of detection and fault diagnosis is to extract the fault characteristic of machine from the complicated dynamic signal effectively. Nowadays, a lot of modern signal processing techniques have been developed to analyze the nonlinear, non-gaussian and non-stationary signal such as the short-time Fourier transform (STFT) [1], Wigner-Ville distribution [2], wavelet transform [3] and empirical mode decomposition (EMD) [4, 5]. By processing the vibration signal, we can get a lot of graphics that reflect the running status of the machines. The domain experts just make a diagnosis through observation and analysis of the characteristics of these graphics. However, as the rapid development of modern machinery equipment, the signal and graphics of them become more and more complex and the domain experts also have difficulty in analysis and discriminant of them. Thus, as the development of computer, multiple intelligent diagnosis methods that could extract the characteristics of vibration signal automatically were developed to solve the problem such as the artificial neural network (ANN) [6, 7], artificial immune system (AIS) [8-11] and support vector machine (SVM) [12-15]. Nevertheless, most of the methods (like ANN, most SVM and some AIS) are case-based learning algorithms and need fault samples to train their classification model. Consequently they cannot be used in the condition of having no fault knowledge [16]. In this condition, the fault diagnosis problem is changed into novelty detection, so there is an extremely demand for a novelty detection system that cannot only detect the anomaly but also describe the abnormal degree of machines with only the normal samples. In the immune system of human, there is a negative selection mechanism which randomly generates T cells and removes the ones reacting to the body protein, achieving the purpose of identifying non-self with only the normal samples, so this mechanism can be used to solve the novelty detection problem. In 1994, inspired by the negative selection mechanism of biology immune system, Forrest et al. [17] firstly put forward the negative selection algorithm for distinguishing normal samples from others, which reflects two characteristics of biology immune system: (a) self-tolerance: it only recognizes the abnormal samples and tolerates the normal samples; (b) recognition variable: limited scale detectors can recognize infinite scale abnormal samples. However, as a new method, it still has some defaults: (a) consuming a lot of time to generate detectors; (b) slow velocity for a detection sample matching with so many detectors. In order to reduce the number of detectors and improve the detecting efficiency, a diverse family of detectors and detector generation methods were proposed by researchers and practitioners like hyper-ellipsoid detectors [18], hyper-rectangular detectors [19, 20], V-detector [21, 22], r[]-detector [23], heuristic detector generation method [24], feedback mechanism to efficiently generate effective detectors [25], genetic algorithm to generate detectors [26], Neighborhood Negative Selection (NNS) algorithm [27]. Although so many negative selection algorithms have been developed, the essential characteristics of the original negative selection algorithm introduced in Forrest’s paper still remain [28]. Opposite to negative selection algorithm, Stibor et al. [29] proposed the self detector classification method. In this method, self-elements were considered as self detectors with a-priori given self-radius. If an element lies within a self-detector, it is classified as self, otherwise as non-self. Summing all of the former researches, a conclusion can be concluded: no matter negative selection algorithm or self-detector classification method, we only imitate the immune system’s working mechanisms. Therefore, any methods only using the normal samples to classify can be used to imitate the working mechanisms.
In 1999, Tax et al. [30] developed the method of Support Vector Data Description (SVDD) which covered one class of samples with a minimum sphere and separated them with others. Because the method is trained with only data set of one class [30, 31] and has the advantage of fast computational speed, good robustness and obvious data classification boundary [32], it can be used to imitate the working mechanisms of immune system.
In order to estimate the levels of data deviating from the normal, Gonzalez et al. [33] covered the non-self space with different level of hyper-rectangular detectors and a test sample’s abnormal degree is equal to the value of hyper-rectangular detector with the maximum abnormal degree. Liu et al. [34] used this method and combined with neural network realizing the continuous division of non-self space of machines, but it still needed complicated computing to train the neural network. Kim et al. [35] used the SVM classifier as a tool for estimating health state of machine degradation process, but it still needed fault samples to train the classification model.
In this paper, the method of SVDD to describe the negative selection mechanism of immune system is proposed with the judgment conditions that the space in the minimum enclosing hypersphere is the self space and the space out of the minimum enclosing hypersphere is the non-self space. In the proposed algorithm, a function describing the abnormal degree of machine was also constructed, which is based on the distance between the test samples and the center of self-space hypersphere.
The rest of this paper is organized as follows. In Section 2, the concept of SVDD is introduced. Section 3 describes the division for state spaces of machines. Section 4 proposes the machine abnormal degree detection method. Finally, Section 5 verifies the method with artificial data set and ball bearing fault data set.
2. The method of support vector data description (SVDD)
The objective of SVDD [31] is to find a sphere with minimum volume containing all or most of the target data set. For a sphere described by center and radius, we can minimize the following cost function:
with the constrains:
where is the center of the sphere; is the radius of the sphere; is the training samples in multi-dimensional space; is a penalty parameter reflecting compromise between the minimum hypersphere and the off-target samples; is the slack variable meaning some off-target samples are contained in the minimum hypersphere; is the number of training samples. Through introduction of the Lagrange multiplier, the optimal problem can be changed into:
with the Lagrange multipliers and . should be minimized with respect to , , and maximized with respect to and .
Setting the derivative of to zero with , and respectively, lead to:
From the last equation and because and , Lagrange multipliers can be removed when we demand that:
Resubstituting (4)-(6) into (3) results in:
with the constrains:
We can obtain the center and radius by maximizing function (8) with respect to .
To solve the nonlinear division problem, a nonlinear transform is made to map the input variable into Hilbert space . Under the Mercer theorem [36], it is possible to use a kernel function:
replacing the inner product in Hilbert space. Therefore (8) changes into:
with the constrains of (7).
According to the Karush-Kuhn-Tucker (KKT) optimality conditions, the training points can be classified into three parts [24]: (a) the points with are inside of the hypersphere; (b) the points with are on the hypersphere boundary; (c) the points with fall outside the hypersphere and have non zero . Only object with are called the support vectors of the description (SVs) [31]. Thus, the expression for the center of hypersphere and the square radius is given by:
where is the number of SVs; is a optional support vector in set .
The assessment of whether a data point is inside or outside the SVDD hypersphere is based on the sign of the following function [37]:
Then state of can be judged by:
3. Division for state spaces of machine based on SVDD
After the acquisition of normal working data of a machine and signal feature extraction, many normal eigenvectors called normal samples are generated. By randomly selecting some of these eigenvectors to train the SVDD, a minimum feature hypersphere bounding almost all normal samples can be generated.
Definition 1: Through the training of SVDD with some normal samples that are measured on the same device and working condition, a minimum feature hypersphere can be generated. The space surrounded by the hypersphere is called as the self space of machine, denoted as .
Definition 2: The space outside the minimum feature hypersphere is called as the non-self space of equipment, denoted as .
Definition 3: Through respectively training of SVDD with their respective fault samples which are measured on the same device and working condition, some minimum feature hyperspheres surrounding the respective fault samples are generated. The spaces surrounded by these minimum feature hyperspheres are called as the fault spaces of machine, denoted as .
According to the definitions above, the relations among self space, non-self space and fault spaces can be expressed by function (15) and Fig. 1:
Fig. 1The division of self space, non-self space and fault spaces
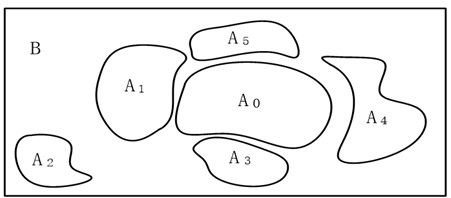
From function (15) and Fig. 1, we can know that fault space is the subset of non-self space. If a sample falls into the non-self space, the equipment isn’t bound to have fault. Only the samples fall into the fault space can be thought of as fault.
4. Machine abnormal degree detection method
The machine abnormal degree is a state transition process. When a sample moves inside the minimum feature hypersphere of self space, its ownership doesn’t change or the reliability belonging to this space is higher than others. As the sample moves out the boundary of self space, its state is changed. To express the abnormal degree of a machine, we introduce the contour lines to divide the non-self space.
Definition 4: Setting that the center of self-space hypersphere is and its corresponding radius is ,the distance between the sample and is:
and the sample’s abnormal degree can be expressed in:
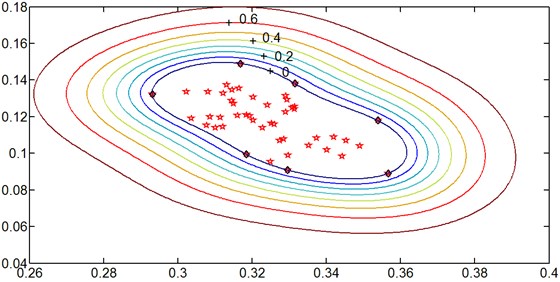
In function (17), the machine abnormal degree ranges from 0 to 1. When a machine is normal, is less than or equal to and is a number equal to 0; when the machine is abnormal, is greater than and increases with the increase of abnormal degree. Using the normal samples of a machine collected under the same working condition, the minimum feature hypersphere of self space can be constructed. In Fig. 2, multiple contours are drawn out with function (17), based on the radius andsome abnormal samples’ distance to the center . We can see that as the samples gradually deviate from the minimum feature hypersphere of self space , their abnormal degree increases gradually.
Fig. 2The description of self space and abnormal degree using contours
In order to further illustrate the characteristics of abnormal degree expression, the variation characteristics of function (17) is also researched. One way to get the variation characteristics is to take a derivative with respect to .
Definition 5: To an arbitrary abnormal sample, the abnormal sensitivity at this position can be expressed in:
Therefore, as the increase of , decreases gradually. Table 1 shows the change of following with . When the abnormal degree is relatively low, is sensitive to the change of sample’s position and a certain value change of covers relatively smaller non-self space; when the abnormal degree is relatively high, the case is just contrary. This varying pattern is in favour of the abnormal degree’s express of no-normalization samples.
Table 1The change of abnormal sensitivity following with the abnormal degree’s change
Abnormal degree Variable Range / | Variable Range of | Variable Quantity of | Sensitivity Variable Range / |
0~0.1 | (1.00~1.11) | 0.11 | (1.00~0.90) |
0.1~0.2 | (1.11~1.22) | 0.11 | (0.90~0.78) |
0.2~0.3 | (1.22~1.36) | 0.14 | (0.78~0.70) |
0.3~0.4 | (1.36~1.51) | 0.15 | (0.70~0.60) |
0.4~0.5 | (1.51~1.69) | 0.18 | (0.60~0.50) |
0.5~0.6 | (1.69~1.92) | 0.23 | (0.50~0.40) |
0.6~0.7 | (1.92~2.20) | 0.28 | (0.40~0.30) |
0.7~0.8 | (2.20~2.61) | 0.40 | (0.30~0.20) |
0.8~0.9 | (2.61~3.30) | 0.70 | (0.20~0.10) |
0.9~1.0 | (3.30~∞) | ∞ | (0.10~0.00) |
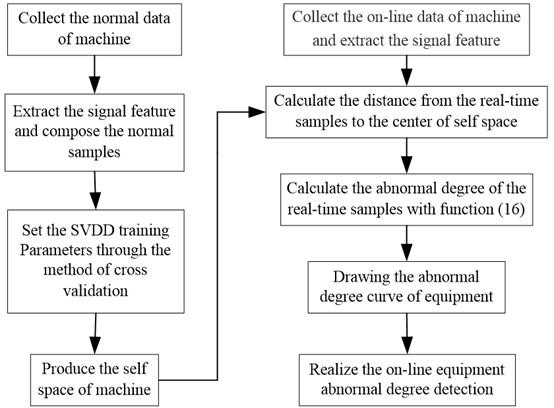
The contour values of abnormal samples actually reflect the relatively deviate degree from the self space of machine in a working condition. Through the division of self and non-self space of machine, a real-time abnormal degree curve can be drawn by the calculation of function (17). Fig. 3. shows the flow chart of off-line learning and on-line detection.
In the process of on-line detection, the abnormal degree of normal samples is zero; however the abnormal degree of abnormal samples change between 0 and 1. Through the observation of the real-time abnormal degree curve, we can understand the working conditions of machine. In order to make the output of abnormal degree curve clear, a smooth function is used to deal with the samples’ abnormal degree [38]:
where is the window smooth threshold; is the average output of the former ; is a sample’s abnormal degree output.
Fig. 3The flow chart of off-line learning and on-line abnormal degree detection
5. Simulation experiment and example analysis
In order to verify the effectiveness of the presented method, Iris-Fisher data set is taken as the example of experimental analysis. Iris-Fisher data set, composed of four characteristics, has three different plants data: Setosa, Virginica and Versicolor, with 50 samples for each plant. Setosa is linearity separable with the other two kind of samples, but Virginica and Versicolor are nonlinear separable each other. Randomly select 25 Virginica data as the self space samples to train the SVDD and introduce the Gaussian Kernel Function in consideration of the existence of nonlinear samples:
Before the training of self space, all the data have been normalized between 0 to 1 and a sliding window of size 2 is also used to define the distance in 2-dimensional space, not the original 4-dimensional space [6, 7, 14]. The parameters of 0.04 and 0.9 are optimized through the method of Optimizing Kernel Algorithm [39]. Fig. 4 shows the distribution of self space, non-self space and the abnormal degree contours calculated by Function (17). Results show the Versicolor data (as is shown with ‘*’) is close to Virginica data (as is shown with ‘☆’) and has low abnormal degree, but Setosa data (as is shown with ‘△’), is away from Virginica data and has high abnormal degree. This distribution law is in line with the calculated value of function (17).
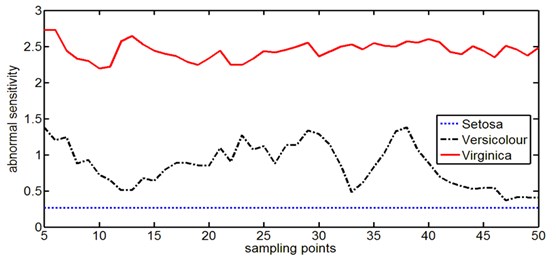
To characterize the different abnormal degree of samples, we express them in term of a curve with sample points as the abscissa and abnormal degree values as the ordinate. Fig. 5 shows the abnormal degree curves of three types of data calculated by function (17) which are smoothed by function (19) in order to make them clearer. In Fig. 5, the abnormal degree of Setosa is higher than that of Versicolor and Virginica; however, in Fig. 6 the condition of abnormal sensitivity is just opposite and the Setosa’s abnormal sensitivity is lowest among the three types of data. By comparing Fig. 5 and Fig. 6, we also discover that for a class of Iris data like the Versicolor, the samples with higher abnormal degree have lower abnormal sensitivity and the samples with lower abnormal degree have higher abnormal sensitivity, which also reflects the change rule of abnormal sensitivity. Although Setosa and Versicolor have nearly the same distribution shape and dispersion in Fig. 4, but the wave range of abnormal degree is much different, so the change of abnormal sensitivity is also expressed in Fig. 5: a certain value change of higher abnormal degree covers relatively larger non-self space with a lower sensitivity; on the contrary a certain value change of lower abnormal degree covers relatively smaller non-self space with a higher sensitivity. For the samples in self space, the Virginica’s abnormal degree is near zero with a minute wave range, which shows the good robustness of this method.
Fig. 4The 2-dimensional distribution of Iris data set and the abnormal degree contours expression
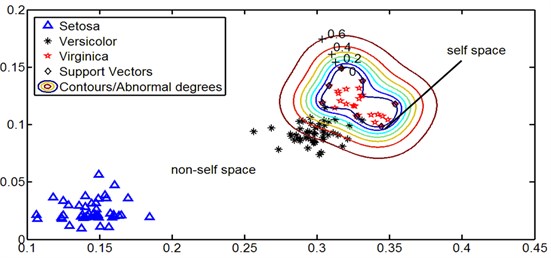
Fig. 5Abnormal degree curves of Iris data with Virginica data as the self space samples
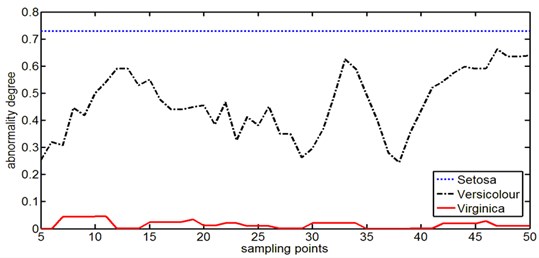
Fig. 6The abnormal sensitivity curves of Iris data with Virginica data as the self space samples
In order to further validation the effectiveness of the proposed abnormal degree detection method, the ball bearing fault samples is also used as the application example. The analysis data is from Case Western Reserve University’s bearing fault data set with the selected bearing type and experiment parameters shown in Table 2.
Table 2The fault measuring parameters of ball bearing
Bearing type | Fault location | Fault diameter | Approx. Motor Speed / rpm | Motor Load / HP |
6205 | Ball | 0.1” | 1725 | 3 |
6205 | Ball | 0.21” | 1729 | 3 |
6205 | Inner Race | 0.14” | 1726 | 3 |
6205 | Inner Race | 0.21” | 1727 | 3 |
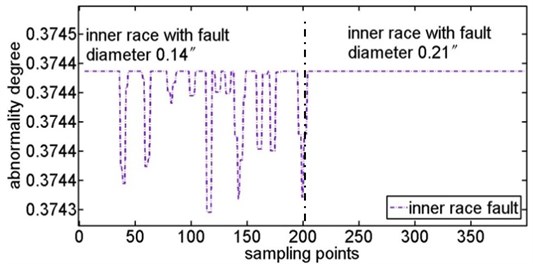
The raw data is the time series of measured acceleration of ball bearings. To effectively extract the signal feature, the eight layers ‘db1’ wavelet transform is used to process the raw data. Extracting the High-Frequency Wavelet Coefficients energy of each layer and arranging them as the wavelet scale [40], we compose some 8-dimensional eigenvectors. These 8-dimensional eigenvectors represent the signal characteristics. The eigenvectors of normal ball bearing are considered as the samples in self space and the remaining eigenvectors are considered as samples in non-self space. Randomly selecting 100 eigenvectors of the normal ball bearing as the training samples, a minimum feature hypersphere representing the self space could be generated through the training of SVDD. Fig. 7 shows the contrast of abnormal degree between the ball fault and the normal samples of ball bearing. Fig. 8 shows the abnormal degree change of ball fault with the increase of fault diameter, in which the abnormal degree increases as the increase of fault diameter but the wave range decreases. Fig. 9 shows the contrast of abnormal degree between the inner face fault and the normal samples of ball bearing. Fig. 10 shows the abnormal degree change of inner face fault with the increase of fault diameter which has the same change law as ball fault.
Fig. 7Abnormal degree curves of ball fault with the contrast of ball fault samples and normal samples
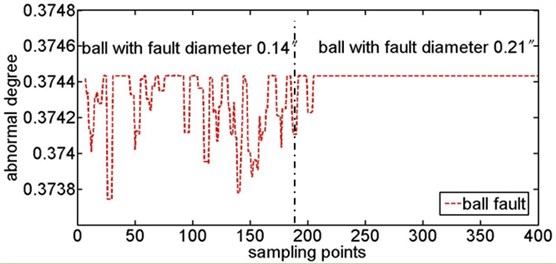
Fig. 8Abnormal degree curves of ball fault with the increase of fault diameter
Fig. 9Abnormal degree curves of inner race fault with the contrast of inner race fault samples and normal samples
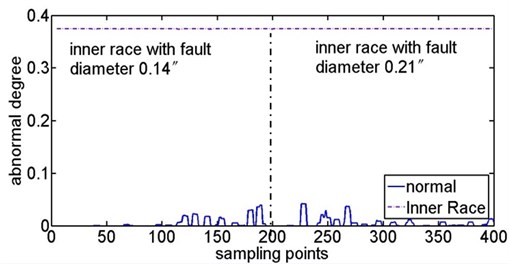
Fig. 10Abnormal degree curves of inner fault with the increase of fault diameter
6. Conclusions
SVDD is an excellent method of one-class classification, with the advantages of robustness and high computation. So we propose using this method to express the negative selection mechanism of immune system and design an abnormality function to express a text sample’s abnormal degree, based on the distance between the center of the self space and the text sample. This method only needs some normal data to build the normal space of machine, which is important for the machine’s abnormal degree detection, because obtaining fault data is difficult, expensive or even impossible. Beside, this method also decreases the number of detectors and reduces the computational complexity for just using a minimum hypersphere to cover the self space and leaving out the tedious training of neural network. Experimental results show that the designed method can detect the early degradation easily and better reflect the degradation’s development for ball bearings.
References
-
Yilmaz O. Remote sensing of vibration on induction motor and spectral analysis. Journal of Vibroengineering, Vol. 13, Issue 4, 2011, p. 712-718.
-
Wang Y. X., He Z. J., Xiang J. W. Application of extended time-frequency domain average in ultrasonic detecting. Journal of Vibroengineering, Vol. 13, Issue 2, 2011, p. 144-156.
-
Ashory M. R., Masoumi M., Jamshidi E., et al. Using continuous wavelet transform of generalized flexibility matrix in damage identification. Journal of Vibroengineering, Vol. 15, Issue 2, 2013, p. 512-519.
-
Li L. L., Xu G. H., Wang J., et al. Automatic detection of epileptic slow-waves in EEG based on empirical mode decomposition and wavelet transform. Journal of Vibroengineering, Vol. 15, Issue 2, 2013, p. 961-970.
-
Wang Y. X., He Z. J., Xiang J. W. Application of extended time-frequency domain average in ultrasonic detecting. Journal of Vibroengineering, Vol. 13, Issue 2, 2011, p. 144-156.
-
Abad M. R A. A., Ahmadi H., Moosavian A., et al. Discrete wavelet transform and artificial neural network for gearbox fault detection based on acoustic signals. Journal of Vibroengineering, Vol. 15, Issue 1, 2013, p. 459-463.
-
Nogay H. S., Akinci T. C. A proposal for visually handicapped students to use electrical control laboratory. Journal of Vibroengineering, Vol. 13, Issue 2, 2011, p. 245-252.
-
Watkins A., Timmis J., Boggess L. Artificial Immune Recognition System (AIRS): An immune-inspired supervised learning algorithm. Genetic Programming and Evolvable Machines, Vol. 5, Issue 3, 2004, p. 291-317.
-
Silva G. C., Palhares R. M., Caminhas W. M. Immune inspired fault detection and diagnosis: A fuzzy-based approach of the negative selection algorithm and participatory clustering. Expert Systems with Applications, Vol. 39, Issue 16, 2012, p. 12474-12486.
-
Ghosh K., Srinivasan R. Immune-system-inspired approach to process monitoring and fault diagnosis. Industrial & Engineering Chemistry Research, Vol. 50, Issue 3, 2012, p. 1637-1651.
-
Wang C. J., Zhao Y. H. A new fault detection method based on artificial immune systems. Asia-Pacific Journal of Chemical Engineering, Vol. 3, Issue 6, 2012, p. 706-711.
-
Moosavian A., Ahmadi H., Tabatabaeefar A. Fault diagnosis of main engine journal bearing based on vibration analysis using Fisher linear discriminant, K-nearest neighbor and support vector machine. Journal of Vibroengineering, Vol. 14, Issue 2, 2012, p. 894-906.
-
Kumar H., Kumar T. A. R., Amarnath M., et al. Fault diagnosis of antifriction bearings through sound signals using support vector machine. Journal of Vibroengineering, Vol. 14, Issue 4, 2012, p. 1601-1606.
-
Zhu K. H., Song X. G., Xue D. X. Incipient fault diagnosis of roller bearings using empirical mode decomposition and correlation coefficient. Journal of Vibroengineering, Vol. 15, Issue 2, 2013, p. 597-603.
-
Yaqub M. F., Gondal I., Kamruzzaman J. An adaptive self-configuration scheme for severity invariant machine fault diagnosis. IEEE Transactions on Reliability, Vol. 62, Issue 1, 2013, p. 116-126.
-
Smarta E., Browna D., Denman J. Combining multiple classifiers to quantitatively rank the impact of abnormalities in flight data. Applied Soft Computing, Vol. 12, Issue 8, 2012, p. 2583-2590.
-
Forrest S., Perelson A. S., Allen L., et al. Self-nonself Discrimination in a Computer. First Edition, IEEE Inc., Oakland, 1994.
-
Shapiro J. M., Lamont G. B., Peterson G. L. An Evolutionary Algorithm to Generate Hyper-ellipsoid Detectors for Negative Selection. First Edition, Assoc. Computing Machinery, New York, 2005.
-
Ostaszewski M., Seredynski F., Bouvry P. Immune Anomaly Detection Enhanced with Evolutionary Paradigms. First Edition, Assoc. Computing Machinery, New York, 2006.
-
Ostaszewski M., Seredynski F., Bouvry P. Coevolutionary-based mechanisms for network anomaly detection. Journal of Mathematical Modelling and Algorithms, Vol. 6, Issue 8, 2007, p. 411-431.
-
Zhou J., Dasgupta D. Real-Valued Negative Selection Algorithm with Variable-Sized Detectors. First Edition, Assoc. Computing Machinery, Seattle, 2004.
-
Zhou J., Dasgupta D. V-detector: An efficient negative selection algorithm with "probably adequate" detector coverage. Information Sciences, Vol. 179, Issue 10, 2009, p. 1390-1406.
-
Luo W., Wang X., Tan Y., et al. A Novel Negative Selection Algorithm with an Array of Partial Matching Lengths for Each Detector. First Edition, Springer Inc., Reykjavik, 2006.
-
Luo W., Zhang Z., Wang X. A Heuristic Detector Generation Algorithm for Negative Selection Algorithm with Hamming Distance Partial Matching Rule. First Edition, Springer Inc., Oeiras, 2006.
-
Ma W., Tran D., Sharma D. Negative Selection with Antigen Feedback in Intrusion Detection. First Edition, Springer Inc., Phuket, 2006.
-
Gao X. Z., Ovaska S. J., Wang X. Multi-level optimization of negative selection algorithm detectors with application in motor fault detection. Intelligent Automation and Soft Computing, Vol. 16, Issue 3, 2010, p. 353-375.
-
Wang D. W., Xue Y. B., Dong Y. F. Anomaly detection using neighbohood negative selection. Intelligent Automation and Soft Computing, Vol. 22, Issue 5, 2011, p. 595-605.
-
Dasgupta D., Yu S., Nino F. Recent advances in artificial immune systems: Models and Applications. Applied Soft Computing, Vol. 11, Issue 2, 2011, p. 1574-1587.
-
Stibor T., Mohr P., Timmis J., et al. Is Negative Selection Appropriate for Anomaly Detection? First Edition, Assoc. Computing Machinery, Washington, DC, 2005.
-
Tax D. M. J, Duin R. P. W. Support vector domain description. Pattern Recognition Letters, Vol. 20, Issue 11-13, 1999, p. 1191-1199.
-
Tax D. M. J, Duin R. P. W. Support vector data description. Machine Learning, Vol. 54, Issue 1, 2004, p. 45-66.
-
Bin C., Yan Z. l., Cheng X. B. Machinery fault trend prediction based on SVDD and relative distance. Chinese Journal of Scientific Instrument, Vol. 32, Issue 7, 2011, p. 1558-1563.
-
Gonzalez F., Gómez J., Kaniganti M., Dasgupta D. An Evolutionary Approach to Generate Fuzzy Anomaly Signatures. First Edition, IEEE Inc., USA, 2003.
-
Liu S. L., Huang W. H., Xia S. B. Fault detection approach based on immune mechanism for gas valves of reciprocating compressors. Chinese Journal of Mechanical Engineering, Vol. 40, Issue 7, 2004, p. 156-160.
-
Kim H. E., Tan A. C. C., Mathew J., et al. Bearing fault prognosis based on health state probability estimation. Expert Systems with Applications, Vol. 39, Issue 5, 2012, p. 5200-5213.
-
Chang D. G., Wang H. Y., Tsang E. C. C. Generalized Mercer Theorem and Its Application to Feature Space Related to Indefinite Kernels. First Edition, IEEE Inc., Kunming, 2008.
-
Pan Y. N., Chen J., Guo L. Robust bearing performance degradation assessment method based on improved wavelet packet-support vector data description. Mechanical Systems and Signal Processing, Vol. 23, Issue 3, 2009, p. 669-681.
-
Liu S. L., Huang W. H., Xia S. B., et al. Research on immune neural network approach to fault detection for gas valves of piston compressors. China Mechanical Engineering, Vol. 16, Issue 15, 2005, p. 1384-1387.
-
Zhao F., Zhang J. Y., Liu J. An optimizing kernel algorithm for improving the performance of support vector domain description. Acta Automatica Sinica, Vol. 12, Issue 6, 2008, p. 1122-1127.
-
Zheng H, B., Chen X, Z., Li Z, Y., et al. Implementation and application of a neural network fault diagnosis system based on wavelet transform. Transactions of the Chinese Society of Agricultrual Machinery, Vol. 5, Issue 1, 2002, p. 73-76.
About this article
This work was supported by National Natural Science Foundation of China (50475183), the Specialized Research Fund for the Doctoral Program of Higher Education (20103 108110006) and Shanghai Science and Technology Commission Basic Research Project (11JC140 4100).
