Abstract
An integrated hardware and software system for a scalable wireless sensor network (WSN) is designed and developed for structural health monitoring. An extension sensor board is designed, developed, and calibrated to meet the requirements for structural vibration monitoring and modal identification. The extension sensor board has 3 axes of accelerometers in three directions and a temperature sensor. Software components have been implemented within the TinyOS operating system to provide a flexible software platform and scalable performance for structural health monitoring applications. The prototype WSN is deployed on a reduced-scale bridge model with 3 nodes in a single-hop network for performing dynamic monitoring civil engineering structures. Two output-only time-domain system identification methods are employed namely, the Frequency Domain Decomposition (FDD) method and the Natural Excitation Technique (NExT) combined with the Eigensystem Realization Algorithm (ERA). Testing results show that the WSN provides accurate vibration data for identifying vibration modes of a bridge.
1. Introduction
Structural Health Monitoring (SHM) techniques have gained attention in near past, which are used for damage detection, damage localization and prediction of remaining lifespan for structures such as buildings, bridges, dams and tunnels. Typical SHM studies involve stress, pressure, displacement, temperature and acceleration measuring sensors. These sensors are placed at different locations on structures to identify the dynamic characteristics, and the most common method is to collect the vibration data induced by ambient sources for analysis. The damage can be identified by a change in the modal parameters (eigenvectors and natural frequencies) obtained from measured time histories. At present time, practical use of SHM systems are usually realized through wired communications [1, 2]. However, the wired data acquisition systems require specialized data acquisition equipment, expensive communication cables to be installed and regularly maintained, and thus they are not widely implemented in SHM because of their high cost [3].
With rapid advancement in smart sensing technology and wireless communication technology, wireless sensor network (WSN) offers an alternative solution to SHM. Compared to the traditional methods, the use of wireless technologies offers distinctive advantages in the field. For example, low-cost WSN instrumentation promises dense deployment of wireless sensors, which can increase the accuracy of the collected SHM data. Also, it promises fast and flexible deployment and easier maintenance. Recently, some innovative commercial off-the shelf sensor platforms have been developed in support of SHM. Kurata and Spencer [4] have reported their experiences using the MICA Mote wireless sensing platform [5] for structural monitoring. Based on the MicaZ and Mica2 platforms, related work on using WSNs for structural monitor includes notable experiments like Wisden, Tenet [6] and the Golden Gate Bridge deployment [7]. However, although existing works have demonstrated the feasibility of structural data collection using WSNs, research is still in a preliminary stage. Consequently, we believe there room for improvement in the design of a cheap and real-time system able to acquire time-synchronized and high-frequency data.
The objective of this paper is to present the design, development, and testing of a scalable wireless sensor network for bridge health monitoring. In this paper, we design an extension sensor board according to the need of bridge structure health monitoring and a new wireless sensing system for high-frequency data acquisition based on commercial off-the shelf WSN platforms. In order to evaluate its practical utility for performing structural dynamic monitoring works, an assessment of dynamic characteristics of an in-house cable-stayed bridge model using wireless technology is presented in this paper. Modal parameters such as natural frequencies and mode shapes obtained from vibration response of the bridge model by employing output-only system identification (SI) techniques.
2. Wireless data acquisition system design
In this section, we propose the hardware and software design of the SHM system based on WSN. The system architecture is presented firstly. Then we discuss the off-the shelf sensor mote and the extension sensor board design. Next, software design is mentioned.
2.1. System architecture
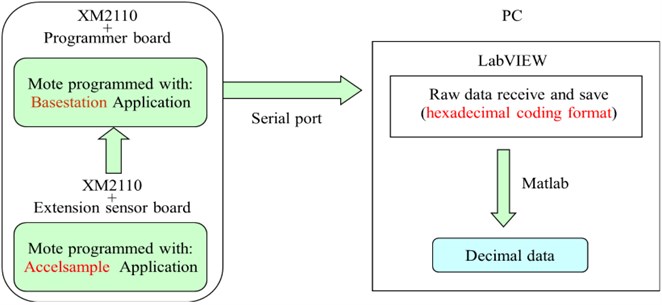
The wireless based SHM system composed of a number of sensor nodes and a base station, shown in Fig. 1, is responsible for network coordination and data collection. These nodes are usually small in size with limited processing power, limited memory and limited energy source. Each sensor node consists of a mote and a sensor board, which acquires vibrations from the structure through an accelerometer, and then transmits wirelessly the acquired data. Fig. 2 presents an overview of the sensor node hardware as a block diagram. The coordinator node is connected to the MIB-520 USB programming board, thus acting as a gateway between the WSN and the central server.
Fig. 1Wireless sensor network
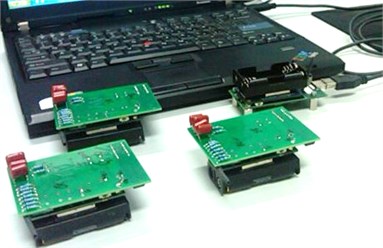
Fig. 2Hardware block diagram
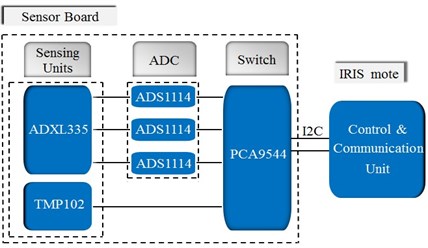
Fig. 3A picture of the IRIS mote and it’s properties
2.2. The sensor mote
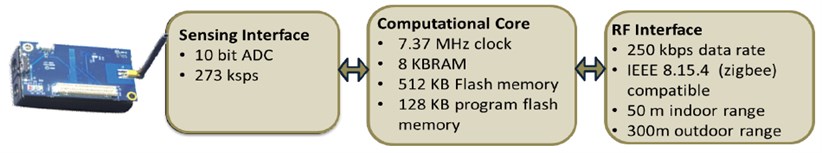
For each node, a mote with a microcontroller provides local processing and storage capability and a low-power radio communication. An off-the-shelf sensor mote, the IRIS wireless module, is chosen because it has a good tradeoff between processing and communication capability. The IRIS mote and the properties of its different components are shown in Fig. 3. Compared with previous generations of MICA Motes, IRIS provides users with high-level functional integration up to three times improved radio range and twice the program memory. The IRIS is a 2.4 GHz Mote used for enabling low-power wireless sensor networks, poared using two AA batteries, and has a 51-pin extension for the connection of analog inputs and I/O options. These I/O options include I2C, SPI and UARTs.
2.3. Extension sensor board design
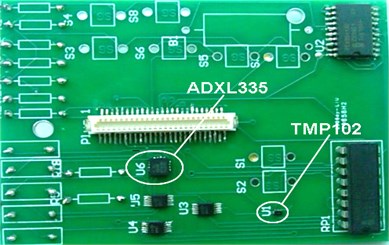
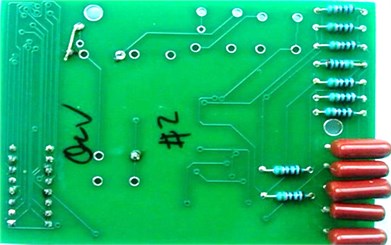
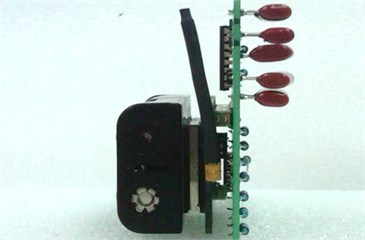
An extension sensor board, shown in Fig. 4, is designed for SHM applications, which could be connected with the IRIS mote using the 51-pin expansion connector. The sensor board integrates accelerometer, strain interface, and temperature. For the measurement of accelerations, a commercially available MEMS accelerometer sensor ADXL335 is used to monitor three directions. The ADXL335 is a small, thin, low power, complete 3-axis accelerometer with signal conditioned voltage outputs. The measurements can be both static acceleration (e.g. gravity) and dynamic (e.g. shock or vibration). It measures acceleration with a minimum full-scale range of ±3 g. Capacitors of 0.1 μF are added at three pins to implement low-pass filtering with a cutoff frequency (or analog filter bandwidth) of 50 Hz for anti-aliasing and noise reduction. The analog signal is fed to a 16-bit analog-to-digital converter (ADC), called ADS1114, for each of the three axes (channels). TMP102 is a Low Power Digital Temperature Sensor. A 4-channel switch, PCA9544, is used to control the enabling of three ADCs and TMP102 by the I2C-buses. Also, the switch is controlled by I2C interface from the mote.
Fig. 4a) Front of the extension sensor board, b) back of the extension sensor board
a)
b)
2.4. Software architecture
A WSN based structural monitoring system is a distributed sensing system. Fig. 5 displays the logical structure of a wireless data acquisition System. The core component of the software system is one running on the sensor nodes. In order to support the node hardware, we developed a software driver in NesC for TinyOS. TinyOS is an operating system developed by UC Berkeley, which provides the software infrastructure for the sensor networks. NesC is built as an extension to the C programming language, as a set of cooperating tasks and processes with components wired together to run applications on TinyOS. The driving software could be divided into acquisition module, wireless communication module, synchronization module. The Accelsample application (TinyOS version 2.1) installed in the IRIS is responsible for time synchronization, sampling the data during structure health monitoring, and transmitting the data to the base station. The software architecture of the sensor nodes uses new components integrated into the TinyOS infrastructure to satisfy the requirements discussed above.
Fig. 5Software architecture of a wireless data acquisition system
2.5. Time synchronization
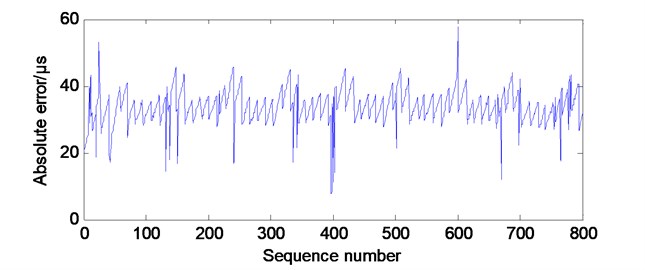
The time synchronization in the system makes use of the TinyOS implementation. Time synchronization can operate in one of 2 motes. To achieve better synchronization performance, the Flooding Time Synchronization Protocol (FTSP) is chosen to realize time synchronization in sampling software. Fig. 6 shows the time synchronization error of the two motes. It can be found that the maximum error is 60 μs, which can be ignored in practice.
Fig. 6Time synchronization error
3. Sensor board validation
3.1. Sensor board calibration
Static method for the earth’s gravitation can be used to perform straightforward sensor board calibration. The raw outputs of the sensor board are the Analog-Digital-Converter (ADC) values from the ADS114. To convert the raw data to units of acceleration, the scale and offset values must be determined for each sensor as follows:
where and are known as the calibration constants, which can be utilized to obtain the physical acceleration. The allows conversion from the raw ADC values to acceleration. The is the mean of the ADC values.
Tests are conducted to calibrate -axis of the accelerometer, as illustrated in Fig. 7. Set the extension sensor board sitting on a flat surface. Use a level to check that the -axis is experiencing –1 g. Measure data from -channels with no excitation and then calculate the mean values. Turn the sensor board stack on its side so that the -axis experience 0 g and repeat the measurements. The results provided the necessary calibration constants which can be directly implemented in the sensing application.
Fig. 7Illustration of orientation for accelerometer calibration
a) –1 g
b) 0 g
According to the above principle, the value of and can be calculated as follows:
where the acceleration is calculated as:
3.2. Validation testing
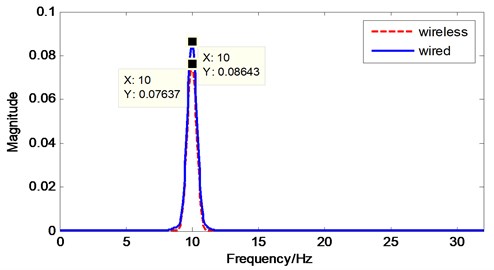
The extension sensor board is also tested on a vibration exciter against a wired reference sensor, as shown in Fig. 8. The reference sensor is a piezoelectric accelerometer with 100 mV/g sensitivity and 150 Hz measurement range. Fig. 9 presents that a 10 Hz sine excitation produced in LabVIEW software is used to investigate the performance of the sensor board. By adopting a FFT analysis to the sampled record of 3 seconds (shown in Fig. 10), the sampled signal could be expressed in the frequency domain accurately. The result is given in Fig. 11.
Fig. 8Reference sensor and extension sensor board with Iris mounted on a vibration exciter platform
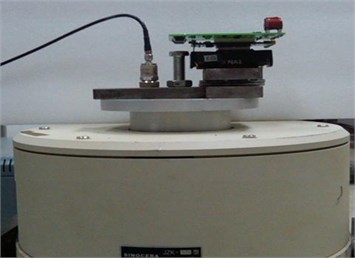
Fig. 9Output settings of LabVIEW front panel
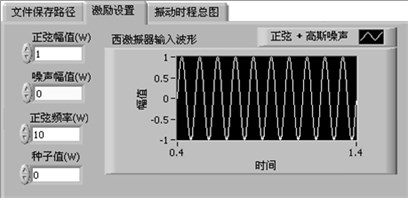
Fig. 10The sample domain plot comparison
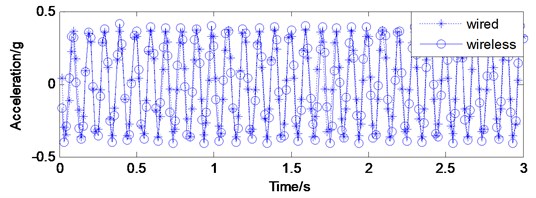
Fig. 11Power spectrum plot of validation test
4. Implementation on bridge
4.1. Test structure
The experimental structure represents a reduced-scale model of Shandong Binzhou Yellow river cable-stayed bridge, which is built in a ratio of 1/40 to the prototype bridge. The scaled two-span bridge model (Fig. 12) is mainly made of aluminum, with 15.2×0.82×0.07 m deck, 3.1 m middle tower and 1.9 m side tower. Effective stiffness criterion is utilized in the reduced-scale dynamic-elastic bridge model design. Additional masses are added so the bridge model would give similar dynamic characteristics within the range of the prototype bridge. Table 1 lists the specific parameters of the bridge model. Several experiments have been previously conducted with various configurations of this structure [8]. Their analysis results based on the similarity theory have showed that the reduced-scale bridge model with added masses has a good degree of similarity with the prototype bridge.
Table 1Experimental cable-stayed bridge model mechanical characteristics
Element | Cross section | Material | Density (kg/m3) | Modulus (GPa) | Poisson ratio | Dimension (m) |
Middle tower | Box | Aluminum alloy | 2700 | 68.6 | 0.34 | 3.1×0.1375×0.095 |
Side tower | Box | Aluminum alloy | 2700 | 68.6 | 0.34 | 1.9×0.12×0.075 |
Deck | Separate box | Aluminum alloy | 2700 | 68.6 | 0.34 | 15.2×0.82×0.07 |
Cable | Circle | High-strength steel wire | 7850 | 200 | 0.30 | varies |
Fig. 12The reduced-scale laboratory model of Binzhou Yellow river bridge
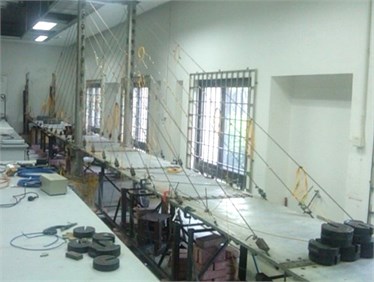
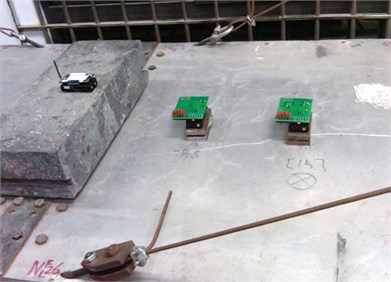
Fig. 13Deployment of IRIS-Mote with the extension sensor board
4.2. Test setup
A set of 18 measure points are selected over the bridge main span. The 3 IRIS motes with two extension board are deployed on the main bridge deck, as shown in Fig. 13. The sensor nodes are fixed to the bridge with a magnet. The two wireless sensor nodes communicated in a single-hop topology. The acquired data from the analog input first route to the base station, then forward to the PC through a serial port. The vertical vibration responses are measured as a result of sensor orientation with 64 Hz sampling frequency. All records are complete time histories under walking load with the duration of 30 seconds.
4.3. Finite element analysis of bridge model
Aimed at verifying the accuracy of testing results, a full three-dimensional finite element model is established using ANSYS. The geometry and member details of the model are based on the design information the laboratory test bridge model. The main structural members are composed of stay cables, floor beams, and towers, all of which are discreterized by different finite element types.
Fig. 14The operational deflection shapes for the first four fundamental modes of vibration obtained using FEA method
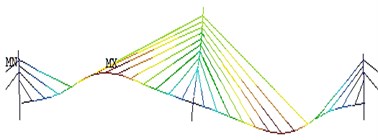
a) 1st vertical bending
c) 3rd vertical bending
b) 2nd vertical bending
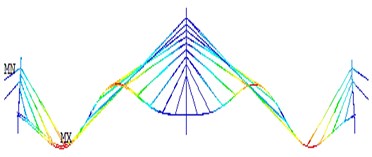
d) 4th vertical bending
Modeling of the stay cables is possible in ANSYS by employing the 3-D tension-only truss elements (LINK8), and utilizing its stress-stiffening capability. Each stay cable is modeled by one element, which results in 60 tension-only truss elements in the model. Two steel main girders are modeled as the 3-D elastic beam elements (BEAM4) for simplicity, since they are the structural members possibly subjected to tension, compression, bending and torsion. There are in total 508 elements of this type. Towers consist of both equivalent and variable sections so they are discreterized by BEAM188 elements with a total number of 140. All piers and platforms are modeled by the solid elements (SOLID45), of which there are 852. The diaphragms are modeled by 80 beam elements (BEAM44). In addition, 210 concentrated mass elements (MASS21) are used to include the mass of equilibrium blocks, parapet and anchors that are nonstructural members.
The complete model consists of 1371 nodes and 1500 elements resulting in 8202 active degrees of freedom (DOFs). The model represents the bridge in its current as-built configuration and structural properties. The first four vertical bending modal shapes from FEA are shown in Fig. 14.
4.4. Analysis of experimental results
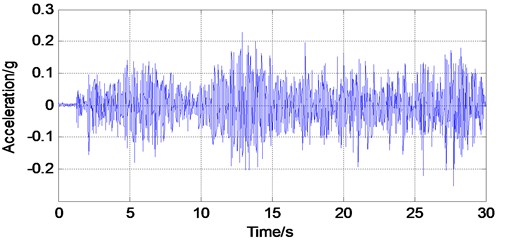
By using wireless sensing units, the ambient vibration response of the bridge model can be collected with ease and convenience. Dynamic parameters identification of the bridge model shown in this section utilizes the records from the outputs of the wireless tests for all 18 cases. A typical acceleration record collected by the wireless sensor is shown in Fig. 15.
Fig. 15Typical wireless acceleration time histories
To extract modal information from the output only data set generated by a wireless monitoring system, output-only system identification techniques can be applied. In this study, two output-only system identification methods are employed namely, the Frequency domain decomposition (FDD) method and the Natural Excitation Technique (NExT) combined with the Eigensystem Realization Algorithm (ERA). Accuracy and efficiency of both methods are investigated, and compared with the results from the wired testing counterparts.
Frequency domain decomposition method: the FDD method as originally presented by Brincker et al. [9] is adopted to dealing directly with the spectral density function of the bridge model response signals using output-only measurements recorded by the wireless monitoring system. Interested readers are referenced to [10] and a brief summary of the method is presented herein.
In this identification method, the first step is to estimate the power spectral density (PSD) matrix from the measurements and then decomposed at by taking the singular value decomposition (SVD) of the matrix:
where the matrix is a matrix holding the singular vectors , and is a diagonal matrix holding the scalar singular values . If only the th mode is present at the selected frequency , then there will be only one singular value in Eq. (12). Thus, the first singular vector would then serve as an estimate of the th mode shape . To implement the FDD method, some prior knowledge of the modal frequencies is required; traditional peak-picking methods can be adopted using the frequency response function of the system calculated for each system output. An advantage of the FDD method is that if two modes are closely spaced and can be identified previously (e.g. using the peak picking method), they can be identified based upon multiple singular values presented at a selected frequency.
Eigensystem realization algorithm: A second modal estimation method is adopted in this study termed the Natural Excitation Technique combined with the Eigensystem Realization Algorithm method (NExT/ERA). NexT/ERA is a relatively new method. The basic principle of NExT states that the cross-correlation function between two responses made on an ambient-excited structure has the same analytical form as the impulse response function (or the free vibration response) of the structure. In order to understand this concept, a brief explanation will be provided; readers are advised to refer to the work by Farrar and James [11] for full derivation of the method.
ERA are output-only time-domain modal identification techniques from free response signals. Unfortunately, the ambient responses of the cable-stayed bridge model are forced vibrations rather than free vibrations. Therefore, the ambient data should be transformed into free vibration data before usage of ERA. The random decrement technique () is a good method to do this [12]. It denotes, for instance, the simplest and classical function of an ambient signal as:
where , 1, 2,..., , is the time when crosses down a fixed threshold , called triggering level and is called triggering point. Such functions can be good signatures. Besides, functions of ambient responses are proportional to the cross-correlation functions of the responses. The correlation operation plays the role of noise filtering.
Random decrement () functions are built to convert the ambient responses to free vibrations. ERA method uses cross-correlation functions of functions to form the Hankel matrix instead of functions themselves and uses eigenvalue decomposition instead of singular value decomposition. The data for response accelerations are acquired group by group because of limited number of wireless sensors available. The modes are identified group by group and then assembled by using response accelerations acquired at reference points to form modes of the complete bridge model.
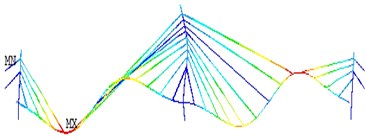
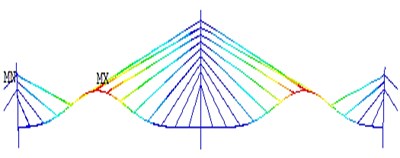
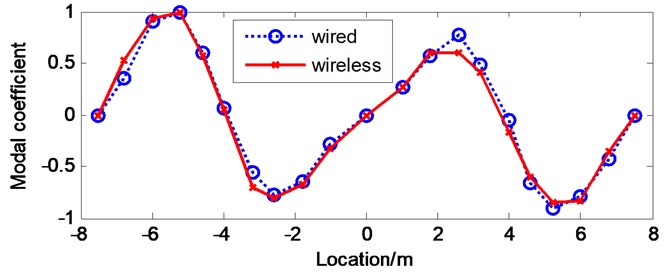
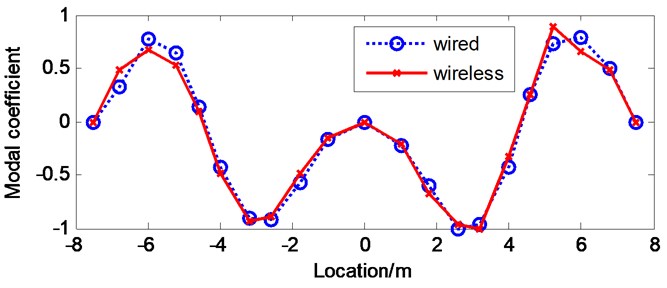
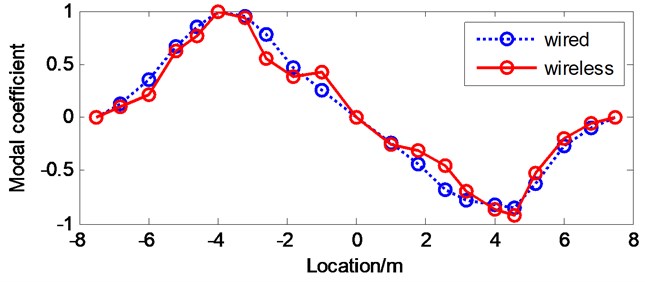
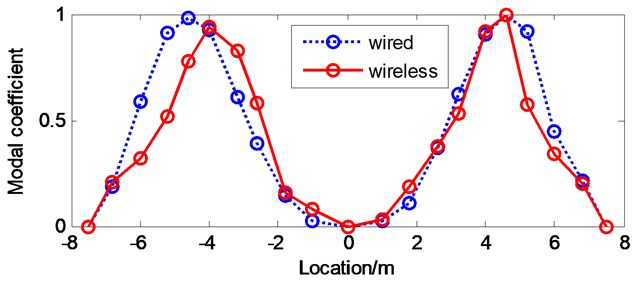
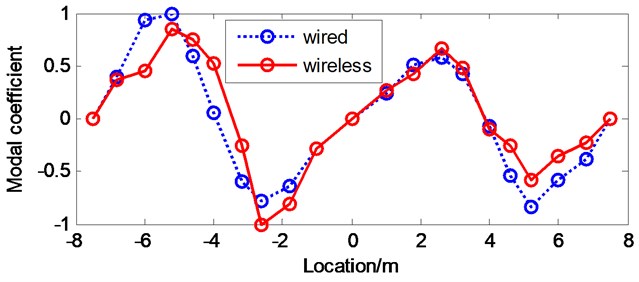
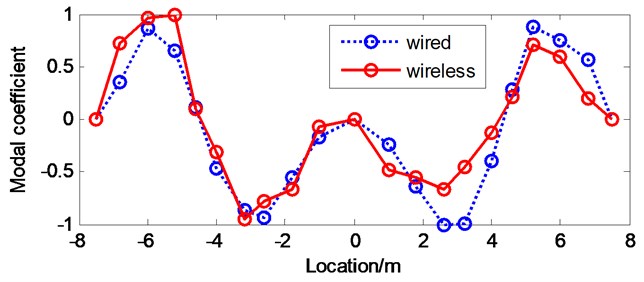
The correlation between modal shapes identified from the wireless test and the wired test can be evaluated by plotting them on the same graphs. Fig. 16 shows the first four vertical modal shapes of the bridge model obtained from both wired test and wireless test by FDD. While Fig. 17 shows the first four vertical modal shapes of the bridge model obtained from both wired test and wireless test by NExT/ERA. By comparing the identified modal shapes, one can clearly observe the excellent agreement between the results from wired and wireless tests, particularly in the FDD method as shown in Fig. 16.
To better evaluate the correlation of the identified mode shapes from the wireless and wired tests, the Modal Assurance Criterion (MAC) [13] is used. The MAC between a WSN measured mode and a wired test measured mode is defined as:
Fig. 16First four vertical modal shapes of the bridge model by FDD
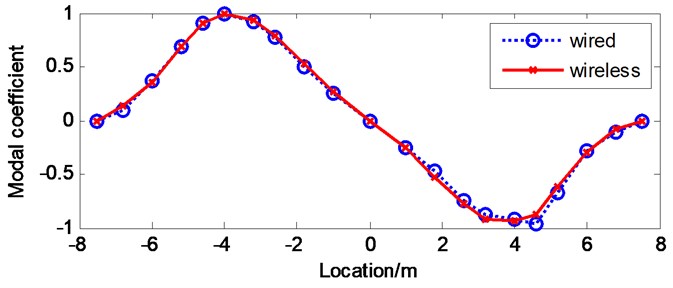
a) 1st vertical mode
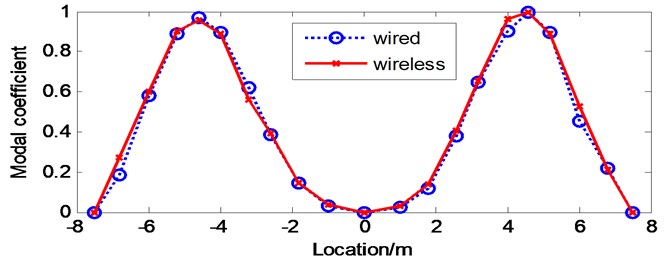
b) 2nd vertical mode
c) 3rd vertical mode
d) 4th vertical mode
Fig. 17First four vertical modal shapes of the bridge model by NExT/ERA
a) 1st vertical mode
b) 2nd vertical mode
c) 3rd vertical mode
d) 4th vertical mode
MAC value varies from 0 to 1, which are 0 for no correlation and 1 for full correlation. Tables 2 and 3 list the identified natural frequencies and their MAC values from the wireless test and the wired test by FDD and NExT/ERA, respectively. The results of system identification demonstrate that using both methods, wireless vibration measurement can provide reliable information on dynamic characteristics of the bridge model. It can be seen that higher values of MAC are found for the most significant modes, which demonstrates a good correlation between the wireless and wired test measured mode shapes. However, the higher order vertical bending modes of the bridge deck are associated to the relatively lower MAC values in NExT-ERA (0.8459 for 3rd mode and 0.8624 for 4th mode), which indicates the FDD method is more practical and efficient especially when applied to voluminous data from multi-channel measurement.
Table 2Identified natural frequencies of the bridge mode by FDD
Mode number | Natural frequency /Hz | MAC | |
Wired tests | Wireless tests | ||
1st vertical | 3.98 | 4.08 | 0.9972 |
2nd vertical | 8.60 | 8.63 | 0.9971 |
3rd vertical | 10.56 | 10.56 | 0.9834 |
4th vertical | 11.66 | 11.65 | 0.9830 |
Table 3Identified natural frequencies of the bridge mode by NExT/ERA
Mode number | Natural frequency /Hz | MAC | |
Wired tests | Wireless tests | ||
1st vertical | 3.96 | 4.09 | 0.9729 |
2nd vertical | 8.66 | 8.56 | 0.9325 |
3rd vertical | 10.56 | 10.50 | 0.8459 |
4th vertical | 11.65 | 11.70 | 0.8624 |
5. Conclusions
In this paper, we have described the design and deployment of a prototype wireless sensor network for structural dynamic monitoring applications. First, an extension board for the IRIS motes is designed for sensing acceleration from structural vibration. Second, software components are developed for the TinyOS operating system for reliable data collection. Third, validation of the sensor board has been successfully carried out on a vibration exciter. At last, the performance of the wireless sensor network is analyzed during the deployment on a cable-stayed bridge model. Modal parameters from two output-only system identification techniques are analyzed, and compared with the results from the wired testing counterparts, which revealed that the self-customized wireless sensor has good resolution. Despite the fact that the wireless data acquisition system needs more improvements, the results of validation experiments in this study confirm its feasibility as an alternative to the conventional wired counterpart.
References
-
Farrar C. R. Historical overview of structural health monitoring. Journal of Lecture Notes on Structural Health Monitoring Using Statistical Pattern Recognition, Los Alamos Dynamics, Los Alamos, NM, USA, 2001.
-
Celebi Mehmet Seismic instrumentation of buildings (with emphasis of federal buildings). Journal of Special GSA/USGS Project, An Administrative Report, No. 0-7460-68170, 2002.
-
Spencer F. B., Ruiz-Sandoval M., Kurata N. Smart sensing technology: opportunities and challenges. Journal of Structural Control and Health Monitoring, Vol. 11, Issue 4, 2004, p. 349-368.
-
Kurata N., Spencer J. B., Ruiz-Sandoval M., Miyamoto Y., Sako Y. A study on building risk monitoring using wireless sensor network MICA-Mote. First International Conference on Structural Health Monitoring and Intelligent Infrastructure, Tokyo, Japan, 2003, p. 353-363.
-
Crossbow Technology Inc., http://www.xbow.com.cn/
-
Paek J., Govindan R. RCRT: rate-controlled reliable transport protocol for wireless sensor networks. Journal of ACM Transactions on Sensor Networks, Vol. 7, Issue 3, 2010, p. 1-45.
-
Kim S., Pakzad S., Culler D., Demmel J., Fenves G., Glaset S., Turon M. Health monitoring of civil infrastructures using wireless sensor networks. Conference of Information Processing in Sensor Networks, 2007.
-
Zhou L. R., Yang O., Ou J. P. Design and analysis of laboratory health monitoring model of a long-span cable-stayed bridge. Proc. of the 20th National Compilation of Vibration and Noise of High Technology and Application Conference, 2007, p. 57-66.
-
Brincker R., Zhang L., Anderson P. Modal identification of output-only systems using frequency domain decomposition. Journal of Smart Materials and Structures, Vol. 10, Issue 3, 2001, p. 441-445.
-
Brincker R., Zhang L., Anderson P. Modal identification from ambient response using frequency domain decomposition. Proc. of the 18th International Modal Analysis Conference, San Antonio, TX, 2000.
-
Farrar C. R., James III G. H. System identification from ambient vibration measurements on a bridge. Journal of Sound and Vibration, Vol. 205, Issue 1, 1997, p. 1-18.
-
Asmussen J. C. Modal Analysis Based on the Random Decrement Technique Application to Civil Engineering Structures. Ph. D. Thesis, Aalborg University, Denmark, 1997.
-
Brehm M., Zabel V., Bucher C. An automatic mode pairing strategy using an enhanced modal assurance criterion based on modal strain energies. Journal of Sound and Vibration, Vol. 329, Issue 25, 2010, p. 5375-5392.
About this article
Financial supports from the National Science Foundation of China (No. 51108129), Shenzhen Fundamental Research Plan (No. JC201105160538A) and HIT Innovation Project (No. 2012301) to initiate this Research Project are greatly acknowledged.
