Abstract
In this article a methodology is presented to simulate the three components of seismograms, at low frequency (0-1.5 Hz). This method takes into account three characteristics of observed earthquake such as the frequency content, elastic response spectra and Arias Intensity at near source regime. A multi-taper method is employed for simulating seismogram aimed at accounting for the frequency content. The differences between response spectra, power spectral density and Arias Intensity corresponding to the recorded and simulated data are minimized through an optimization-based inversion solution technique. The proposed methodology is implemented to the 2003Bam scenario (Iran) as an example. The substantial large variance of Fourier spectral amplitudes corresponding to the two sets of seismograms as a main cause of time cost is discussed. Relatively good agreements between the synthetic and those of the predicted waveforms confirm the reliability of the proposed technique in modeling forward directivity effects at near source regime.
1. Introduction
Ground motions close to a ruptured fault are considerably different from those observed further away from the seismic source. The propagation of fault rupture toward a site at a velocity close to the shear wave velocity causes the most of seismic energy from the rupture to arrive in a single large long period pulse of motion called "forward directivity" [1, 2, 3, 4]. These types of ground motions are significantly influenced by a pulse at the beginning of the velocity time history [5]. Velocity pulses are typically aligned with the fault normal direction due to the radiation pattern. However, strong pulses may be present in the direction of fault parallel. Samples are; the 2003Bam (Iran) earthquake [6], the 1995-Hyogo-ken Nanbu earthquake in Japan [7], the Izmit earthquake in Turkey. Earthquake associated with directivity place extreme demands on structures and are known to have caused extensive damage in previous near source earthquakes [8]. Forward-directivity effects in a strike slip earthquake can be observed at all locations along the fault away from the hypocenter. Forward directivity effects in dip-slip earthquakes are concentrated in a limited region up-dip from the hypocenter [9]. Rupture directivity effects in current design codes are generally taken into account by modifications to the elastic acceleration response spectrum at 5 % damping ratio [2, 9]. There is still significant uncertainty in how to properly account for Forward Directivity Ground Motions (FDGMs). An example is the latest change of provision for near source earthquake time-history analysis embodied in the current standard building code of ASCE-7, 2010 (Chapter 16) [10]. The inadequacy of considering the response spectrum as a sole design criterion is obvious when nonlinear time history analysis is performed with time-histories which all match the same response spectrum [11]. Therefore, a time history representation of earthquake is better able to capture the effects of near-fault ground motions on the performance of structures (e.g. [11, 12, 13]). The phenomenon becomes more complicated at near source region particularly in regions with lack of sufficient data such as that under study. The main objectives of this study are summarized as follows: a) to present a methodology for simulating seismogram at near source site including the forward directivity effects and b) to simulate compatible seismogram with the observed waveforms in terms of frequency content. Due to spectral leakage substantially existing in Fourier amplitude spectrum corresponding to both signals, the well known Multi-Taper Method MTM [14] is employed to reduce the spectral leakages thus coming up with two sets of relatively smoothed data being possible for comparison purpose.
2. Spectral leakage problem and Multi-Taper Method (MTM)
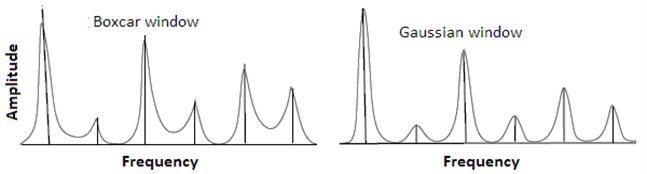
The inherently high dynamic ranges of seismic waveforms might result in seriously biased estimates on the account of spectral leakage. The frequency content with high amplitudes leaks into frequency regions with low amplitudes [15]. Power Spectral Density (PSD) uses boxcar window which has a central peak and many side lobes. A single peak is therefore spread across a range of frequencies with many spurious secondary peaks. Consequently windowing in time spreads the energy in the spectrum across a range of frequencies (see Fig. 1). It is possible to reduce the side lobes by changing the window function. Instead of using a boxcar window we can use some other function with a more favorable Fourier transform, one that has smaller or no side lobes. One example is the Gaussian window, which has no side lobes [16]. Eq. (1) and Eq. (2) denote Boxcar and Gaussian window function:
where is a desired constant, is the uniform distribution of for the interval :
where is the reciprocal of the standard deviation; and is a linearly spaced vector of length . Thomson [17] introduced a method named “multi-taper” using a family of orthogonal tapers which are resistant to spectral leakage. The estimated multi-Taper spectrum is strongly influenced by the choice of the taper calculated by Eq. (3) as a convolution of the taper transform and the true spectrum expresses as:
where is Nyquist frequency , is time interval of time-series, is spectral window, and are continuous frequency variables, is the power spectral density (PSD) of the time-series and is the expected mean denoted by . This procedure has been greatly utilized in the geophysical community and engineering seismology (e.g. [14, 15, 18]). A good taper would have a spectral window with low amplitudes whenever is enormous. The problem (bias) is known as spectral leakage and the goal is to minimize the leakage at frequency from frequencies where . For more details about multi-taper spectrum method please see the studies conducted by different researchers [19, 15, 20].
3. Synthesizing waveform methods
Different approaches are available in the literature for retrieving near field ground motion at the site of interest which may be categorized into: a) theoretical-based methods [21, 22, 23, 24, 25, 26]; b) semi empirical-based methods [18, 27, 28], and c) hybrid methods [6, 9, 29, 30]. We used the theoretical-based green’s function approach proposed by Michel Bouchon [21]. The wave-number integral, for any window, is achieved by adding an infinite set of specified circular sources, centered on the point source and distributed at equal radial intervals, to the particular point source. More details are found at Bouchon [21]. This method has been widely used in the context of near source seismogram simulation (see e.g. [31]).
Fig. 1PSD of a typical signal using Boxcar and Gaussian windows
4. Proposed methodology
A methodology consisting of an inversion solution technique is proposed for simulating compatible 3-D seismogram at near source regime. The well known Multi-Taper Spectral Analysis (MTSA) is employed by which the differences between the relatively smoothed power spectral density, response spectra, and Arias Intensity [32] corresponding to the observed and synthesized data are minimized via an evolutionary technique. To this end, a Genetic Algorithm (GA) is developed, as an optimization tool, through which the optimal source parameters are found within predefined ranges of data.
The MT parameters, time-bandwidth product (NW) and minimum effective eigentaper (K) associated with minimum signal energy loss are estimated through a number of trail-error tests. The Discrete Wave Number (DWN) method, originally introduced by Bouchon and Aki [33], was preferred to be employed as a theoretical-based Green’s function method for synthesizing waveforms with forward directivity effects. The slip time dependence used is a ramp function with a constant rise time [21]. This method has previously been used for synthesizing waveform at near source regime without accounting for the compatibility issue [34]. A MATLAB code is written putting together the previously discussed GA, the DWN, and the MTM. The successive steps of the proposed methodology are summarized in Fig. 2 and the algorithm is briefly explained hear. The developed MATLAB code including the GA technique is processed through thousands of data generation for minimizing the differences between the Muli-Tapered power spectra, response spectra, and Arias Intensity corresponding to the simulated and observed waveforms. Finally, the story ends up with obtaining the optimal model parameters.
4.1. Time bandwidth product (NW) and eigen-taper number (k)
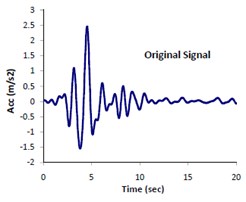
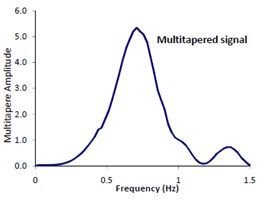
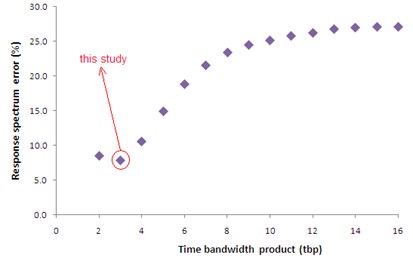
Based on the authors experiences and as is recommended by Prieto [35], appropriate time bandwidth (NW) and eigentaper number (K) are different for deferent problems. In order to estimate the most appropriate values of these two parameters, we performed a series of trial and error tests. The estimation procedure is as follows: A MATLAB code is written by which a selected signal (e.g. 1.5 Hz in our example as shown in Fig. 3a) is multi-tapered using MTM (see Fig. 3b). Then the multi-tapered signal is inversed back and compared with the original signal in time domain (see Fig. 3c). In the second step, the comparisons are made between elastic response spectra corresponding to the original and inversed signal. Eventually, the trial and error process ends up with finding the most appropriate parameters NW and k. Fig. 4 displays the plots of such trial and error story. The minimum error (i.e. the differences between elastic response spectra corresponding to the inversed and original signals) associated with the obtained parameters is virtually shown.
Fig. 2Successive steps of the proposed methodology
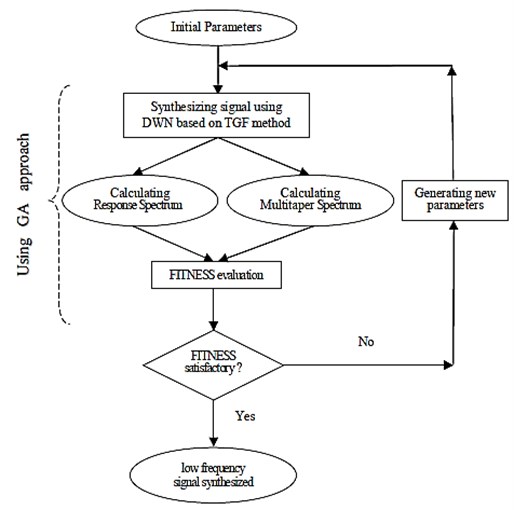
Fig. 3Presentation of original & multitapered signals: a) original signal, b) multitapered signal and c) comparison between the original signal and inversed multitapered signals
a)
b)
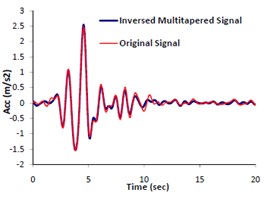
c)
Fig. 4Plots of error (differences between elastic response spectra corresponding to the original and inversed signals) versus time bandwidth product
4.2. GA technique
Among different methods of optimization techniques, the well known Genetic Algorithm (GA) approach is employed for optimally calculating the seismological parameters. Jimenez [36] applied the GA method in an inversion solution approach to find earthquake source parameters. For more details about inverse problem, see the research done by Royzman and Goroshko [37]. We developed a GA to minimize the differences between synthesized and recorded seismograms and also Arias Intensity (AI) thus obtaining the model parameters. The algorithm randomly selects the model parameter set from the predefined sets using the DWN method to simulate velocity at the site of interest. 14 model parameters, each with 8-bit chromosome were incorporated into the algorithm. The crossover and mutation rate were set to 0.9 and 0.1 respectively. Crossover and mutation points were selected randomly and the convergence criteria are defined as a) maximum no. of generation (1000) and b) the number of generations (50) through which the population is no longer improved and met a specific value. A fitness function is introduced, as objective function, by which the differences between response spectrum and multi-tapered form corresponding to the recorded and simulated waveforms are minimized. The comparison is carried out via three components (north and east components as horizontal and up-down as vertical). The proposed Fitness Function is defined as the inverse of Error Function (Eq. 4) expressed as:
where , and , are the response spectral amplitude and multi-taper spectral amplitude corresponding to the recorded and synthesized seismograms.
5. Example
The proposed methodology is implemented to the 2003Bam earthquake scenario (Iran) at Bam station, where is located at the sought eastern part of Iran, aimed at demonstrating its capability in simulating waveform at near source regime. As already mentioned, Bam station is the only near source station around the causative fault at which the main event has been recorded. Meanwhile, the main event has been observed at a few number of far source sites.
Fig. 5Perspective views from east to the central part of Bam fault system [42]
![Perspective views from east to the central part of Bam fault system [42]](https://static-01.extrica.com/articles/14556/14556-img7.jpg)
5.1. Site characterization
Bam is located in the eastern part of the Gowk fault and the western of the strike slip fault systems bordering the Lut desert [38]. The co-seismic surface ruptures and focal mechanisms of these earthquakes, together with their associated geomorphology, show the activity in this zone [39]. Despite mentioned earthquakes, there are no recorded earthquakes at Bam within the last hundred years. The citadel Arg-e Bam, which is one the biggest adobe buildings over the world was severely damaged [40, 41]. The earthquake scenario has been previously studied by many researchers (e.g. [34, 42]). Fig. 5 displays a perspective views from east to the central part of Bam fault system [42].
5.2. Site soil specification
The site soil condition at the 30 m upper layer of Bam station is reported by BHRC as shown in Fig. 6a. Nakamura [43] proposed 1 D Crustal model of P-wave velocity down to 50 km depth as this station as depicted in Fig. 6b. These reports were adopted for modeling the crustal and site soil amplification effects.
5.3. Long period seismogram simulation
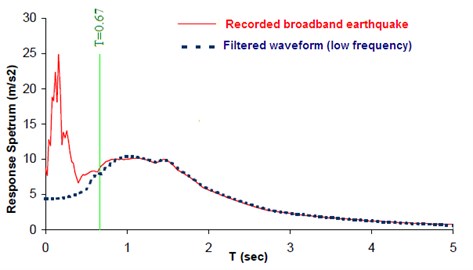
Forward directivity and fling step are known as the major effects of near source strong motions. Motions with long-period pulses can exhibit the dynamic consequences of the forward directivity and fling step [2, 1]. Based on the reasons already mentioned, in this article, the long-period (0-1.5 Hz) strong ground motions were simulated through the proposed framework. Fig. 7 illustrates the elastic response spectra corresponding to the observed seismogram at Bam station in broadband frequencies and that of the filtered form. The filtering effect, i.e. the selected frequencies (0-1.5 Hz) exhibiting forward directivity effects on the response spectrum is quite visible.
Fig. 6a) Site soil condition at the upper 30 m V-30, b) Crustal shear wave velocity
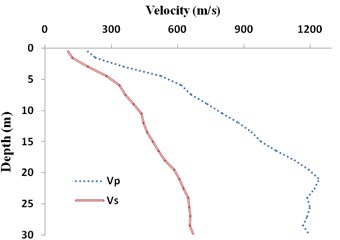
a) BHRC report
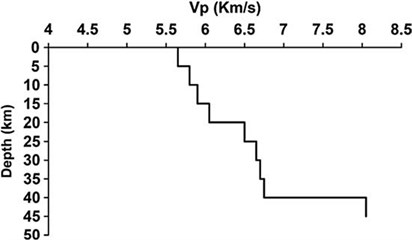
b) Nakamura et al. (2005)
Fig. 7Illustration of the selected frequency range (filtering) on response spectrum corresponding to the 2003Bam earthquake (low frequency: 0-1.5 Hz or T= 0.67 sec)
5.4. Results
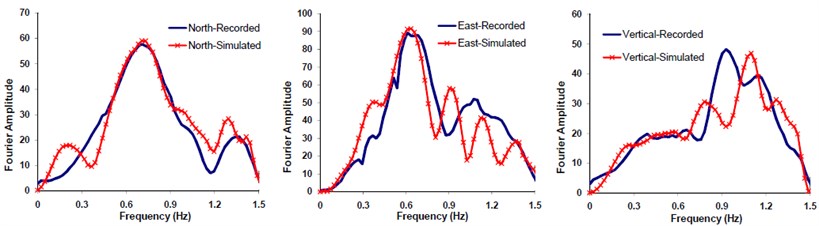
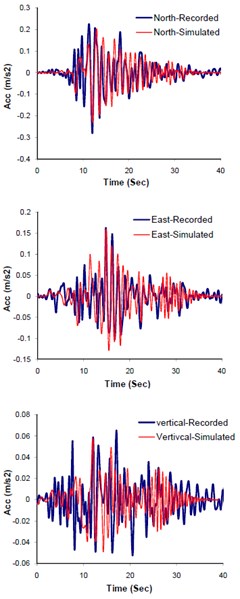
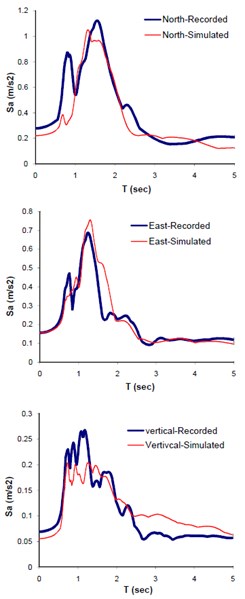
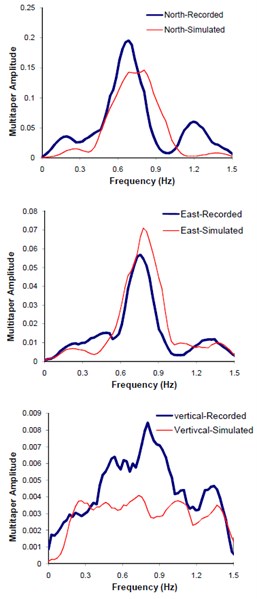
The input seismological model parameters were those previously suggested for Bam earthquake scenario by the other investigators in the form of upper-lower bounds (see Table 1). A two-segmented fault, as proposed by Nakamura [43], was modeled (see Fig. 12). The obtained optimal slip was 2.29 m and that of rise time 1.14 sec. The optimal model parameters were calculated through matching the three components of seismogram (north, east and vertical) at Bam station. Thousands back and forth waveform synthesizing processes have been done comparing the response spectra, PSDs, and AI corresponding to synthetic and observed data (see Table 2). Figs. 8a, b, and c show the comparison of the two sets of accelerations, response spectra and multi-taper spectral amplitude's forms. Fig. 9 illustrates the comparison between Fourier spectral amplitudes (FFTs) corresponding to the simulated and observed seismograms.
Fig. 8Comparison of the recorded and simulated: a) seismograms, b) response spectra, c) multi-tapered spectral amplitude's waveforms
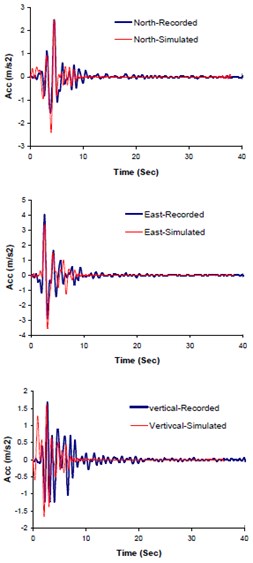
a) Seismograms
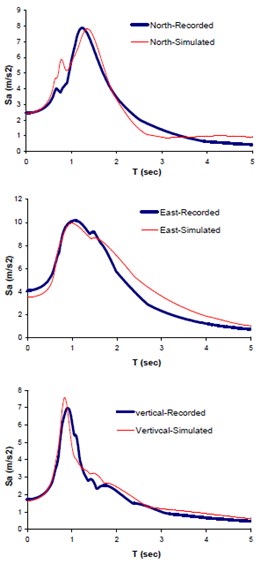
b) Elastic response spectra
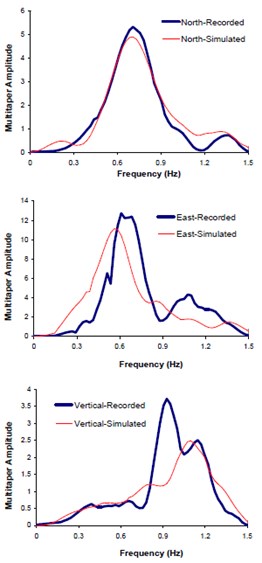
c) Multi-tapered waveforms
Fig. 9FFT comparisons of the Fourier spectral amplitudes corresponding to the recorded and simulated seismograms
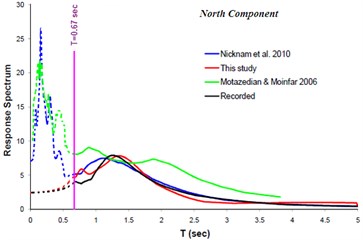
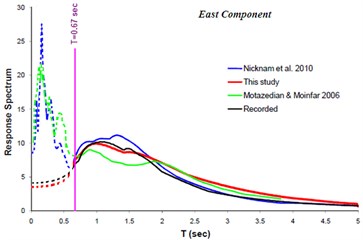
The result of implementing the proposed methodology is compared with those of the others [34, 44]. Fig. 10 and 11 show such comparison. The vertical pink line in the Fig. 11 represents the upper frequency limit used ( sec). The fault alignment resulting from this study and those of the other investigators are shown at Fig. 12.
Fig. 10Comparison of response spectra (North and East component) obtained from this study with those of the others
a)
b)
Fig. 11Comparison of response spectra (Vertical component) obtained from this study with those of the others. Better agreement between the observed and simulated data obtained from this study is visible
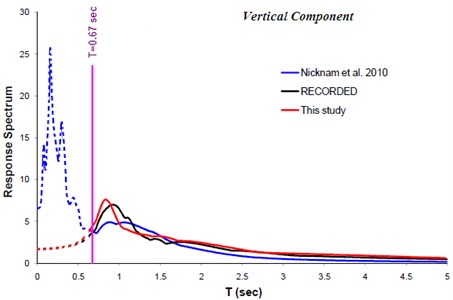
Table 1Comparison of seismological parameters obtained from this study and those of the others
Parameter | Funning et al., 2005 | Talebian et al., 2004 | NEIC | Nicknam et al., 2010 | This study |
Longitude (deg) | 58.353 | 58.294 | 58.266 | 58.353 | 58.356 |
Latitude (deg) | 29.037 | 28.972 | 29.010 | 29.032 | 29.03 |
Depth (km) | 5.2 | 6 | 14 | 7.0 | 7.1 |
Focal Mechanism (strike, dip, rake) | 354, 84, -178 | 357, 88, -166 | 174, 88, -178 | 358, 80, -170 | 356.91, 83.95, -177.87 |
Rupture length (km) | 12.0 | - | - | 13.9+6 | 15.9+2.3 |
Rupture width (km) | 8.1 | - | - | 8.7 | 9.8 |
Rupture velocity (m/s) | - | - | - | 2880 | 2953 |
Slip (m) | 2.20±0.04 | - | - | - | 2.29 |
Table 2Arias Intensities corresponding to the observed and simulated waveforms at Bam station
Arias intensity | North | East | Vertical |
Recorded | 0.7253 | 1.6637 | 0.5143 |
Simulated | 0.7240 | 1.4588 | 0.4127 |
Residual fitness value (error) (%) | 0.2 | 12.3 | 19.7 |
Fig. 12Plans showing the selected stations, Bam and Mohamad Abad, and estimated Bam fault alignment resulted from this study and those of the others
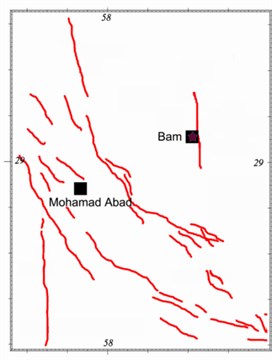
a) Location of Bam and Mohamad Abad stations
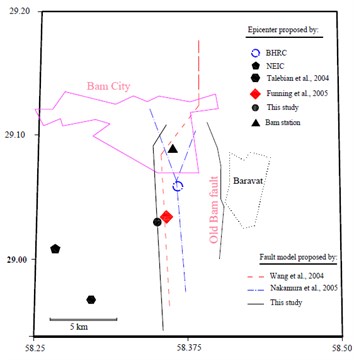
b) Location of fault alignments and epicenters
Fig. 13Comparison of the recorded and simulated seismograms, corresponding to response spectra and multi-tapered forms at Mohammad Abad station
a) Acceleration
b) Response Spectra
c) Multitapered PSD
5.5. Model validation and discussion
The obtained optimal model parameters were incorporated into the model and the three components of seismograms at Mohammad Abad station, located at 48 km away from the causative fault, were predicted. Fig. 13(a), (b), and (c) demonstrate the plots of comparing the three components simulated and observed seismograms, response spectra, and multi-taperd PSDs at this station respectively. The comparison between Fourier spectral amplitude forms (FFTs) of the observed and predicted waveforms are also shown in Fig. 14. The predicted seismograms at mohamad Abad station exhibit good agreement with those of the observed data. The model is significantly sensitive to the site soil information beneath the station. Relatively good agreement between results of this study and those of the observed data confirms the reliability of the proposed methodology in simulating compatible seismogram at near source regime. It is worth mentioning that, the residual error; representing the aleartory and epistemic uncertainties (e.g., see Figs. 13 and 14) in methods dealing with evolutionary-based techniques does not necessarily reflect the physical model parameters. Rather, they present the mathematical parameters corresponding to the best solution resulting from minimum defined fitness function. In conclusion, since the aforementioned problem is a matter of time cost, it can be solved within trade-off dealing between the expected accuracy and time cost. This is why we cut-off the frequencies above 1.5 Hz in our study. Nevertheless, this shortcoming can be compensated by hybrid method in which waveforms at low and high frequencies are individually produced and combined [6, 30].
Fig. 14Comparison of Fourier spectral amplitude forms corresponding to the recorded and simulated seismograms at Mohammad Abad station
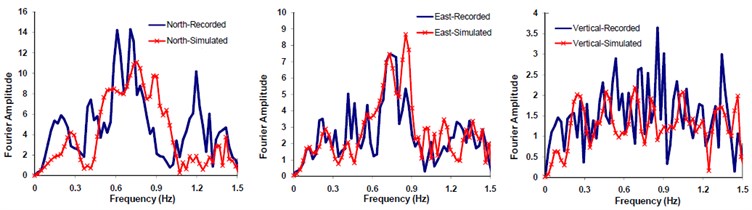
Fig. 15Demonstrating the variation of errors (in percent increment) against rise time and rupture velocity
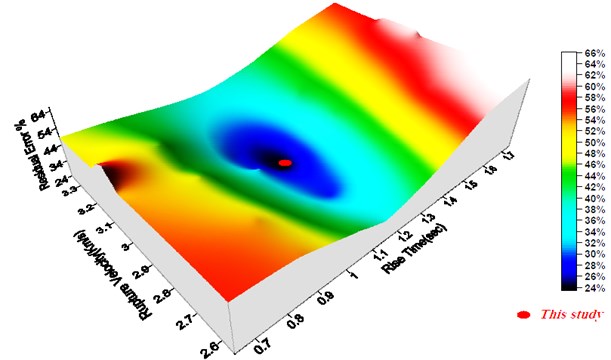
5.6. Sensitivity analysis of model parameters
A sensitivity analysis was performed aimed at recognizing how the defined fitness function (errors) is susceptible to the individual model parameters. To this end, the model parameter, e.g. rupture velocity and rise time, were changed and the corresponding errors, in the form of percent increment, were calculated keeping constant the other model parameter values. Fig. 15 displays the result of sensitivity analysis on the model parameters. As are seen the results of this study corresponds to the minimum errors confirming the reliability of the technique used.
6. Conclusion
We proposed a methodology to simulate seismogram, at low frequency (0-1.5), taking into account three characteristics of observed earthquake. There are; frequency content, elastic response spectra with 5 % damping ratio, and AI at near source regime. GA technique is used for minimizing the differences between response spectra, MSDs, and AIs corresponding to the simulated and observed data. An optimization-based inversion solution technique is used for this purpose. The optimal model parameters are obtained through finding the best solution. The well known MTM is employed for providing the simulated waveform compatible with those of the recorded data. The convergence problems associated with substantially large variance of Fourier spectral amplitudes corresponding to the velocity waveforms at near source regime were comprehensively discussed. The methodology was implemented to the 2003Bam scenario as an example. The results, in the form of three components of simulated and observed data at a near source site, were compared with those of the recorded data. Good agreements between response spectra, PSDs, and AIs confirmed the integrity of calibration stage. Thereafter, the seismograms at a far source site (48 Km faraway from causative fault) where has been less influenced by forward directivity were predicted incorporating the calibrated optimal model parameters. The results were compared with those of the recorded data. Relatively good agreements between; the response spectra corresponding to the synthetic and observed seismograms, PSDs, AIs, PGAs and PGVs confirm the reliability of the proposed methodology in modeling forward directivity. Furthermore, the results of this study were compared with those of the other investigators previously studied the Bam scenario. Finally, a sensitivity analysis on the variation of model parameters was performed. Again the results confirmed the reliability of the optimization approach in finding the best solution.
References
-
Lili X., Longjun X., Rodriguez-Marek A. Representation of near-fault pulse-type ground motions. Earthquake Engineering and Engineering Vibration, Vol. 4, Issue 2, 2005, p. 191-199.
-
Somerville P. G., Smith N. F., Graves R. W., Abrahamson N. A. Modification of empirical strong ground motion attenuation relations to include the amplitude and duration effects of rupture directivity. Seism. Res. Lett., Vol. 68, 1997, p. 199-222.
-
Somerville P. G., Pitarka A. Differences in earthquake source and ground motion characteristics between surface and buried faulting earthquakes. Eighth US National Conference on Earthquake Engineering, San Francisco, CA, 2006.
-
Archuleta R. J., Hartzell S. H. Effects of fault finiteness on near-source ground motion. Bull. Seism. Soc. Am., Vol. 71, 1981, p. 939-957.
-
Bray J. D., Rodriguez-Marek A. Characterization of forward-directivity ground motions in the near-fault region. Soil Dynamics and Earthquake Eng., Vol. 24, 2004, p. 815-828.
-
Nicknam A., Eslamian Y. A hybrid method for simulating near-source, broadband seismograms: application to the 2003Bam earthquake. Tectonophysics, Vol. 487, 2010, p. 46-58.
-
Furumura T., Koketsu K. Specic distribution of ground motion during the 1995 Kobe earthquake and its generation mechanism. Geophys. Res. Lett., Vol. 25, 1998, p. 785-788.
-
Kalkan E., Kunnath S. K. Effects of fling step and forward directivity on seismic response of buildings. Earthquake Spectra, Vol. 22, Issue 2, 2006, p. 367-390.
-
Somerville P. G. Magnitude scaling of the near fault rupture directivity pulse. Physics of the Earth and Planetary Interiors, Vol. 137, 2003, p. 201-212.
-
ASCE-7-10 (2010). Minimum Design Loads for Buildings and Other Structures. American Society of Civil Engineers.
-
Somerville P. G. Development of an improved representation of near-fault ground motions. SMIP98 Proceedings, Seminar on Utilization of Strong-Motion Data, Oakland, CA, California Division of Mines and Geology, Sacramento, CA, 1998, p. 1-20.
-
Alavi B., Krawinkler H. Consideration of near-fault ground motion effects in seismic design. Proceedings 12th World Conference on Earthquake Engineering, New Zealand, 2000.
-
Sasani M., Bertero V. V. Importance of severe pulse-type ground motions in performance-based engineering: historical and critical review. Proceedings of the 12th World Conference on Earthquake Engineering (12WCEE), Auckland, New Zealand, 2000.
-
Park J., Lindberg C. R., Vernon F. L. Multitaper spectral analysis of high-frequency seismograms. Journal of Geophysical Research, Vol. 92, 1987, p. 12675-12684.
-
Prieto G. A., Parker R. L., Thomson D. J., Vernon F. L., Graham R. L. Reducing the bias of multitaper spectrum estimates. Geophysical Journal International, Vol. 171, 2007, p. 1269-1281.
-
Percival D. B., Walden A. T. Spectral Analysis for Physical Applications: Multitaper and Conventional Univariate Techniques. Cambridge University Press, UK, 1993.
-
Thomson D. J. Spectrum estimation and harmonic analysis. Proceedings of the IEEE, Vol. 70, 1982, p. 1055-1096.
-
Nicknam A., Eslamian Y. An EGF-based methodology for predicting compatible seismograms in spectral domain using GA. Geophysical Journal Int., Vol. 185, 2011, p. 557-573.
-
Walden A. T. A Unified view of multitaper multivariate spectral estimation. Biometrika, Vol. 87, No. 4, 2000, p. 767-788.
-
Lepage K. Q. Some Advances in the Multitaper Method of Spectrum Estimation. Ph. D. dissertation, Queen’s University, 2009.
-
Bouchon M. A simple method to calculate Green’s functions for elastic layered media. Bulletin of the Seismology Society of America, Vol. 71, No. 4, 1981, p. 959-971.
-
Bouchon M. A Review of the discrete wavenumber method. Pure and Applied Geophysics, Vol. 160, 2003, p. 445-465.
-
Koketsu K., Miyake H. A seismological overview of long-period ground motion. J. Seismol., Vol. 12, 2008, p. 133-143.
-
Olson A. H., Apsel R. J. Finite faults and inversion theory with applications to the 1979 Imperial Valley earthquake. Bull. Seism. Soc. Am., Vol. 72, 1982, p. 1969-2001.
-
Graves R. Simulating seismic wave propagation in 3D elastic media using staggered-grid finite differences. Bull. Seismol. Soc. Amer., Vol. 86, 1996, p. 1091-1106.
-
Pitarka A., Irikura K., Iwata T., Sekiguchi H. Three-dimensional simulation of the near-fault ground motion for the 1995 Hyogoken Nanbu (Kobe) Japan earthquake. Bull. Seism. Soc. Am., Vol. 88, 1998, p. 428-440.
-
Heaton J. A. T., Pryse S. E., Kersley L. Improved background representation, ionosonde input and independent verification in experimental ionospheric tomography. Ann. Geophysicae, Vol. 13, 1995, p. 1297-1303.
-
Hutchings L., Ioannidou E., Foxall W., Voulgaris N. A physically based strong ground-motion prediction methodology; application to PSHA and the 1999 Mw = 6.0 Athens earthquake. Geophysical Journal International, Vol. 168, 2007, p. 659-680.
-
Graves R. W., Aagaard B. T., Hudnut K. W., Star L. M., Stewart J. P., Jordan T. H. Broadband simulations for Mw 7.8 southern San Andreas earthquakes: ground motion sensitivity to rupture speed. Geophysical Research Letters, Vol. 35, 2008, L22302.
-
Mai P. M., Beroza G. C. A hybrid method for calculating near-source, broadband seismograms: application to strong motion prediction. Phys. Earth Planet. Int., Vol. 137, Issue 1-4, 2003, p. 183-199.
-
Nicknam A., Abbasnia R., Eslamian Y., Bozorgnasab M. Extrapolating strong ground motion of Silakhor earthquake (ML 6.1), Iran, using EGF approach based on Genetic algorithm. Canadian Journal of Earth Sciences, Vol. 46, Issue 11, 2009, p. 801-810.
-
Arias A. A measure of earthquake intensity. In Seismic Design for Nuclear Power Plants (ed. R. J. Hansen), MIT Press, Cambridge, Massachusetts, 1970, p. 438-483.
-
Bouchon M., Aki K. Discrete wave number representation of seismic source wave fields. Bulletin of the Seismological Society of America, Vol. 67, 1977, p. 259-277.
-
Nicknam A., Abbasnia R., Bozorgnasab M., Eslamian Y. Synthesizing broadband time-histories at near source sites; case study, 2003 BamMw6.5 earthquake. Journal of Earthquake Engineering, Vol. 14, 2010, p. 898-917.
-
Prieto G. A., Parker R. L., Vernon F. L. A Fortran 90 library for multitaper spectrum analysis. Computers and Geosciences, Vol. 35, 2009, p. 1701-1710.
-
Jimenez A., Garcia M. J., Romacho M. D. Simultaneous inversion of source parameters and attenuation factor using genetic algorithm. Bull. Seism. Soc. Am., Vol. 95, Issue 4, 2005, p. 1401-1411.
-
Royzman V., Goroshko A. Multiple inverse problem. Journal of Vibroengineering, Vol. 14, Issue 3, 2012, p. 1417-1424.
-
Funning G. J., Parsons B., Wright T. J. Surface displacements and source parameters of the 2003 Bam (Iran) earthquake from Envisat advanced synthetic aperture radar imagery. Geophysical Research, Vol. 110, 2005, B09406, DOI: 10.1029/2004JB003338.
-
Jackson J., Bouchon M., Fielding E., Funning G., Ghorashi M., Hatzfeld D., Nazari H., Parsons B., Priestley K., Talebian M. Seismotectonic, rupture process, and earthquake-hazard aspects of the 2003 December 26 Bam, Iran, earthquake. Geophysical Journal International, Vol. 166, 2006, p. 1270-1292.
-
BHRC (Building and Housing Research Center). Iran Strong Motion Network (ISMN).
-
Talebian M., Fielding E. J., Funning G. J., Ghorashi M., Jackson J. A., Nazari H. The 2003Bam (Iran) earthquake: rupture of a blind strike-slip fault. Geophysical Research, Vol. 31, 2004, L11611.
-
Wang R., Xia Y., Grosser H., Wetzel H.-U., Kaufmann H., Zschau J. The 2003Bam (SE Iran) earthquake: precise source parameters from satellite radar interferometry. Geophysical Journal International, Vol. 159, 2004, p. 917-922.
-
Nakamura T., Suzuki S., Sadeghi H., Fatemi-Aghda S. M., Matsushima T. Source fault structure of the 2003Bam earthquake, southeastern Iran, inferred from the aftershock distribution and its relation to the heavily damaged area: existence of the Arg-e-Bam fault proposed. Geophysical Research Letters, Vol. 32, 2005, L09308.
-
Motazedian D., Moinfar A. Hybrid stochastic finite fault modeling of 2003, M6.5, Bam earthquake (Iran). Journal of Seismology, Vol. 10, 2006, p. 91-103.
About this article
The authors would like to thank Prof. Bouchon for kindly offering valuable simulation code.
