Abstract
Shock wave is an important damage element in ammunition explosion and one of the important technical indicators for evaluating its damage power. Accurately measuring shock wave pressure is of great significance for guiding ammunition design and evaluating damage power. The testing environment in the explosion field is harsh, and the measurement of shock wave pressure is affected by various influencing factors, resulting in inaccurate measurement results and low reliability. The location of pressure measurement points directly affects the measurement results of surface reflection pressure and free field pressure. This study is based on the display explosion dynamics simulation software AUTODYN to conduct simulation analysis of the propagation law of explosion shock wave pressure, analyze the height variation of the three wave point trajectory during the ammunition explosion process, and clarify that the surface reflection pressure measurement points need to be located in the Mach reflection zone, and the free field pressure measurement points need to be located above the height of the three wave points. The research results provide theoretical support for accurate testing of explosion shock wave pressure and have significant engineering application value.
1. Introduction
The measurement of explosion shock wave pressure mainly includes surface reflection pressure, free field pressure, total pressure, and dynamic pressure tests, with the main testing positions being surface reflection pressure and free field pressure. However, in actual testing, the measurement results of shock wave pressure are significantly influenced by the location of the measurement points, and there are significant differences in measurement results between different measurement point locations. Therefore, in order to accurately measure surface reflection pressure, it is necessary to clarify the physical significance of the measurement values at each measurement point location, in order to put forward reasonable requirements for the placement of pressure measurement points and standardize shock wave pressure testing.
At present, domestic and foreign researchers have conducted some research on shock wave pressure testing in explosive fields and achieved certain research results. For example, Cheinet et al. [1] from the Aberdeen Ballistic Research Laboratory in the United States conducted research on the height variation law of the three wave points in the explosion field and provided the Mach rod height variation law under typical working conditions. The experiment shows that the lower the height of the explosion center, the faster the reflection of the incident shock wave, and the higher the height of the Mach rod. In 2018, Bakerm et al. [2] of the Saint Louis Institute in France and Germany used high-speed photography to study the three wave point trajectories of C-4 explosives under different equivalent and core height conditions while studying shock wave pressure prediction models. They found that as the core height increased and the TNT dosage decreased, the three wave point trajectories gradually approached the ground. The shock wave pressure curve measured above the trajectory of the three wave points will have two pressure peaks, namely the incident pressure and the surface reflection pressure. Guo et al. [3] installed free field pressure sensors at different heights from the ground and surface reflection pressure sensors at corresponding positions on the ground to study the variation law of three wave point heights and the differences between free field pressure test results and surface reflection pressure test results at different positions above and below the three wave point heights. In 2014, Du et al. [4] conducted an analysis on the distribution law of near ground explosion shock waves in the air and on the ground, provided empirical formulas for calculating pressure peaks, and fitted the variation law of the height of the three wave points of near ground explosion shock waves based on literature records. The pressure propagation characteristics of air and ground shock waves were verified through measured data and theoretical simulation. In 2015, Zhang et al. [5] used the display explosion dynamics simulation software AUTODYN to simulate and analyze the height variation law of the three wave points, and found that the relative error between the simulation calculation results of the medium and far fields and the measured data was relatively small. In 2021, Xu [6] and Tang [7] used AUTODYN to establish a simulation model for the measured environment in a 1:1 ratio. They simulated the charge quality, detonation method, and aspect ratio, obtained the variation law of the height of the shock wave pressure three wave points, and summarized the relationship between the height of the three wave points and the above parameters. In 2022, Xi et al. [8] constructed a geometric constraint relationship for the three wave points based on the mirror image method to study the trajectory changes of the three wave points in the shockwave flow field of near ground air explosions. They combined the LAMB model and polynomial fitting method to obtain a trajectory prediction model for the three wave points.
This study used the explosion display dynamics simulation software AUTODYN to conduct finite element numerical simulation analysis of the propagation law of shock wave pressure in the explosion field, clarifying the distribution law of shock wave pressure propagation, analyzing the height variation law of the three wave point trajectory, and based on this, proposing the location of surface reflection pressure and free field pressure measurement points, providing a reliable theoretical basis for accurate measurement of shock wave pressure in the explosion field.
2. Analysis of measurement point layout position
2.1. Analysis of the location of surface reflection pressure measurement points
To analyze the impact of sensor placement on pressure measurement results, AUTODYN was used for simulation analysis. Taking the TNT charge mass of 30 kg, aspect ratio of 1:1, explosion height of 1.5 m, and center initiation as an example, the distance between the explosion centers of the surface reflection pressure measurement points is 0 m-18 m, and one measurement point is set every 0.5 m. To save computational time and resources, a two-dimensional axisymmetric numerical simulation model was established, and the established finite element numerical simulation model is shown in Fig. 1.
Fig. 1Finite element numerical simulation
In the model shown in Fig. 1, air is described using the ideal gas state equation [9]. The energy density of the air is 2.068×10⁵ J/kg, and the functional relationship between the air pressure and the energy density is:
where is the air density after compression or expansion; is the initial density of air, and the air density 1.225 kg/m3 under standard atmospheric pressure; is the adiabatic index, usually taken as 1.4.
The TNT explosive products are described using the JWL equation of state, as shown in Eq. (2) [10]:
where, represents pressure, represents volume, represents internal energy, and represent material parameters, , , and are constant, and the parameters are listed in Table 1.
Table 1JWL state equation parameters
Material parameters | / kPa | / kPa | |||
TNT | 3.74×10⁸ | 3.75×10⁶ | 4.15 | 0.9 | 0.35 |
The surface material is a tabia, and its state equation [11] is:
where, and are the pressures in the final and initial states, respectively; is the density of the final state of solid particles; is the sound velocity of solid particles, = 4500 m/s; and are a constant. Usually, the parameters of the composite material are listed in Table 2 [12].
Table 2Material parameters of tabia
/ g×cm-3 | / GPa | / GPa | / GPa | / GPa | / GPa | |||
1.8 | 6.39×10⁻⁴ | 0.3 | 3.4×10⁻¹³ | 7.0×10⁻⁷ | 0.30 | 6.9×10⁻⁸ | 0 | 0.104 |
–0.016 | –0.192 | –0.22 | –0.246 | –0.271 | –0.283 | –0.29 | –0.4 | |
/ GPa | / GPa | / GPa | / GPa | / GPa | / GPa | / GPa | / GPa | |
0.0004 | 0.006 | 0.0012 | 0.002 | 0.004 | 0.006 | 0.008 | 0.004 |
The shock wave pressure curves at different blast center distances are shown in Fig. 2, and the cloud diagram of shock wave pressure evolution at different times is shown in Fig. 3.
From Figs. 2 and 3 analysis shows that when the surface reflection pressure measurement point is located directly below the explosion center (with a distance of 0 m from the explosion center), the pressure curve has multiple peaks and the pressure signal is disordered. The reason is that the explosive products near the explosion core are complex, the shock wave pressure formed at the initial moment of the explosion is unstable, and the collected shock wave pressure signal is irregular. As the distance between the measuring points increases, the pressure curve gradually becomes smooth and regular. When the distance between the explosion center is 6.5 m, the collected pressure curve only has one peak, which is a typical shock wave pressure signal. At this time, the measured shock wave pressure is the Mach rod pressure. Moreover, considering the high peak pressure of the shock wave directly below the explosion center and the high temperature generated by the explosion, placing the surface reflection pressure sensor in this area during testing will directly lead to damage to the pressure sensor and poor reliability of the measurement results. Therefore, in surface reflection pressure measurement, sensors should be avoided as much as possible in the normal reflection zone, ensuring that the placement position is within the Mach reflection zone, indicating that the sensor placement position needs to be at a certain distance from the explosion center.
Fig. 2Shock wave pressure curve at different blast center distances
a) Explosion center distance of 0 m
b) Explosion center distance of 1.5 m
c) Explosion center distance of 2.5 m
d) Explosion center distance of 3.5 m
e) Explosion center distance of 6.5 m
f) Explosion center distance of 8.0 m
Fig. 3Cloud chart of shock wave pressure evolution
a) 0.4 ms
b) 0.4 ms
c) 1.6 ms
d) 2.8 ms
e) 4.5 ms

f) 6.0 ms
2.2. Analysis of the location of free field pressure measurement points
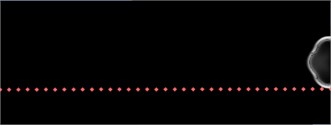
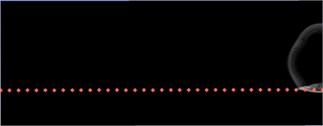
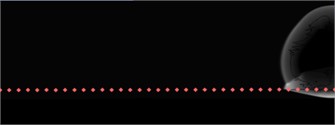
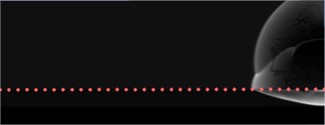
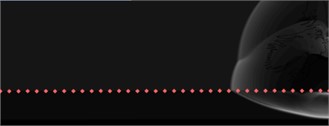
Due to the presence of three wave points during the ammunition explosion process, the placement position of the free field pressure sensor will change due to changes in the height of the three wave points. Only when the pressure sensor is located above the height of the three wave points can the incident shock wave pressure be accurately collected. Taking 30 kg TNT, aspect ratio 1:1, detonation height of 1.5 m, and center detonation as an example, the cloud diagram of shock wave pressure evolution at different times after detonation is shown in Fig. 4.
Fig. 4Cloud chart of shock wave pressure evolution at different times of 30 kg TNT
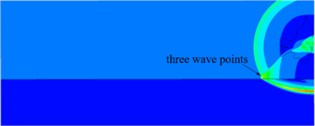
a) 2.200 ms
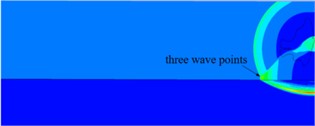
b) 3.001 ms
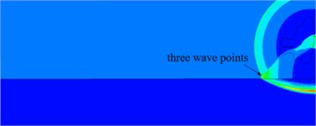
c) 3.951ms
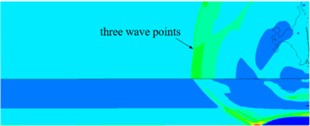
d) 5.252 ms
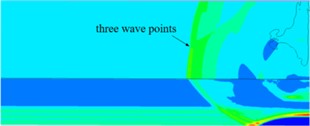
e) 6.800 ms
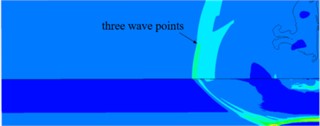
f) 10.80 ms
At the initial moment of the explosion, the shock wave front extends outward in the form of spherical waves, and when the incident shock wave contacts the ground, it reflects, producing a reflected shock wave front. Over time, Mach waves are formed at the intersection of the incident shock wave front and the reflected shock wave front. Mach waves, incident shock waves, and reflected shock waves intersect to form three wave points. The height variation pattern of the three wave points can be intuitively obtained from Fig. 4. As time goes on, the height of the three wave points continues to rise. The area located below the height of the three wave points is the Mach reflection zone, and the pressure in this area is the pressure of the Mach rod. The free field pressure measurement collects the incident shock wave pressure, so the free field pressure sensor needs to be placed above the three-wave point trajectory.
3. Conclusions
This study used the explosion display dynamics simulation software AYUTODYN to carry out finite element numerical simulation of the propagation law of shock wave pressure in the explosion field, clarifying the distribution characteristics of shock wave pressure on the surface and in free space, analyzing the trajectory changes of the height of the three wave points, and proposing that the surface reflection pressure measurement points should be located within the Mach reflection zone, and the free field pressure measurement points should be arranged above the height of the three wave points. The research results provide reliable theoretical support for accurate testing of ammunition explosion shock wave pressure and have important engineering application value.
References
-
S. Cheinet et al., “An experimental study of the atmospheric-driven variability of impulse sounds,” The Journal of the Acoustical Society of America, Vol. 144, No. 2, pp. 822–840, Aug. 2018, https://doi.org/10.1121/1.5047750
-
M. T. Baker et al., “Acute assessment of traumatic brain injury and post-traumatic stress after exposure to a deployment-related explosive blast,” Military Medicine, Vol. 183, No. 11-12, pp. e555–e563, Nov. 2018, https://doi.org/10.1093/milmed/usy100
-
W. Guo, T. C. Yu, Z. L. Li, and X. J. Feng, “Dynamic calibration of sensitivity of shock wave pressure sensors,” Chinese Journal of Explosives and Propellants, Vol. 29, No. 3, pp. 62–64, 2006.
-
H. M. Du, X. Y. Cao, Z. W. He, and L. Xue, “Analysis and verification of the characteristics of shock waves in the air and on the ground during near ground explosions,” Journal of Missile and Guidance, Vol. 34, No. 4, pp. 65–68, 2014.
-
X. L. Zhang, T. Zhang, and Z. M. Wang, “Numerical simulation of three wave points in an AUTODYN explosion field,” Journal of Sichuan Ordnance Engineering, Vol. 36, No. 3, pp. 17–19, 2015, https://doi.org/10.1007/s12043-023-02555-8.pdf
-
C. D. Xu and L. Q. Wang, “Research on the influence of three wave points on shock wave pressure testing in an explosive field,” Journal of Testing Technology, Vol. 35, No. 5, pp. 369–374, 2021.
-
Y. K. Tang and D. R. Kong, “Numerical simulation study of three wave point trajectories in TNT Explosive Explosion Field,” Journal of Testing Technology, Vol. 35, No. 4, pp. 352–357, 2021.
-
H. Z. Xi, D. R. Kong, Y. Q. Peng, S. M. Zhang, Q. Shi, and G. G. Le, “A trajectory prediction method for three wave points in the shockwave flow field of near ground air explosions,” Journal of Explosives, Vol. 44, No. 4, pp. 514–520, 2021.
-
Y. Çengel and M. Kanoğlu, “A new entropy function to analyze isentropic processes of ideal gases with variable specific heats,” Entropy, Vol. 24, No. 6, p. 746, May 2022, https://doi.org/10.3390/e24060746
-
Q. Zhong, B. L. Wang, J. Huang, and J. M. Hui, “Similarity law of TNT airborne explosion overpressure,” Journal of Pyrotechnics, Vol. 33, No. 4, pp. 32–35, 2010.
-
L. Wang, F. Shang, and K. Deren, “Effect of sensor installation angle on measurement of explosion shock wave pressure,” Measurement Science and Technology, Vol. 33, No. 11, p. 115023, Nov. 2022, https://doi.org/10.1088/1361-6501/ac88eb
-
J. Chen and S. M. Olson, “Closure to “SHANSEP-Based interpretation of over consolidation effect on monotonic shearing resistance of contractive nonplastic soils” by Jiarui Chen and Scott M. Olson,” Journal of Geotechnical and Geoenvironmental Engineering, Vol. 147, No. 12, p. 07022026, 2022.
About this article

The authors have not disclosed any funding.
The datasets generated during and/or analyzed during the current study are available from the corresponding author on reasonable request.
The authors declare that they have no conflict of interest.
