Abstract
Explosion shock wave pressure is one of the main damage parameters produced in the process of ammunition explosion, and it is also an important technical index to evaluate the damage power of ammunition. However, in the actual testing process, only a limited amount of shockwave pressure data at specific measuring points can be obtained, which cannot accurately reflect the distribution laws of the shockwave pressure propagation after the ammunition explosion. Therefore, it is particularly important to conduct reconstruction of the shockwave pressure field distribution laws based on limited measuring point data. This paper reviews the research work and related achievements obtained by researchers at home and abroad on the reconstruction of shockwave pressure distribution laws in explosion fields. The paper also elucidates the relevant application of computer tomography imaging techniques, shockwave propagation attenuation model reconstruction, and various interpolation algorithms in the reconstruction process of the shockwave pressure field. Given the current research situation both domestically and internationally, we have pinpointed the major issues that still exist in the current stage of research and proposed the key areas of focus that need attention in future research.
Highlights
- he paper summarizes the relevant reconstruction methods of shock wave pressure in explosion fields, providing highly condensed reference materials for researchers.
- In response to the current research status both domestically and internationally, combined with the problems encountered in actual engineering testing, there are still relevant issues in the reconstruction process of the pressure propagation distribution law of explosion shock waves.
- Based on the existing problems in the current reconstruction process, it is proposed that machine learning and deep learning algorithms can be used in subsequent research to reconstruct the propagation and distribution of shock wave pressure in explosive fields, providing a new research approach.
1. Introduction
During the process of ammunition explosion, various destructive parameters are generated, such as shock waves, high-temperature fireballs, seismic waves, and shrapnel [1]. Among them, shockwaves are one of the primary destructive parameters, and also one of the main technical indicators for evaluating the destructive power of ammunition. The accurate acquisition of shockwave pressure data at different measuring points after ammunition explosion is very important for a comprehensive understanding of the propagation and distribution laws of shockwave pressure [2-3]. However, during actual testing, due to the interference of various influencing factors such as the testing layout scheme, the number of sensors, and the characteristics of the site environment, only a limited number of measuring points can be set to obtain the changes in shockwave pressure at some measuring points [4-5]. In addition, the sensors may be damaged by fragments and flying stones generated by the ammunition explosion during the actual testing process, which reduces the obtained shockwave pressure data and makes the already limited testing data further reduced, resulting in the inability to accurately analyze the distribution laws of shockwave pressure after ammunition explosion [6]. Therefore, conducting research on the reconstruction of the shockwave pressure field based on the limited shockwave pressure data obtained from measuring points is particularly important. The reconstruction results can provide powerful data support for the evaluation of ammunition’s destructive power and the design of ammunition.
During initial explosion, ammunition produces high-temperature and high-pressure explosion products. The product propagates outwards from the center of the explosion at an extremely high velocity, and during its propagation, it strongly compresses the air propagation medium in contact with it, forming a locally high-pressure region - the initial shockwave [7-8]. The initial shockwave is a strong shock front, and its velocity is much higher than the velocity of the interface between the explosion product and air, resulting in the separation of the shockwave and explosion product. During the propagation of the shockwave, the front of the wave moves at supersonic speed, and the tail of the positive pressure zone moves at the speed of sound corresponding to the pressure , resulting in the widening of the positive pressure zone as the shockwave propagates. The typical process of explosion shockwave pressure propagation is shown in Fig. 1 [9-10].
Fig. 1Typical shock wave pressure propagation process
As the shockwave propagates in the air, its pressure and propagation velocity parameters swiftly decrease [11]. This is because the energy per unit area on the shockwave front rapidly decreases even without other energy losses as the wave front expands with the increase of propagation distance. Furthermore, the spread of the positive pressure zone of the shockwave continuously widens with distance, resulting in the growth of compressed air volume and the decrease in average air energy per unit mass. Lastly, the shockwave propagation process is an irreversible process with an increase in entropy on the wave front. During this process, there is always irreversible energy loss due to adiabatic compression caused by air impact [12]. The shockwave front pressure decay rate is high in the initial stage but slows down as the wave propagates. After a certain distance of propagation, the shockwave decays into sound wave. The typical curve of shockwave front pressure variation with respect to time is shown in Fig. 2 [13].
Fig. 2Pressure attenuation in typical shock wave pressure propagation
From the above-mentioned attenuation curve of blast shock wave pressure propagating in air, it can be seen that the pressure attenuation curve can effectively reflect the rise time of shock wave pressure, positive/negative pressure peaks, positive/negative pressure duration, specific impulse, shock wave energy, and attenuation coefficient of pressure curve. These parameters can effectively characterize the propagation distribution pattern of blast shock wave pressure and are of great significance for reconstructing the distribution pattern of the blast shock wave pressure field.
As shown in Fig. 2, the process of explosion shockwave’s initial rapid rise, long-lasting positive pressure effect, and relatively slow pressure decay [14-15]. Therefore, the requirements for the performance indicators of the sensors in actual testing are relatively high, which to some extent leads to a low effective acquisition rate of shockwave pressure data. Therefore, it is necessary to conduct research on the reconstruction of shockwave pressure distribution laws for the shockwave pressure data obtained during the process of ammunition explosion. Currently, the reconstruction research on the distribution laws of explosion shockwave pressure mainly focuses on interpolating and refining the limited shockwave pressure data obtained from the finite element numerical simulation and actual testing processes at limited measuring points, refining the distribution law of the shockwave pressure data with distance, and then carrying out trend fitting on the refined data to obtain the shockwave pressure data at other measuring points, thus achieving the reconstruction research of the distribution laws of the explosion shockwave pressure.
2. Research on shock wave pressure reconstruction method of explosion field
Through analysis of current research data, it has been discovered that both domestic and international researchers have made progress in studying the reconstruction technology of the propagation and distribution of shock wave pressure in explosion fields, achieving some notable research accomplishments. Through statistical analysis of relevant literature, shock wave pressure propagation and distribution rule reconstruction research in explosion fields can be classified into three categories based on reconstruction methods and principles. These categories are: the application of travel-time tomography imaging technology in the reconstruction research of shock wave pressure distribution rules, reconstruction research of shock wave pressure propagation attenuation models, and the application of various interpolation algorithms in the process of reconstructing shock wave pressure distribution rules.
2.1. Application of travel time tomography in reconstruction of shock wave pressure distribution
The basis of travel time tomography imaging technology is the Radon transform, which integrates the function defined on a two-dimensional plane along a straight line with a distance of d from the origin and a directional angle of . The resulting image function is the Radon transform of the function . In the process of reconstructing the blast shock wave pressure field, the Radon transform can be expressed as follows.
Assuming that the shock wave generated by the explosion of explosives in an infinite free field is a continuous velocity field, and the wave propagates along a straight line in the process of propagation in the air, the travel time can be expressed as a function of velocity and geometric path, as shown in Eq. (1) [16]:
where is travel time, which is the time it takes for the shock wave front to propagate to the sensor node; is the speed; is slowness (reciprocal of speed); is the ray path from the explosion point to the sensor, and is the distance increment along the ray path .
Assume that the test area is divided into grid elements, discretize Eq. (1), as shown in Fig. 3.
Then the projection data of the ray is shown in Eq. (2):
where is the travel time of ray , which is the time when the shock wave front reaches the sensor ; is the slowness in grid ; is the ray length of the ray in the grid; is the number of rays, which is the number of sensors; is the number of grids divided.
Fig. 3Schematic diagram of discrete model grid structure
The above Eq. (2) can be further rewritten into the matrix form in Eq. (3):
where is the projection matrix, is the slowness vector, and is the measurement travel time vector.
It is known that the peak pressure of the shock wave and the propagation velocity v of the shock wave front have the following functional relationship, as shown in Eq. (4). According to the ray path and the travel time information obtained by the sensor, the velocity within each grid can be reconstructed, allowing for the distribution of shock wave pressure fields to be determined [17]:
where, is the initial temperature of the surrounding environment, in K; is the atmospheric pressure of the surrounding environment, in kPa. The standard atmospheric pressure is 101.325 kPa. The conversion relationship between Kelvin temperature and Celsius temperature is shown in Eq. (4):
The Rankine-Hugoniot equation [18] is used to describe the relationship between shock wave overpressure and velocity, as shown in Eq. (6):
where is the Mach number of the shock wave relative to the air flow in front of the wave, is the propagation velocity of the shock wave front, is the velocity of the wave front medium itself, is the sound velocity of the air sheet in the test environment, is the peak overpressure, is the adiabatic coefficient of air, and is the atmospheric pressure in the test environment. The relationship between shock wave velocity and pressure can be obtained by introducing into Eq. (6) [19]:
By combining the propagation velocity function of the shock wave front in Eq. (7) with the calculation formula for the propagation velocity of the shock wave front in Eq. (4), it is possible to reconstruct the distribution rules of shock wave pressure propagation after ammunition explosion.
After analyzing existing relevant literature both domestically and internationally, some research has been conducted using computer-based travel-time tomography imaging technology in the reconstruction of shock wave pressure propagation distribution rules in explosion fields, yielding significant research accomplishments. For example, Guo Y. L. et al. [20] failed to fully reflect the distribution law in the process of shock wave propagation and the limitations of the existing empirical formula for calculating the peak pressure of shock wave. They adopted networked testing technology to acquire signals of shock wave pressure changes over time, based on computer tomography imaging technology [21, 22], utilized the generalized inverse inversion algorithm to obtain inverse calculation results, and combined weighted techniques for fine adjustment and optimization, in order to accurately invert the propagation speed of the explosive shock wave. According to the relationship between peak overpressure and velocity, the distribution of shock wave pressure field can be calculated. The distribution model of shock wave pressure propagation velocity in the explosion field constructed by them using this algorithm is shown in Fig. 4(a). The distribution rule of shock wave pressure calculated based on the velocity field distribution model is shown in Fig. 4(b).
Fig. 4Reconstruction results of shock wave velocity and pressure fields in explosion fields
a) Shock wave velocity model
b) Reconstruction results of shock wave pressure field
The above-mentioned method was utilized to reconstruct the distribution rules of shock wave pressure fields in cases where the acquired explosion shock wave pressure data was insufficient. The relative deviation between the reconstructed results and the actual test results was within 5 %, far superior to the calculation accuracy of existing shock wave pressure calculation formulas. This demonstrated the effectiveness of the inversion algorithm in the reconstruction of shock wave pressure fields in explosion fields.
Bai M. M. et al. [23] obtained the arrival time of the peak explosion shock wave pressure by analyzing and extracting the characteristics of the shock wave pressure signal acquired by each sensor array. Then, the travel time tomography technology is used to reconstruct the propagation velocity of the shock wave front of each grid unit in the test area. Finally, according to the relationship between the velocity and the peak value of the shock wave pressure, the velocity value of each grid is converted into the overpressure value, thus making up for the shortcomings of limited number of sensors and less useful shock wave pressure signals obtained during the actual test [24-26]. Thus, the peak value of shock wave pressure on the whole two-dimensional plane can be reconstructed, and the peak value of underwater explosion shock wave pressure can be reconstructed. In the reconstruction process, the initial velocity distribution model and the velocity distribution model obtained by variable grid inversion based on prior experience are shown in Fig. 5. By analyzing Fig. 5(a) and (b), it can be seen that when only adaptive clustering is performed on the original grid without adding prior information, the reconstruction speed field is a standard square, resulting in large reconstruction error and low reconstruction accuracy; The velocity field distribution law obtained by using a variable grid technique based on prior experience is smoother at the corners and more in line with the distribution law of shock wave pressure, resulting in higher reconstruction accuracy.
Fig. 5Velocity distribution model of explosion shock wave front
a) Initial model velocity field distribution
b) Inverted velocity field distribution
Wang F. et al. [27] proposed an OSEM (Ordered Subset Expectation Maximization) inversion algorithm based on prior information, which can accelerate the convergence speed, reduce the operation time, and improve the reconstruction accuracy of shock wave pressure field. The basic mathematical model of the traditional OSEM inversion algorithm is shown in Eq. (8):
Set the reconstructed image size to . There are 360 projection angles and n projection rays at each angle. The projection data is divided into T ordered subsets according to the projection angle. The iteration equation of OSEM algorithm is as shown in Eq. (9). represents the first subset, 1, 2,..., :
Then, the velocity field is inversed by using the travel time tomography method combined with the shock wave pressure transmission characteristics, so as to realize the reconstruction of the explosion shock wave pressure field. The reconstructed shock wave pressure field velocity distribution model is shown in Fig. 6. Therefore, it can be seen that the OSEM algorithm has less computational error when dealing with the underdetermined problem of incomplete data calculation. The use of this algorithm for the reconstruction of shock wave pressure propagation distribution rules in explosion fields results in greater accuracy and provides more scientifically supported data for the assessment of ammunition explosion damage and lethality.
Fig. 6Reconstruction results of shock wave pressure distribution law
2.2. Reconstruction research on shock wave pressure propagation attenuation models
The main goal of testing shock wave pressure in explosion fields is to obtain a curve showing the attenuation of shock wave pressure over time. If the whole process reconstruction of the shock wave pressure curve in the process of ammunition explosion can be carried out, the distribution law of the shock wave pressure in a certain range can be obtained. Based on the above analysis, some researchers have studied the attenuation curve model of shock wave pressure with time, and established the whole process calculation function relationship of the attenuation law of shock wave pressure propagation with a certain calculation accuracy. Relevant research is as follows: Luo A. M. et al. [28] obtained the formula for the attenuation curve of shock wave overpressure in Fuel Air Explosive (FAE) using a nonlinear adaptive fitting method based on the calculation formula of TNT (Trinitrotoluene) spherical explosive overpressure in an infinite air medium. The equation is shown in Eq. (10):
where is the shock wave pressure, in kPa, is the mass of TNT explosive, in kg, and is the distance from the measuring point to the explosion center, in m.
They analyzed the law of energy release during the explosion of FAE fuel explosive and TNT explosive, inverted the complete reaction degree of combustible element components in FAE fuel, and the possible reaction mode of metal fuel components in FAE fuel, providing a new research method for the design of FAE explosive.
Zhang X. G. et al. [29], based on the research on the propagation characteristics of shock wave pressure, selected the post shock wave attenuation waveform containing the most shock wave information in the shock wave pressure data as the main research object for analysis. First, the limited shock wave pressure test data are divided into two categories: modeling data (used to build the shock wave pressure field reconstruction model) and verification data (used to verify the shock wave pressure field reconstruction model). Then extract the post shock wave attenuation curve from the modeling data, and use nonlinear regression theory and multivariate polynomial interpolation algorithm to process the post shock wave attenuation curve to obtain the attenuation coefficient, pressure peak, positive pressure action time and other parameters of each curve. Use the “black box” theory to find the relationship between these parameters, thus achieving the reconstruction research of the shock wave pressure field. The reconstruction results show that the reconstructed shock wave pressure waveform is in good agreement with the measured waveform. Yao Y. et al. [30, 31] utilized the Gauss-Newton algorithm to perform nonlinear regression on the measured shock wave pressure curve. The global optimal solution for the coefficients was obtained using the Zippel interpolation algorithm. The attenuation coefficient and overpressure peak of the shock wave pressure curve at unknown measurement points were inverted, and then the shock wave pressure curve was reconstructed. Based on the reconstructed shock wave pressure curve, the distribution pattern of explosion shock wave pressure was reconstructed. The average errors of the pressure peak, positive pressure duration, and specific impulse, which are three characterization parameters, between the reconstructed results and the measured results were all less than 17 %, indicating that this method can provide a more accurate evaluation of the distribution pattern of shock wave pressure when the pressure peak of the shock wave is greater than 0.3 MPa.
Xue Z. Q. et al. [32] carried out reconstruction research on free field shock wave pressure time history curve during ammunition explosion. According to the explosion similarity law, a scaling parameter is introduced, and the existing calculation formula for shock wave pressure peak in a free field is modified based on it. The established modified formula relationship is shown in Eq. (11):
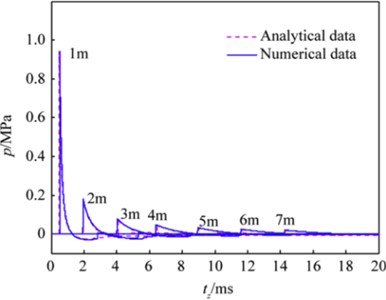
To verify the accuracy of the established free field shockwave pressure correction function relationship, a finite element numerical simulation study of the propagation distribution law of explosive shock wave pressure was carried out using the explosion dynamics simulation software AUTODYN with a 5 kg TNT explosive. Using the shock wave pressure time history curve obtained from the measurement points at distances of 1-7 m from the explosion center and the shockwave pressure time history curve reconstructed using the aforementioned free field shockwave pressure correction function relationship, the finite element numerical simulation obtained shock wave pressure curves and the corrected function relationship calculated shockwave pressure curves are compared. The shock wave pressure curves obtained from the reconstructed correction function relationship has a very high degree of coincidence with the pressure curves obtained from the finite element numerical simulation, as shown in Fig. 7. Analysis of the two types of shock wave pressure curves in Fig. 7 shows that the established correction function relationship can accurately reflect the propagation and attenuation laws of the free field shock wave pressure, thus having significant importance in the reconstruction of the shock wave pressure field.
Fig. 7Reconstruction of shock wave pressure curve by numerical simulation machine
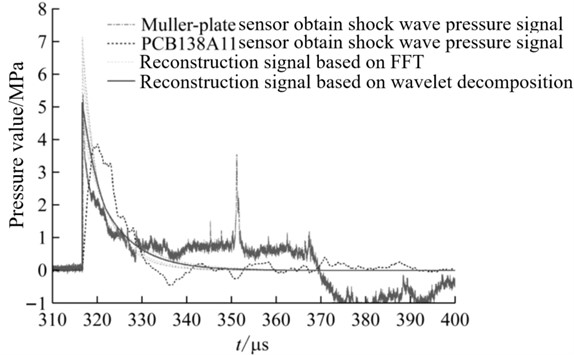
Xie Y. et al. [33] analyzed the process of shock wave waveform formation and proposed a shock wave pressure waveform reconstruction method based on the Parseval time-frequency energy conservation law and using the multi-scale wavelet decomposition method. The reconstruction algorithm mainly focuses on analyzing the peak value of the pressure curve and the energy of the explosive shock wave. The mathematical expression of waveform reconstruction principle is shown in Eq. (12):
where is the peak pressure of shock wave, and are shock wave energy. Use the above reconstruction method to reconstruct the explosion shock wave pressure curve, and compare it with the waveform obtained by the Müller-plate needle pressure sensor. The waveform comparison results are shown in Fig. 8. From the time history curve of shock wave pressure, it can be seen that the reconstructed signal based on multi-scale wavelet decomposition is closer to the real waveform. Therefore, it shows that the waveform reconstruction algorithm based on multi-scale wavelet decomposition is more stable and more accurate than the reconstruction algorithm based on Fourier transform.
Fig. 8Comparison chart of shock wave pressure curve
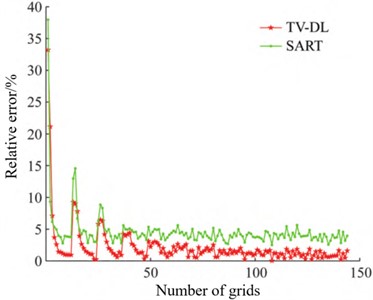
Yan X. L. et al. [34] proposed a shock wave overpressure field reconstruction method based on TV (Total Variation) minimization joint dictionary learning to improve the imaging effect under the condition of incomplete projection data of single projection angle. Combining the advantages of compressed sensing in sparse constraint and TV regularization method in optimizing the edge information of shock wave overpressure fields, the level of detail representation for internal information (such as pressure peak, positive pressure duration, specific impulse, and attenuation coefficient of shock wave pressure curve) of the overpressure field is improved through dictionary learning method, enabling the reconstruction of shock wave pressure field using fewer pressure data. By comparing this algorithm with SART (Simultaneous Algebraic Reconstruction Technique) reconstruction algorithm, the reconstruction accuracy of TV-DL (Total Variation Denoising-based Dictionary Learning) method is significantly improved, its RMSE (Root Mean Square Error) value is reduced by nearly 40 m/s, and the relative error in each grid is reduced by 2.5 %. The relative error curve of the two reconstruction results is shown in Fig. 9. Therefore, this reconstruction method is more efficient and has certain theoretical and engineering application value in areas such as weapon and ammunition damage assessment and engineering protection.
Fig. 9Relative error between reconstruction results of two algorithms
Based on AUTODYN software, Qi N [35] conducted finite element numerical simulation of shock wave pressure during ammunition explosion and obtained shock wave pressure data at different measuring point locations. Using Newton interpolation, radial basis function interpolation, and MQ quasi-interpolation algorithms, research was conducted on the distribution rules of shock wave pressure propagation in near-surface explosions, and the reconstruction accuracy of the three methods was analyzed. The results showed that the MQ quasi-interpolation algorithm had the smallest reconstruction error and the best reconstruction effect. The definition of the MQ quasi interpolation approximation format [36] function is shown in Eq. (13):
The functional expression of is shown in Eq. (14):
where, is the shape parameter.
However, since the selection of shape parameter in MQ quasi interpolation algorithm has a great impact on the reconstruction effect, the standard particle swarm optimization algorithm is used to optimize the value of shape parameter to solve the optimal , which further improves the reconstruction effect of MQ quasi interpolation algorithm.
Based on the calculation formula of shock wave pressure in a free field for static detonation, Lv Z. J. et al. [37] added terms for explosive motion and shock wave wall reflection to construct a pressure calculation formula for ground reflection in dynamic explosion. The fitness function in the genetic algorithm was constructed based on the pressure calculation function derived from the new formula, and the dynamic explosion overpressure field was reconstructed by combining measured shock wave pressure data with the dynamic explosion shock wave pressure calculation formula. The derived calculation formulas for normal-oblique reflection area shock wave pressure and Mach reflection area shock wave pressure are shown in Eq. (15):
The dynamic explosion pressure field is reconstructed using the shock wave pressure data obtained from the dynamic explosion test, and the reconstruction results are shown in the following Fig. 10.
Fig. 10Contour line of pressure distribution law of dynamic explosion shock wave
According to the reconstruction results of the distribution law of the dynamic explosion shock wave pressure field mentioned above, it can be seen that due to the influence of the explosive motion velocity on the dynamic explosion shock wave pressure field, the dynamic explosion shock wave pressure field does not have central symmetry like the static explosion shock wave pressure field, but has a certain deviation in the direction of the explosive motion velocity. When the obtained surface reflection pressure test data is limited and the distribution range is insufficient, this method can reconstruct the distribution pattern of dynamic explosion surface reflection pressure within a certain area. The research results provide a reliable reconstruction method for the study of the distribution law of dynamic explosion shock wave pressure field in ammunition, and have significant engineering application value.
2.3. Application of various interpolation algorithms in the distribution law of explosion shock wave pressure propagation
In the process of actual ammunition explosion shock wave pressure testing, we obtain the distribution law of shock wave pressure at corresponding positions by setting pressure monitoring points within a certain testing range. The common measurement systems for shock wave pressure in explosive fields is shown in Fig. 11.
Fig. 11Schematic diagram of shock wave pressure measurement system structure
The shock wave pressure measurement system mainly consists of shock wave pressure sensors, sensor installation components, data collectors, high-precision synchronous trigger controllers, terminal computers, and signal transmission cables. The sensor transmits the variation pattern of shock wave pressure in the form of an electrical signal to the data collector; The high-precision synchronous trigger controller is responsible for providing trigger signals to the data collector, ensuring that the data collector can collect data in a timely manner after ammunition explosion; The terminal computer saves and processes the signals collected by the data collector into the final required pressure signal.
In the actual testing process, it is necessary to consider the number of sensors installed and the manpower and material resources consumed during the sensor installation process. Usually, shock wave pressure sensors can only be installed at the testing distance that needs to be focused on to obtain pressure data. When it is necessary to obtain the shock wave pressure signal at the measuring point location where no pressure sensor is installed within the test range, the existing test data can be directly expanded by using the corresponding interpolation algorithm, so as to obtain the shock wave pressure data at the distance of the required measuring point, which greatly reduces the time and manpower, material resources and financial resources required for retesting.
In the process of explosion shock wave pressure reconstruction, the commonly used interpolation algorithms for the interpolation of shock wave pressure data under limited measuring points include Newton interpolation algorithm, radial basis interpolation algorithm, MQ quasi interpolation algorithm, cubic interpolation algorithm, least square method, Delaunay triangulation method, etc. [38-43]. At present, some researchers use different kinds of data interpolation algorithms to reconstruct the distribution of explosion shock wave pressure. For example, Bai M. M. et al. [44] put forward algebraic reconstruction method, joint iterative reconstruction method, joint algebraic reconstruction method and expectation maximization algorithm, and simulated and compared the four algorithms. The results show that the expectation maximization algorithm has higher reconstruction accuracy and faster speed than other algorithms. This algorithm can be used to guide field construction in the actual explosion process of ammunition and save test funds. With the continuous development of reconstruction calculation, Bai M. M. et al. [45] proposed an EM (Expectation-Maximization) inversion algorithm based on prior information. The iterative formula of the EM inversion algorithm is shown in Eq. (17):
where, the calculation function of can be expressed as Eq. (18):
When it is applied to solve the underdetermined equation of the inversion problem, it can be transformed into Eq. (19):
Using the algorithms mentioned above, the velocity model of the pressure of the explosive shock wave was inverted and reconstructed. The resulting distribution model of the wavefront propagation velocity of the shock wave is shown in Fig. 12(a) and (b).
Fig. 12Velocity distribution model of shock wave front obtained by EM algorithm inversion
a) Initial velocity field distribution model
b) Inversion velocity field distribution model
Analyzing the above inverted velocity distribution model reveals that the algorithm’s results are relatively stable and can well reflect the distribution law of pressure propagation during the explosive shock wave’s propagation process. This algorithm is slow in calculation and requires large storage space, but it can still provide useful reference value for tomography with a single tomographic excitation source.
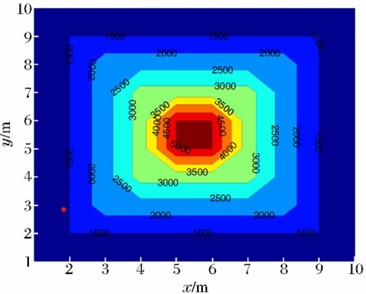
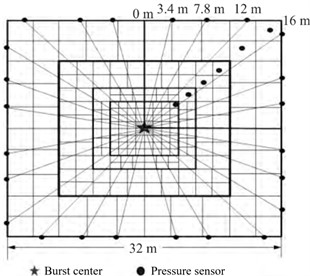
Guo Y. L. et al. [46] proposed a slow inference algorithm based on weighted generalized theory. This algorithm takes the explosion center as the center point and optimizes the installation position of the sensor. The explosion center and sensor positions are shown in Fig. 13(a), and the obtained data is used to reconstruct the distribution pattern of the shock wave pressure field. This method overcomes the influence of inaccurate shock wave propagation velocity and insufficient measurement data in previous reconstruction methods on the accuracy of reconstruction results. Using this algorithm to reconstruct the pressure field distribution of the explosive shock wave, the reconstruction results are shown in Fig. 13(b). Comparing the reconstruction results with the measured shock wave pressure test data, it was found that the two have a very high degree of coincidence, so the algorithm greatly improves the calculation accuracy of the shock wave pressure in a limited area.
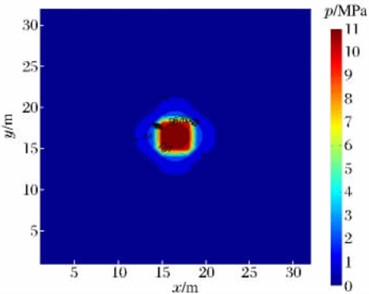
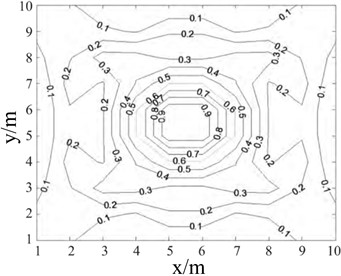
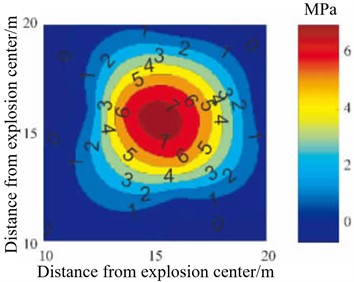
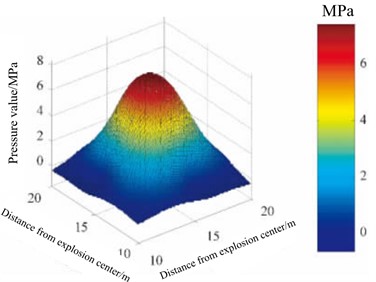
Liang Z. G. et al. [47] proposed a conic fitting algorithm for the calculation of the semi sinusoidal shock wave peak value. The peak value is obtained by intercepting part of the peak waveform and fitting calculation, which is simple and convergent, and the fitting effect can be judged by fitting the residual effective value. This method directly uses raw data calculation without the need for filtering, which can obtain more objective and accurate results. Feng H. et al. [48] designed a distributed shock wave pressure test system consisting of multiple test nodes using storage test technology. The system adopts a sensor lattice with a rise time of microseconds, which can quickly respond to the transient shock wave pressure signal. To reduce the dynamic response error of the measurement system in the test process, the dynamic calibration of the measurement system was carried out by using a shock tube. In the static explosion test, the peak value of explosion shock wave pressure acquired by the sensor lattice is reconstructed using cubic spline interpolation algorithm. The distribution rule of the reconstructed shock wave pressure field is shown in Fig. 14(a) and (b). The test results show that the distribution error of the reconstructed shock wave pressure is less than 2 %, which greatly improves the calculation accuracy of the existing calculation function of explosion shock wave pressure.
Fig. 13Sensor layout and reconstruction results of shock wave pressure
a) Burst core and sensor position
b) Reconstruction results of shock wave pressure field
Fig. 14Reconstruction results of explosion shock wave pressure field
a) Contour diagram of shock wave pressure distribution
b) Three dimensional curved surface of shock wave pressure distribution
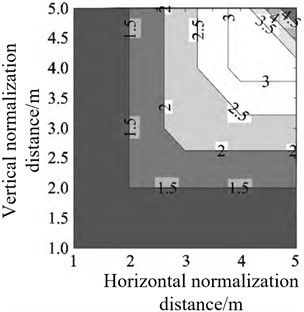
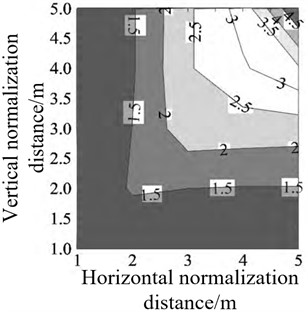
When reconstructing the distribution law of shock wave pressure in the explosion field, it is crucial to use the minimum number of sensors to achieve the highest accuracy in reconstructing the pressure distribution law of the explosive shock wave. To solve this problem in the current inversion algorithm, Bai M. M. et al. [49] proposed a reasonable sensor layout scheme. First, a multi-scale grid model of the subregion is established according to the explosion shock wave propagation law. Then, the genetic algorithm is used for global search, and the optimal layout scheme of sensors that meet the four indicators (eigenvalue, condition number, ray density and ray orthogonality) is selected. Finally, MATLAB is used for simulation experiment analysis, and the change law and reconstruction accuracy of the four indicators under different sensor layout modes are analyzed. The optimal layout of the shock wave pressure sensor in the explosion field is obtained, as shown in Fig. 15(a), the optimal ray distribution density is shown in Fig. 15(b).
Fig. 15Optimized layout structure of blast wave pressure sensor in explosion field
a) Pressure sensor reconstruction layout
b) Optimal sensor layout ray distribution density
It can be seen from the above analysis that when the same number of shock wave pressure sensors are used for layout, the ray path matrix of the measuring points should be distributed in full rank as far as possible, which can reduce the number of conditions of the equation, thus improving the ray density, making the solution of the equation more stable, and improving the reconstruction accuracy of the shock wave pressure distribution law. If the rank distribution is not satisfied, the sensor position can be fine tuned according to the maximum linear independence of the ray path matrix, so as to achieve the optimal position. In the actual test process, the shock wave pressure data obtained by deploying sensors in this way can greatly improve the reconstruction accuracy of the shock wave pressure field.
Fig. 16Reconstruction results of shock wave pressure distribution in explosion field
a) Contour diagram of shock wave pressure distribution
b) Three dimensional curved surface of shock wave pressure distribution
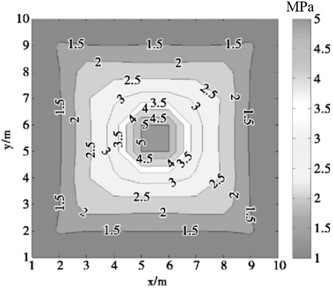
Yang, Z. et al. [50] addressed the limitations of the empirical formulas for shock wave overpressure due to insufficient number of measurement points, and the low accuracy of numerical simulations, which makes it difficult to fully understand the propagation process of shock wave pressure. By using B-spline (basic spline) interpolation algorithm, the shock wave pressure data obtained from finite element numerical simulation and measured test are interpolated and refined, and the distribution law of shock wave pressure field is reconstructed on this basis. The algorithm is compared with empirical formula, least square method and Delaunay triangulation method, and the results show that the B-spline interpolation algorithm is optimal. Based on the measured data of shock wave pressure in the process of actual ammunition explosion, the distribution law of explosion shock wave pressure is reconstructed, and the reconstructed contour map and three-dimensional surface of shock wave pressure distribution are obtained, as shown in Fig. 16(a) and (b), and compared with the actual test results, it is found that the error between the reconstruction results and the measured results is less than 4.5 %.
Zhao H. B. et al. [51] proposed a shock wave pressure field reconstruction method based on non-uniform rational B-spline (NURBS) “cobweb” interpolation to solve the problem that the complete pressure field can not be directly obtained in the process of shock wave pressure test and the fitting method of common shock wave pressure data is not suitable for shock wave test. The shock wave pressure distribution law reconstructed by this method has no “flat” effect in the central area, and changes violently. It conforms to the distribution characteristics of the shock wave pressure at the explosion center during the ammunition explosion. It is more reliable for the pressure value estimation near the explosion center. The reconstruction results of the distribution law of explosion shock wave pressure using this algorithm are shown in Fig. 17(a) and (b). The accuracy of the proposed reconstruction algorithm is verified by using the measured data, and the maximum relative error of the method is less than 9 %, and the average relative error is less than 3.94 %. Therefore, this method can accurately reconstruct the distribution of shock wave pressure in the explosion field.
Fig. 17Reconstruction results of shock wave pressure distribution in explosion field
a) Contour diagram of shock wave pressure distribution
b) Comparison chart of measured values and reconstructed values
To obtain the distribution law of shock wave pressure in a certain range on the ground during ammunition explosion, Yao W. B. et al. [52] used the peak attenuation law of shock wave on the propagation path and constructed a polynomial fitting function for the peak attenuation near the ground using the least squares method. They then used the polynomial-constrained bi-harmonic spline surface interpolation algorithm (IBSSIA) with radial interpolation to achieve interpolation that conforms to the law of shock wave propagation and ensures the convergence of data interpolation. The model of explosion shock wave pressure distribution law constructed by the above method is shown in Fig. 18(a), (b) and (c). From the reconstructed curve surface of shock wave pressure distribution, it can be seen that the reconstructed shock wave pressure distribution law has a high degree of agreement with the explosion image obtained in the actual ammunition explosion process.
Liu S. X. et al. [53] proposed a streamline (SLB) based particle image velocimetry (PIV) data pressure reconstruction method. Compared with the traditional spatial integration method, this method has great potential to reduce the error propagation in supersonic flow, reducing the computational cost and operational difficulty. The SLB method is used to reconstruct the shock wave pressure propagation process, as shown in Fig. 19(a). The calculation accuracy of the algorithm is verified by the actual test. The relative error between the calculation result and the reconstruction result is shown in Fig. 19(b). From the comparison results, it can be seen that SLB method has very good robustness and high calculation accuracy in the process of supersonic shock wave propagation.
Fig. 18Reconstruction of shock wave pressure distribution results with IBSSIA algorithm
a) Reconstruction of shock wave pressure distribution surface
b) Reconstruction of shock wave pressure distribution contour
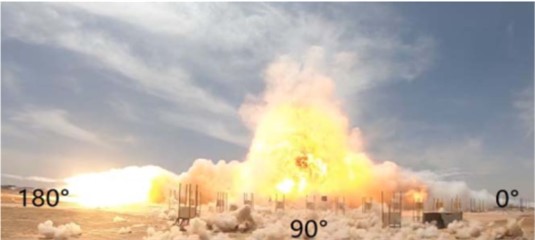
c) Ammunition explosion image actually obtained
Fig. 19Reconstruction of shock wave pressure distribution by SLB method
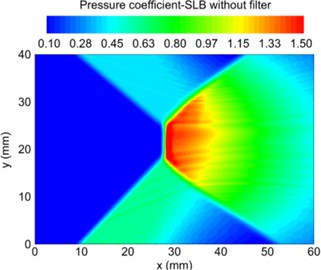
a) Reconstruction of shock wave pressure distribution nephogram
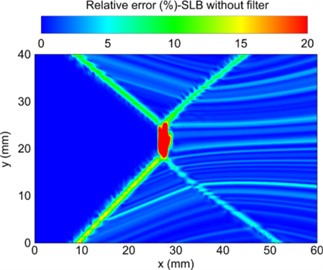
b) Relative error between calculation result and reconstruction result
3. Problems in current research
Based on the analysis above, it can be concluded that the current research on reconstructing the distribution of shock wave pressure in blast fields mainly focuses on reconstructing the propagation speed distribution model of the blast shock wave front. Then, based on the relationship between the propagation speed and the peak pressure of the shock wave front, the speed distribution model is converted into a pressure distribution model in order to reconstruct the distribution of blast shock wave pressure propagation in a certain area. Regarding the current domestic and foreign research status, and combined with the problems encountered in actual engineering testing processes, the following issues still exist in the research of reconstructing the distribution of blast shock wave pressure propagation.
(1) The research on the attenuation mechanism of explosion shock wave pressure propagation is not thorough enough. At present, the reconstruction algorithm research on the propagation and distribution of explosion shock wave pressure is based on the existing calculation models of shock wave pressure velocity and peak pressure, these models are established for TNT explosive. With the continuous development of high-energy explosive technology, further verification is needed to determine if the attenuation law of blast shock wave pressure propagation in new types of explosives satisfies such a functional relationship. In subsequent research, it is essential to explore in-depth the corresponding relationship between the peak attenuation rate of shock wave pressure during the propagation process in air and the explosion time following ammunition explosion. This plays a crucial role in accurately reconstructing shock wave pressure-time curves.
(2) There is no explicit basis for selecting a refined interpolation algorithm for blast shock wave pressure data under limited measurement points. Generally, several commonly used interpolation algorithms are compared, and the one that is closest to the actual test data is selected. As it is not possible to compare all interpolation algorithms in the interpolation process, the selected interpolation algorithms are likely not the most suitable. Therefore, it is necessary to establish certain norms for the selection of interpolation algorithms. When the interpolation data satisfies certain characteristics, a specific type of interpolation algorithm can be directly selected, which not only saves the time required to select the optimal interpolation algorithm but also improves the accuracy of data interpolation.
(3) In the process of reconstructing blast shock wave pressure, only the spatial location is considered while ignoring the temporal distribution of shock wave propagation. Currently, most of the research on the reconstruction of the distribution of blast shock wave pressure propagation focuses on the reconstruction of pressure peaks in the plane area within a certain distance from the epicenter. During the reconstruction process, the impact of explosion time on the distribution pattern of shock wave pressure propagation is completely ignored, resulting in the reconstructed shock wave pressure distribution only being able to obtain the peak pressure and is unable to capture the entire pressure variation pattern at a specific measurement point.
4. Key directions of follow-up research
Due to the special testing environment of blast shock wave pressure and the practical limitations of only being able to set a limited number of measurement points during testing, the effective acquisition rate of blast shock wave pressure data is low. This causes difficulty in accurately evaluating the destructive power of ammunition and guiding the design of ammunition with the small amount of acquired shock wave pressure data. Therefore, it is necessary to conduct research on the propagation distribution of shock wave pressure based on limited measurement point data. During the reconstruction of the distribution pattern of blast shock wave pressure, the layout of sensors during actual testing, the choice of data interpolation algorithms, the impact of explosion time on shock wave pressure and the reconstruction model of pressure field distribution pattern need to be considered comprehensively. By using the most effective data, the reconstruction results of the propagation distribution pattern of blast shock wave pressure can be improved, such that the reconstructed shock wave pressure field can characterize and analyze the distribution pattern of shock wave pressure during actual ammunition explosion under certain predictive accuracy conditions. In subsequent research, machine learning and deep learning algorithms can be used to study the propagation distribution pattern of blast shock wave pressure in the blast field. This can reduce the number of actual testing and accurately study the distribution pattern of shock wave pressure after ammunition explosion, greatly reducing the human and material resources required for evaluating ammunition destructive power.
References
-
L. Q. Wang, F. Shang, and J. W. Zhang, “Research on numerical simulation experiment of high explosive damage power,” (in Chinese), Journal of Testing Technology, Vol. 29, No. 2, pp. 6–11, 2021, https://doi.org/10.3969/j.issn.1671-7449.2021.01.002
-
L. Q. Wang, F. Shang, and D. R. Kong, “Numerical simulation analysis of static and dynamic explosion shock wave,” (in Chinese), Journal of Weapon Equipment Engineering, Vol. 41, No. 12, pp. 208–213, 2020.
-
L. Q. Wang and D. R. Kong, “Overview of the impact of terrain environment on shock wave propagation,” (in Chinese), Foreign Electronic Measurement Technology, Vol. 41, No. 5, pp. 68–75, 2022, https://doi.org/10.19652/j.cnki.femt.2203709
-
J. Zu, T. H. Ma, and D. X. Pei, Dynamic Testing of New Concepts. (in Chinese), Beijing: National Defense Industry Press, 2016.
-
Y. Deng, X. G. Tao, and J. Zhao, “Research on fast algorithm of explosion shock wave propagation in complex tunnels,” (in Chinese), Journal of Underground Space and Engineering, Vol. 18, No. 4, pp. 1127–1137, 2022.
-
R. H. Ma, B. Jia, and L. Yang, “The influence of tunnel section shape on the propagation law of explosion shock wave,” (in Chinese), Journal of Weapon Equipment Engineering, Vol. 43, No. 2, pp. 92–96, 2022.
-
X. F. Chen, X. C. Huang, and Q. B. Dou, “Calculation method of explosion shock load in engineering analysis,” (in Chinese), Strength and Environment, Vol. 47, No. 1, pp. 26–32, 2020, https://doi.org/10.19447/j.cnki.11-1773/v.2020.01.004
-
T. Mizukaki, A. Kato, and M. Mori, “Fundamental study on blast simulator for blast injury research,” Science and Technology of Energetic Materials, Vol. 81, No. 1, pp. 17–23, 2020.
-
Y. F. Jia, C. Q. Zhang, and J. Kang, “Explosion shock wave signal test and wavelet analysis,” (in Chinese), Journal of Projectiles, Rockets and Guidance, Vol. 34, No. 5, pp. 86–89, 2014, https://doi.org/10.15892/j.cnki.djzdxb.2014.05.022
-
H. M. Du, X. Y. Cao, and Z. W. He, “Analysis and verification of air and ground shock wave characteristics of near-ground explosion,” (in Chinese), Journal of Projectiles, Rockets, Rockets and Guidance, Vol. 34, No. 4, pp. 65–68, 2014, https://doi.org/10.15892/j.cnki.djzdxb.2014.04.001
-
S. P. Parida, P. C. Jena, and R. R. Dash, “Dynamics of rectangular laminated composite plates with selective layer-wise fillering rested on elastic foundation using higher-order layer-wise theory,” Journal of Vibration and Control, p. 107754632211383, Nov. 2022, https://doi.org/10.1177/10775463221138353
-
X. Kong, L. Wang, T. Yu, Z. He, H.E. Luo, and B. Li, “Free-field shock-wave test method for meteorological air cannons,” Measurement, Vol. 189, p. 110456, Feb. 2022, https://doi.org/10.1016/j.measurement.2021.110456
-
B. Chang, H. P. Gu, and C. W. Niu, “Study on characteristics of shock wave field of near ground explosion of moving explosives,” (in Chinese), Blasting, Vol. 35, No. 3, pp. 49–54, 2018, https://doi.org/10.3963/j.issn.1001-487x.2018.03.008
-
L. Wang and D. Kong, “Influence of ground impedance on explosive shock wave test accuracy,” International Journal of Impact Engineering, Vol. 171, p. 104395, Jan. 2023, https://doi.org/10.1016/j.ijimpeng.2022.104395
-
Y. Q. Wu, Y. Liu, and F. S. Huang, Theory and Application of Explosive Mechanics. (in Chinese), Beijing: Beijing University of Technology Press, 2021.
-
Li T. Y., Li T. L., and Meng X. Y., “Seismic travel time tomography method based on the fast marching method of the eikonal equation,” (in Chinese), World Geology, Vol. 40, No. 3, pp. 664–679, 2021, https://doi.org/10.3969/j.issn.1004-5589.2021.03.018
-
S. Y. Xiao, W. Chen, and Y. P. Liu, “Prediction of warhead explosion location based on explosion shock wave,” Military Automation, Vol. 40, No. 5, pp. 90–93, 2021, https://doi.org/10.7690/bgzdh.2021.05.020
-
B. B. Zhang, Q. M. Zhang, and F. L. Huang, Detonation Physics. (in Chinese), Beijing: Weapon Industry Press, 2001.
-
C. H. Chen, D. L. Hou, and X. Zhu, “Coupling effect of shock wave and fragment under air explosion of fragment warhead,” Journal of High Voltage Physics, Vol. 32, No. 1, pp. 51–59, 2018, https://doi.org/10.11858/gywlxb.20170849
-
Y. L. Guo, Y. Han, and L. M. Wang, “A reconstruction method of shock wave overpressure field based on generalized inverse algorithm,” Explosion and Shock, Vol. 34, No. 6, pp. 764–768, 2014, https://doi.org/10.11883/1001-1455(2014)06-0764-05
-
R. Fukunaga, M. Ezoe, S. Nakao, and Y. Miyazato, “Application of rainbow schlieren tomography for shock-containing rectangular jets,” Journal of Visualization, Vol. 25, No. 4, pp. 687–695, Aug. 2022, https://doi.org/10.1007/s12650-022-00827-w
-
M. E. Rutherford, J. G. Derrick, D. J. Chapman, G. S. Collins, and D. E. Eakins, “Insights into local shockwave behavior and thermodynamics in granular materials from tomography-initialized mesoscale simulations,” Journal of Applied Physics, Vol. 125, No. 1, Jan. 2019, https://doi.org/10.1063/1.5048591
-
M. M. Bai, Y. L. Guo, and F. Wang, “Reconstruction of underwater explosion shock wave overpressure field based on variable grid,” (in Chinese), Tactical Missile Technology, Vol. 4, No. 1, pp. 105–110, 2014, https://doi.org/10.16358/j.issn.1009-1300.2014.04.001
-
J. Y. Wang, Geophysical Inversion Theory. (in Chinese), Beijing: Higher Education Press, 2011.
-
G. H. Liu, Z. Y. Wang, and J. Sun, “Elastic wave tomography and its application in civil engineering,” Journal of Civil Engineering, Vol. 36, No. 5, pp. 76–81, 2003, https://doi.org/10.15951/j.tmgcxb.2003.05.013
-
H. H. Liu and X. J. Xue, “Application of elastic wave CT technology in the inspection of wharf reinforcement effect,” Journal of Engineering Geology, Vol. 11, No. 4, pp. 435–439, 2003.
-
F. Wang and Y. Q. Bai, “Shock wave overpressure field reconstruction technology based on OSEM algorithm,” (in Chinese), Shanxi Electronic Technology, No. 1, pp. 15–18, 2016.
-
A. M. Luo, Q. Zhang, and C. H. Bai, “Study on the inversion of shock wave overpressure of fuel air explosives,” (in Chinese), Journal of Projectile and Guidance, No. 1, pp. 34–36, 2005, https://doi.org/10.15892/j.cnki.djzdxb.2005.01.011
-
X. G. Zhang, “Research on shock wave overpressure field reconstruction technology,” (in Chinese), Central North University, 2018.
-
Y. Yao, Y. H. Ding, and D. X. Pei, “Reconstruction method of shock wave curve of explosion in air,” (in Chinese), Journal of Metrology, Vol. 40, No. 4, pp. 636–641, 2019, https://doi.org/10.3969/j.issn.1000-1158.2019.04.15
-
Y. Yao, “Research on reconstruction technology of near earth static explosion shock wave field,” (in Chinese), Central North University, 2019.
-
Z.-Q. Xue, S. Li, C.-L. Xin, L.-P. Shi, and H.-B. Wu, “Modeling of the whole process of shock wave overpressure of free-field air explosion,” Defence Technology, Vol. 15, No. 5, pp. 815–820, Oct. 2019, https://doi.org/10.1016/j.dt.2019.04.014
-
Y. C. Xie, H. B. Zhou, and Y. Tao, “Research on the reconstruction method of underwater electric explosion shock wave shape based on wavelet decomposition,” (in Chinese), Vibration and Shock, Vol. 40, No. 5, pp. 149–153, 2021, https://doi.org/10.13465/j.cnki.jvs.2021.05.020
-
X. L. Yan, J. Li, and H. H. Kong, “Shock wave overpressure field reconstruction method based on compression sensing,” (in Chinese), Electronic Measurement Technology, Vol. 45, No. 2, pp. 84–90, 2022, https://doi.org/10.19651/j.cnki.emt.2108067
-
N. Qi, “Research on reconstruction method of overpressure field of near ground static explosion shock wave based on AUTODYN simulation,” (in Chinese), Central North University, 2022.
-
H. Almasieh and J. Nazari Meleh, “Numerical solution of a class of mixed two-dimensional nonlinear Volterra-Fredholm integral equations using multiquadric radial basis functions,” Journal of Computational and Applied Mathematics, Vol. 260, pp. 173–179, Apr. 2014, https://doi.org/10.1016/j.cam.2013.09.067
-
Z. J. Lv, H. Y. Li, and C. Y. Gao, “Dynamic explosion overpressure field reconstruction method based on ground reflected shock wave and genetic algorithm,” (in Chinese), Journal of Safety and Environment, Vol. 22, No. 4, pp. 1872–1878, 2022, https://doi.org/10.13637/j.issn.1009-6094.2021.0422
-
S. Kang and K. H. Kwon, “Generalized average sampling in shift invariant spaces,” Journal of Mathematical Analysis and Applications, Vol. 377, No. 1, pp. 70–78, May 2011, https://doi.org/10.1016/j.jmaa.2010.10.013
-
H.-M. Gutmann, “On the Semi-norm of Radial Basis Function Interpolants,” Journal of Approximation Theory, Vol. 111, No. 2, pp. 315–328, Aug. 2001, https://doi.org/10.1006/jath.2001.3579
-
R. L. Hardy, “Theory and applications of the multiquadric-biharmonic method 20 years of discovery 1968-1988,” Computers and Mathematics with Applications, Vol. 19, No. 8-9, pp. 163–208, 1990, https://doi.org/10.1016/0898-1221(90)90272-l
-
Z. M. Wu, Models, methods and theories of scattered data fitting. (in Chinese), Beijing: Science Press, 2007.
-
J. Wu, “A new approach for shape preserving interpolating curves,” Computers and Mathematics with Applications, Vol. 61, No. 5, pp. 1425–1430, Mar. 2011, https://doi.org/10.1016/j.camwa.2011.01.013
-
H. Y. Zhao, L. Y. Fan, and J. C. Chang, “Fuzzy data interpolation based on cubic spline basis function,” (in Chinese), Journal of North China University of Technology (Natural Science Edition), Vol. 44, No. 4, pp. 68–79, 2022, https://doi.org/10.3969/j.issn.2095-2716.2022.04.011
-
M. M. Bai, Y. L. Guo, and L. M. Wang, “Reconstruction algorithm and comparison of overpressure field of underwater explosion shock wave,” (in Chinese), Journal of Missile, Arrow and Guidance, Vol. 34, No. 6, pp. 71–74, 2014, https://doi.org/10.15892/j.cnki.djzdxb.2014.06.019
-
M. M. Bai and Y. L. W. L. M. Guo, “Reconstruction technology of explosion overpressure field based on EM algorithm,” (in Chinese), Journal of Projectile and Guidance, Vol. 34, No. 3, pp. 187–190, 2014, https://doi.org/10.15892/j.cnki.djzdxb.2014.03.003
-
M. M. Bai, Y. L. Guo, and L. M. Wang, “Research on optimal sensor layout technology based on reconstruction of explosive overpressure field,” (in Chinese), Journal of Sensing Technology, Vol. 27, No. 7, pp. 886–892, 2014, https://doi.org/10.3969/j.issn.1004-1699.2014.07.007
-
Z. G. Liang, X. L. Li, and Z. Y. Zhu, “A calculation method of impact peak value based on quadratic curve fitting,” (in Chinese), Journal of Metrology, Vol. 36, No. 3, pp. 309–312, 2015, https://doi.org/10.3969/j.issn.1000-1158.2015.03.018
-
H. Feng and Z. J. Zhang, “Research on reconstruction of shock wave pressure field based on distributed testing system,” (in Chinese), Journal of Measurement Science and Instrumentation, Vol. 6, No. 1, pp. 25–29, 2015, https://doi.org/10.3969/j.issn.1674-8042.2015.01.005
-
M. M. Bai, L. M. Wang, and R. Gao, “Optimization and acquisition technology of shallow underground explosion tomography information,” (in Chinese), Journal of Sensing Technology, Vol. 28, No. 6, pp. 858–863, 2015, https://doi.org/10.3969/j.issn.1004-1699.2015.06.014
-
Z. Yang, Z. J. Zhang, and Y. Xia, “Shock wave overpressure field reconstruction based on B-spline interpolation fitting,” (in Chinese), Science, Technology and Engineering, Vol. 16, No. 7, pp. 236–240, 2016, https://doi.org/10.3969/j.issn.1671-1815.2016.07.040
-
H. B. Zhao and Z. B. Zhang, “Shock wave pressure field reconstruction method based on non-uniform rational B-spline “cobweb” interpolation,” (in Chinese), Science, Technology and Engineering, Vol. 17, No. 18, pp. 258–264, 2017.
-
Y. Wen-Bin, D. Yong-Hong, and Y. Yue, “Static explosion field reconstruction based on the improved biharmonic spline interpolation,” IEEE Sensors Journal, Vol. 20, No. 13, pp. 7235–7240, Jul. 2020, https://doi.org/10.1109/jsen.2020.2978502
-
S. Liu, J. Xu, H. Gong, and K. Yu, “Assessment of streamline-based pressure reconstruction for PIV data in supersonic flows with shock waves,” Experiments in Fluids, Vol. 61, No. 7, pp. 1–20, Jul. 2020, https://doi.org/10.1007/s00348-020-02999-3
About this article

This work was funded by National Equipment Program of China, project number: 14021001050206.
The datasets generated during and/or analyzed during the current study are available from the corresponding author on reasonable request.
Liangquan Wang: conceptualization; data curation; formal analysis; methodology; software; writing– original draft; writing – review and editing; validation. Deren Kong: project administration; writing – review and editing; resources. Fe Shang: writing – review and editing.
The authors declare that they have no conflict of interest.
