Abstract
Based on the results of the seismic hazard survey in Yunnan Province, four exceedance probabilities of peak ground acceleration were converted into earthquake magnitudes using the empirical relationship between epicentral intensity and magnitude. By using logistic regression, earthquake magnitude, source depth, cover layer thickness, and fault type were used as independent variables to calculate the probability of co-seismic displacement for different earthquake magnitudes. Using the magnitude-displacement empirical model in the southwestern region of China, horizontal and vertical displacements were obtained with a 95 % confidence level. The results show that all Holocene faults have the ability to produce surface displacement, but from the perspective of probabilistic hazard, the probability of surface rupture in the short term is low, while the probability of surface rupture for each fault significantly increases over a long time scale. Buildings with different service lives should adopt different avoidance strategies, and buildings with shorter service lives (<50a) can consider not avoiding active faults.
1. Introduction
In recent years, some researchers have begun to explore the probabilistic assessment of surface rupture. Youngs et al. [1] proposed the concept of Probabilistic Fault Displacement Hazard Analysis (PFDHA) based on the theory of Probabilistic Seismic Hazard Analysis (PSHA) and developed predictive models for surface fault displacement suitable for reverse faults. Petersen et al. [2] extended this concept to strike-slip faults. The International Atomic Energy Agency (IAEA) explicitly recommends the use of this method to assess the hazard of faults that cannot be completely excluded from rupturing to the surface in their revised guidelines (DS507) [3]. However, this model requires a deep understanding of active faults, such as earthquake recurrence models, the relationship between magnitude and rupture scale, and the relationship between rupture scale and magnitude. In mainland China, especially in Yunnan Province, the research depth on active faults does not meet the requirements of this model, making it difficult to promote its application domestically.
In this study, four exceedance probability peak ground acceleration from the Yunnan seismic hazard risk survey, empirical relationships between magnitude and intensity at the epicenter, and magnitude and surface fault displacement, as well as the logistic regression analysis method for surface fault displacement prediction, were used to analyze whether 27 active faults in the province would experience surface fault displacement at different probabilities. If surface fault displacement occurs, the parameters of the surface fault displacement are provided.
2. Data
Since 2020, China has started implementing the first national comprehensive risk assessment of natural disasters, which includes multiple types of natural disasters, as well as seismic hazards (https://www.emerinfo.cn/zt/zrzhzhfxpc1/index.htm). Here, two results are used: peak ground acceleration and active faults.
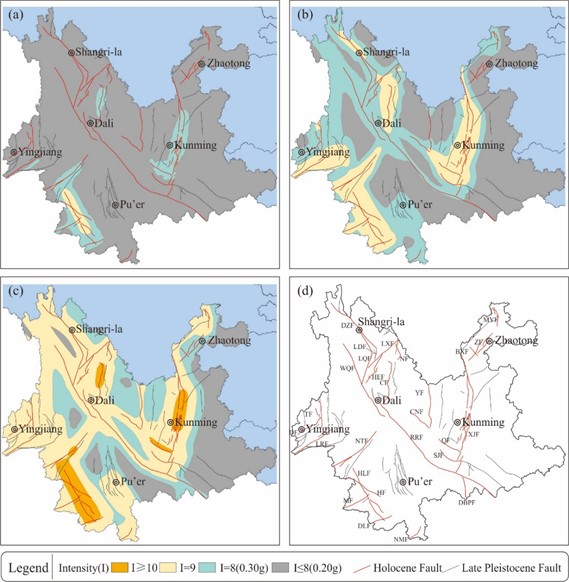
Peak ground acceleration. The method of Probabilistic Seismic Hazard Analysis (Cornell, 1968) is used to calculate the bedrock peak ground acceleration for 30-second grids in Yunnan Province at four probabilities (50-year exceedance probabilities of 63 %, 10 %, 2 %, and 100-year 1 %). Combined with site categories, the surface peak ground acceleration for 30-second grids in Yunnan Province at the four probabilities are obtained. Among them, the seismic ground motion parameters for the 50-year exceedance probability of 63 % are all below 8 degrees (0.20 g), so co-seismic fault displacement can be disregarded. The zoning results of the peak ground accelerations for the other three exceedance probabilities are shown in Fig. 1(a-c).
Active faults. Active faults mapping, research papers, and seismic safety assessment reports are collected to analyze the spatial distribution and activity parameters of active faults in Yunnan Province. There are nearly 70 active faults in the province, including 27 Holocene faults and the rest Late Pleistocene faults. Based on the historical earthquake experience in Yunnan, Late Pleistocene faults only have the structural conditions for earthquakes of magnitude less than 6.5. No earthquakes with surface faulting lower than magnitude 6.5 have been found in historical earthquakes in Yunnan, so the possibility of co-seismic displacement for Late Pleistocene faults is not considered in this study. The locations and names of the 27 Holocene faults are shown in Fig. 1(d).
Fig. 1Data used in this study. a)-c) Seismic motion parameter zoning maps for 10 %, 2 %, and 1 % exceedance probabilities in 50 years, respectively; d) distribution map of active faults in Yunnan Province. BXF, Baogunan-Xiaohe Fault; CF, Chenghai Fault; CNF, Chuxiong-Nanhua Fault; DBPF, Dien Bien Phu Fault; DF, Dayingjiang Fault; DLF, Daluo Fault; DZF, Deqin-Zhongdian Fault; HEF, Heqing-Eryuan Fault; HF, Heihe Fault; HLF, Hanmuba-Lancang Fault; LDF, Lijiang-Daju Fault; LQF, Longpan-Qiaohou Fault; LRF, Longling-Ruili Fault; LXF, Lijiang-Xiaojinhe Fault; MF, Menglian Fault; MYF, Mabian-Yanjing Fault; NF, Ninglang Fault; NMF, Nam Ma Fault; NTF, Nantinghe Fault; QF, Qujiang Fault; RRF, Red River Fault; SJF, Shiping-Jianshui Fault; TF, Tengchong Fault; WQF, Weixi-Qiaohou Fault; XJF, Xiaojiang Fault; YF, Yuanmou Fault; ZF, Zhaotong Fault
3. Methods
(1) Conversion of seismic intensity zoning levels (Fig. 1(a-c)) to seismic magnitudes. There are many studies that have established empirical relationships between seismic magnitudes and intensities for China as a whole or for specific regions [4-7]. Method of Lei et al. [5] was used here. They selected data from 116 earthquakes in the southwestern region since 1950 for statistical analysis and obtained the relationship between epicentral intensity () and magnitude ():
According to this equation, the corresponding relationship between epicentral intensity and seismic magnitude is obtained, as shown in Table 1.
Table 1Correspondence between epicentral intensity and seismic magnitude
Seismic intensity | 8 (0.20 g) | 8 (0.30 g) | 9 | ≥ 10 |
Seismic magnitude | 6.0-6.3 | 6.4-6.7 | 6.8-7.5 | ≥ 7.6 |
(2) Assess the probability of co-seismic displacement based on the range of seismic magnitudes. Using the logistic regression method [8], predict the probability of surface rupture under different conditions. Logistic regression is a method for studying the functional relationship between variables. To address the question of whether surface rupture occurs or not, scientists have introduced the logistic function, which allows the use of regression analysis to study surface rupture. The expression for the logistic function with multiple independent variables is as follows:
In the equation: , as derived from Eq. (2):
where, represents the probability of an event occurring, and represents the probability of the event not occurring. Taking the logarithm of Eq. (3) transforms it into a linear equation, which is the logistic regression equation:
where, , ,…, are the independent variables, is the constant term of the regression equation, and , ,…, are the regression coefficients of the equation. by using statistical data, the regression coefficients are obtained through regression analysis using Eq. (4), resulting in a conditional probability prediction model:
The study by Bo et al. [9] collected 383 earthquake data, using earthquake magnitude, source depth, fault characteristics, and overlying layer thickness as independent variables. Logistic regression was applied to train and test these 383 earthquake data, resulting in regression coefficients. In this study, the four independent variables are assigned values based on the requirements in logistic regression, with reference to Bo et al. [9] and Huang et al. [10]:
(3) Calculate the horizontal and vertical displacements. Based on the intensity corresponding to the earthquake magnitude, calculate the horizontal and vertical displacements. Huang [8] compiled data on 64 earthquakes with surface rupture in mainland China and obtained the relationship between earthquake magnitude and horizontal and vertical displacements (Fig. 2).
(4) Determination of co-seismic displacement
Based on the previous calculation results and the fault distribution in Fig. 1(d), the faults that are likely to cause surface rupture are determined.
Fig. 2Relationship between the magnitude of strike-slip fault earthquakes in western China and the horizontal and vertical surface rupture displacements (adapted from [8]). The thick black line represents the fitting results with a confidence level above 95 %
![Relationship between the magnitude of strike-slip fault earthquakes in western China and the horizontal and vertical surface rupture displacements (adapted from [8]). The thick black line represents the fitting results with a confidence level above 95 %](https://static-01.extrica.com/articles/23732/23732-img2.jpg)
4. Results
1) Under a 50-year exceedance probability of 10 % (return period of 475 years), the CF (Chenghai Fault) and other 5 faults have a low risk of surface displacement (Probability of Displacement 6.15 %-15.60 %, Horizontal Displacement 2.6-3.8 m, Vertical Displacement 1.8-2.6 m, same below), while the HF (Heihe Fault) and HLF (Hanmuba-Lancang Fault) have a middle risk of surface displacement (Probability of Displacement 20.7 %-74.5 %, Horizontal Displacement 4.1-7.9 m, Vertical Displacement 2.8-5.3 m, same below).
2) Under a 50-year exceedance probability of 2 % (return period of 2475 years), the CNF (Chuxiong-Nanhua Fault) and other 10 faults have a low risk of surface displacement, while the CF (Chenghai Fault) and other 11 faults have a middle risk of surface displacement.
3) Under a 100-year exceedance probability of 1 % (return period of 9950 years), the BXF (Baogunao-Xiaohe Fault) and other 2 faults have a low risk of surface displacement, the CNF (Chuxiong-Nanhua Fault) and other 16 faults have a middle risk of surface displacement, and the CF (Chenghai Fault) and other 7 faults have a high risk of surface displacement (Probability of Displacement ≥ 80.4 %, Horizontal Displacement 8.7-11 m, Vertical Displacement 5.8-9 m).
5. Discussion
(1) How to use the results.
For example, a building with a lifespan of 2000 years located near Dali, we predict the probability and amount of surface faulting based on Fig. 1 and Table 2.
With a lifespan of 2000 years, according to Table 1, the closest year to 2000 is 2475 (2 % exceedance probability in 50 years), so we use Fig. 1(b). in Fig. 1(b), the intensity of Dali is 8 (0.30 g), indicating the possibility of surface faulting. According to Table 2, the probability of surface faulting occurring within the lifespan is 6.15 %-15.60 %, with a horizontal displacement of 2.6-3.8 m and a vertical displacement of 1.8-2.6 m. According to Fig. 1(d), the active fault in Dali is the Red River Fault. The next step can be to carry out precise location work for the active fault, and the results can be used for active fault avoidance or anti-fault engineering design.
Table 2Summarizes the predicted results of co-seismic displacement
Exceeding probability | Return period | Intensity | Active fault | Probability of displacement | Horizontal displacement (m) | Vertical displacement (m) |
50a 10 % | 475a | 8 (0.30 g) | CF, DLF, QF, MLF, NTF, XJF (6 faults) | 6.15 %- 15.60 % | 2.6-3.8 | 1.8-2.6 |
9 | HF, HLF (2 faults) | 20.7 %- 74.5 % | 4.1-7.9 | 2.8-5.3 | ||
50a 2 % | 2475a | 8 (0.30 g) | CNF, DF, HEF, LDF, LQF, MYF, NF, NMF, RRF, TF, WQF (11 faults) | 6.15 %- 15.60 % | 2.6-3.8 | 1.8-2.6 |
9 | CF, DLF, DZF, HF, HLF, LRF, LXF, MLF, NTF, QF, SJF, XF (12 faults) | 20.7 %- 74.5 % | 4.1-7.9 | 2.8-5.3 | ||
100a 1 % | 9950a | 8 (0.30 g) | BXF, DBPF, ZF (3 faults) | 6.15 %- 15.60 % | 2.6-3.8 | 1.8-2.6 |
9 | CNF, DF, DZF, HEF, LDF, LQF, LRF, LXF, MLF, MYF, NF, NMF, RRF, SJF, TF, WQF, YMF (17 faults) | 20.7 %- 74.5 % | 4.1-7.9 | 2.8-5.3 | ||
≥10 | CF, DLF, HF, HLF, NTF, QF, XJF (7 faults) | ≥ 80.4 % | 8.7-11 | 5.8-9 |
(2) Buildings with shorter lifespans may not need to consider active fault avoidance work. the peak ground acceleration with a 50-year exceedance probability of 63 % (recurrence period of 50 years) do not produce surface displacements exceeding 7 degrees, the highest in the province. Therefore, buildings with shorter lifespans (for example, less than 50a) may not need to consider the impact of fault surface faulting.
(3) in practical work, the influence of the thickness of the cover layer needs to be emphasized. the thickness of the cover layer has a significant impact on the prediction results, mainly in two aspects. First, the probability of surface faulting occurrence. Taking a magnitude 7 earthquake as an example, the probability of surface faulting occurrence on a bedrock site is 34 %. With a 25 m cover layer, the probability decreases to 6 %, and with a 55 m cover layer, the probability decreases to 0.7 %. Second, the thicker the cover layer, the more significant the attenuation of fault displacement.
(4) This study ignores some factors that may have an impact on the research results, such as creep of the fault, fault locking and seismic gaps, and the elapsed time since the last strong earthquake. as research on active faults in Yunnan Province becomes more in-depth, subsequent studies can take these factors into consideration.
6. Conclusions
Surface rupture is a significant concern in engineering, particularly in Yunnan Province. Within the province, there are 27 Holocene active faults that have the potential to generate earthquakes of magnitude 7 and above, indicating the possibility of surface rupture. Deterministic prediction and evaluation methods prioritize safety but face challenges in implementation and potential overestimation of risk, which can impact engineering projects and economic development in Yunnan Province. This study, based on a synthesis of previous research, utilizes seismic parameters with different exceedance probabilities in Yunnan Province to calculate the probability of surface rupture in different regions at various exceedance probabilities (return periods). Using empirical relationships, horizontal and vertical fault displacements associated with surface rupture are estimated. the main conclusions are as follows:
1) All the Holocene faults have the capability to generate surface rupture, but the short-term probability of surface rupture is low, while the long-term probability significantly increases for each fault.
2) Different avoidance strategies should be considered for buildings with different lifespans, with shorter-lived structures potentially not needing to avoid active faults.
3) Over longer timescales, faults such as CF (Chenghai Fault) pose a high risk of surface rupture, and further research and attention to avoidance measures are warranted.
References
-
R. R. Youngs et al., “A methodology for probabilistic fault displacement Hazard analysis (PFDHA),” Earthquake Spectra, Vol. 19, No. 1, pp. 191–219, Feb. 2003, https://doi.org/10.1193/1.1542891
-
M. D. Petersen et al., “Fault displacement Hazard for strike-slip faults,” Bulletin of the Seismological Society of America, Vol. 101, No. 2, pp. 805–825, Apr. 2011, https://doi.org/10.1785/0120100035
-
A. Valentini et al., “Probabilistic fault displacement Hazard assessment (PFDHA) for nuclear installations according to IAEA safety standards,” Bulletin of the Seismological Society of America, Vol. 111, No. 5, pp. 2661–2672, Oct. 2021, https://doi.org/10.1785/0120210083
-
J. Z. Qin, “Statistical analysis of earthquake intensity and magnitude in Yunnan,” Journal of Seismological Research, Vol. 15, No. 1, pp. 37–45, 1992.
-
J. C. Lei, M. T. Gao, and Y. X. Yu, “The statistical study on near-epicenter intensity and sensible radius of recent earthquakes in southwest China,” Technology for Earthquake Disaster Prevention, Vol. 1, No. 2, pp. 137–145, 2006.
-
Z. D. Yan and L. C. Guo, “On the relationship between the magnitude and epicenter intensity of earthquakes in China and its application,” Science China (B), Vol. 11, pp. 1050–1058, 1984.
-
J. C. Ma et al., “Statistical relationship between magnitude andepicentral intensity of southeast littoral,” World Earthquake Engineering, Vol. 21, No. 4, pp. 119–122, 2005.
-
J. Y. Huang, “Research on the method for evaluating the earthquake surface rupture,” Institute of Engineering Mechanics, China Earthquake Administration, 2016.
-
J. S. Bo et al., “A prediction method of surface rupture in strong earthquakes based on logistic regression analysis,” Earthquake Engineering and Engineering Dynamics, Vol. 39, No. 4, pp. 1–7, 2019.
-
J. Y. Huang et al., “Progress in research on engineering evaluation of surface ruptures in strong earthquakes,” Journal of Natural Disasters, Vol. 25, No. 6, pp. 94–104, 2016.
About this article

Key Research and Development Plan of Yunnan Province: the Technology of the Comprehensive Risk Assessment of the Earthquake Catastrophe and the Disaster Chains in Yunnan and Its Application (No. 202203AC100003).
The datasets generated during and/or analyzed during the current study are available from the corresponding author on reasonable request.
The authors declare that they have no conflict of interest.
