Abstract
The strong vibration record contains a lot of information on the site during the earthquake, and the dynamic characteristics of the soil layer in the site can be expressed through this information. Currently, the H/V spectral ratio recorded by acceleration is often used to study the seismic effect of the site. Inspired by this, the thesis puts forward the idea of using the instantaneous H/V spectral ratio and its corresponding instantaneous frequency to judge the site liquefaction. The time-varying VARMA model is used to represent the horizontal ground motion component as the output of a time-varying system with vertical ground motion component as input. According to the time-varying VARMA parameters, the instantaneous spectral ratio, instantaneous frequency of the system and instantaneous damping ratio are used to judge the site liquefaction.
Highlights
- The H/V spectral ratio recorded by acceleration is often used to study the seismic effect of the site.
- The thesis puts forward the idea of using the instantaneous H/V spectral ratio and its corresponding instantaneous frequency to judge the site liquefaction.
- The time-varying VARMA model is used to represent the horizontal ground motion component as the output of a time-varying system with vertical ground motion component as input.
- According to the time-varying VARMA parameters, the instantaneous spectral ratio, instantaneous frequency of the system and instantaneous damping ratio are used to judge the site liquefaction.
- Propose a new basis for judging site liquefaction.
1. Introduction
Sand liquefaction is a typical earthquake disaster, which can cause serious damage to foundations and structures during earthquakes. The additional settlement of the foundation soil layer caused by the liquefaction of sand under the action of earthquake, the structure and foundation sliding, overturning and other phenomena seriously affect the safety of the engineering structure [1, 2]. Therefore, it is of great engineering significance to study sand liquefaction and its influence on the engineering structure.
At present, the definition of sand liquefaction is still based on the three conditions of pore pressure ratio, soil strength and shear deformation, and some judgment methods only consider one of the conditions [3]. Therefore, it is easy to cause misjudgment in practical engineering applications. In recent years, the discriminating method based on the ground motion acceleration record of the site has been gradually developed [4]. Wang Wenshao used shear wave velocity to judge sand liquefaction based on the “threshold strain” proposed by Yokel [5], and Shi [6] proposed a method for judging sand liquefaction using pore pressure ratio. Miyajima [7] proposed a liquefaction discrimination method based on three components of ground motion acceleration records in 1997. This is the first internationally published method to determine whether liquefaction occurs on a site through ground motion records. Sun Rui [8] proposed a method for judging liquefaction using instantaneous frequency reduction. Chen Shun [9] proposed a method based on VARMA model that uses ground motion as output and borehole record as input.
Considering the commonly used H/V spectral ratio method [10, 11] when studying the seismic effects of the site, The paper proposes a method to calculate the instantaneous spectrum ratio, instantaneous frequency and instantaneous damping ratio of the site based on the strong surface vibration records, and then to judge the site liquefaction. Finally, the method is verified by two examples.
2. VARMA model
The state-space model of the VARMA model [12] can be expressed as:
where: is the state vector; is the Gaussian process noise; is the observation vector. The Kalman filtering method is used to estimate the parameters.
The calculation formula of instantaneous spectrum ratio is:
Then, perform eigenvalue decomposition on the conversion matrix of the system :
In the formula, , . The corresponding instantaneous frequency of the structure can be calculated according to :
Correspondingly, the formula for calculating the instantaneous damping ratio is:
Among them, means taking the real part of the complex number.
3. Liquefaction identification method
The judgment principle of reference [9], the basis for judging liquefaction in this paper is as follows (at the same time, the following conditions can be judged as liquefaction);
1) PGA > 0.1 m/s2, use the time-varying VARMA model to calculate the instantaneous modal frequency of the soil structure through input and output, and judge the liquefaction of the soil from the change of the instantaneous modal frequency of the soil; if the horizontal peak acceleration PGA < 0.1 m/s2 of the ground motion records on the site is directly judged as non-liquefaction, the PGA on the ground surface is too small to cause damage to the soil.
2) Define the mean value of the instantaneous frequency before the corresponding time of the PGA, define the mean value of the instantaneous frequency of the ground motion attenuation section (tail), and define the tail attenuation section as the period during which the absolute value of acceleration is continuously less than 0.1 times the PGA. The instantaneous frequency of the tail remains basically unchanged, and and 1 Hz;
3) The instantaneous damping ratio before and after the corresponding time of the PGA suddenly increases to around 1, and this value will remain unchanged for a period of time thereafter.
Satisfying the above three items can be judged as liquefaction; if at least one item is not satisfied, it can be judged as not liquefying, or the influence of liquefaction is not obvious.
4. Examples
4.1. MYGH04 station record
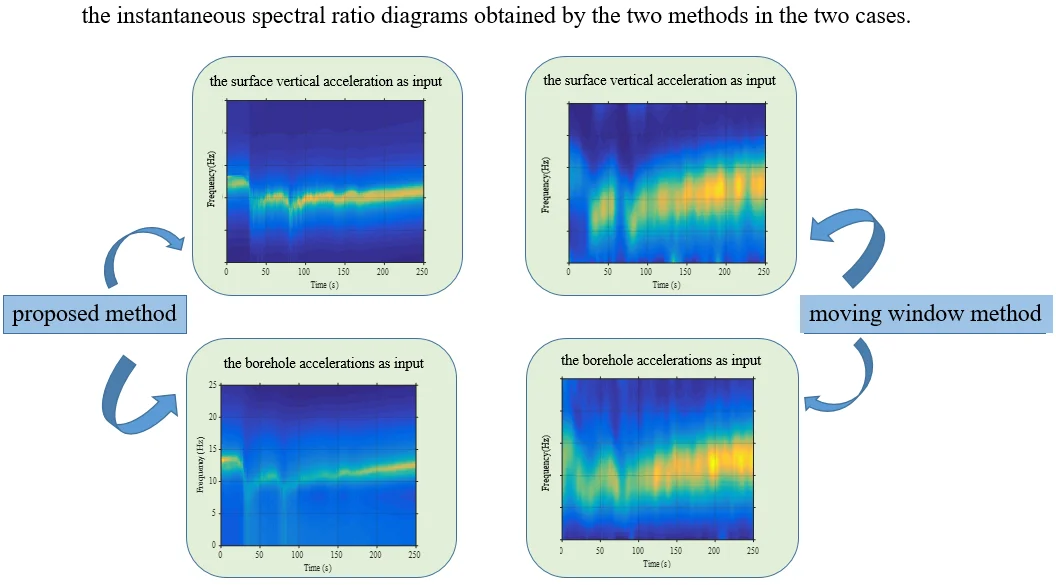
Taking the record of the Great East Japan Earthquake Station MYGH04 on March 11, 2011 as an example, different input-output pairs were used to calculate the instantaneous spectral ratio of the method and sliding window method.
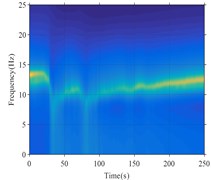
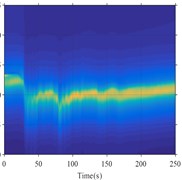
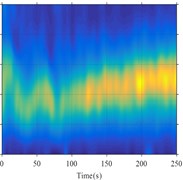
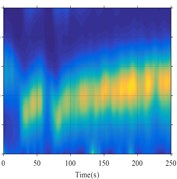
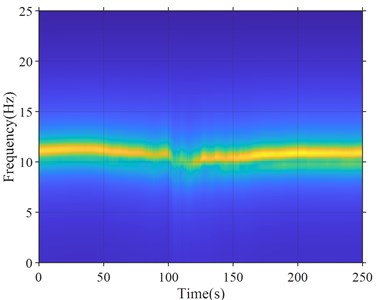
Fig. 1 show the instantaneous spectral ratio diagrams obtained by the two methods in the above two cases. It can be seen that when the horizontal ground motion is used as the system output, the seismic effect of the site is studied by using the underground and ground motions as inputs respectively. The results obtained are similar, and there is no obvious difference between the two cases. It is feasible to calculate the instantaneous spectral ratio of the site according to the ground motion and study the seismic effect of the site. In addition, because the method in this paper is a parameterized method, the time-frequency resolution of the results obtained is significantly higher than with the sliding window method, the changing law of instantaneous spectrum ratio is obviously clearer.
Fig. 1Instantaneous spectrum ratio: a) the borehole accelerations as input (proposed method; b) the surface vertical acceleration as input (proposed method; c) the borehole accelerations as input (moving window method); d) the surface vertical acceleration as input (moving window method)
a)
b)
c)
d)
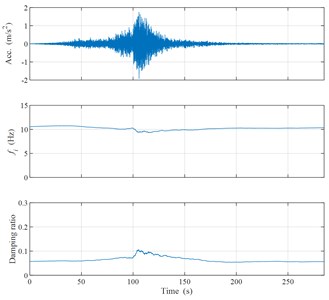
Fig. 2Acceleration time history, instantaneous frequency and Instantaneous damping ratio curves
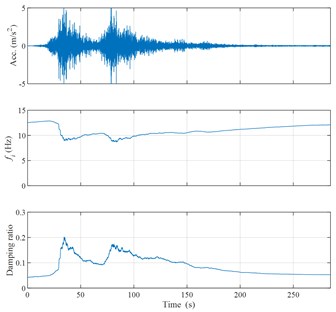
Fig. 2 shows the acceleration time-history curve of the north-south component recorded by the station and the instantaneous frequency and instantaneous damping ratio calculated according to the previous Eqs. (4) and (5). It can be found that the “burr” waveform (spike) appears in the acceleration time course at about 50 s and 90 s. This waveform is mainly caused by the shear fluidity of the soil under the action of the earthquake, indicating that the soil has nonlinear characteristics. At the same time as the spikes appeared, the instantaneous frequency of the site decreased rapidly. The change law of the instantaneous damping ratio is also consistent with the appearance of the acceleration spike. When the acceleration spike appears and the instantaneous frequency decreases rapidly, the instantaneous damping ratio rises rapidly; after the acceleration spike, the instantaneous damping ratio gradually decreases to the initial value level. The above results clearly show that the relative changes in instantaneous frequency and instantaneous damping ratio can be used as indicators to judge whether the site exhibits nonlinear characteristics.
5. IBR014 and TCGH14 station records
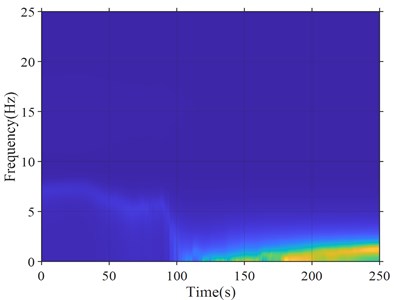
Fig. 3 is the information calculated from the IBR014 record of the East Japan Earthquake Central Station According to the research results of [9], the soil of the station site was liquefied during the earthquake. It can be seen from Fig. 3 that when the acceleration reaches the peak value, the instantaneous frequency also changes abruptly and drops sharply to around 0 Hz. During the earthquake process after the peak acceleration, the instantaneous frequency showed no signs of recovering and remained at near 0 Hz. In addition, from the instantaneous damping ratio curve, when the acceleration peak appears, the damping ratio increases sharply, rapidly increases to around 1 in a short time, and stays around 1 for about 60 seconds. According to the judgment conditions proposed in this article, it is clear that the soil of the station has liquefied during the earthquake.
Fig. 3Station IBRO14: a) instantaneous spectrum ratio; b) acceleration time history, instantaneous frequency and Instantaneous damping ratio curves
a)
b)
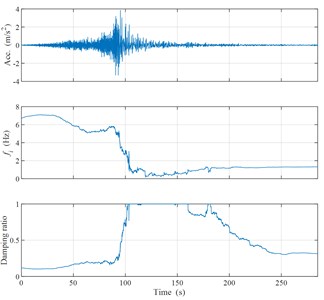
Fig. 4Station TCGH14: a) instantaneous spectrum ratio; b) acceleration time history, instantaneous frequency and Instantaneous damping ratio curves
a)
b)
Fig. 4 is the calculation result based on the surface acceleration recorded by the TCGH14 station in the Great East Japan Earthquake. It can be seen from Fig. 4 that the instantaneous frequency remained basically stable at around 10 Hz throughout the earthquake. At the same time when the peak acceleration occurs, the damping ratio increases slightly. After the peak acceleration, the damping ratio slowly decreases to the initial level. The change in the instantaneous frequency and instantaneous damping ratio of station TCGH14 is much smaller than that of station MYGH04, indicating that the soil body is basically in an elastic state during the earthquake.
6. Conclusions
In this paper, the time-varying VARMA model is used to model the input and output of the soil structure (system), the instantaneous mode shape and modal frequency of the structure are calculated from the parameters of the model, and then perform liquefaction discrimination based on the instantaneous modal frequency change of the soil structure .
In order to verify the effectiveness of the method in this paper, three examples of station records were listed. Using the identification method in this paper, it was successfully identified whether the soil on the site was liquefied. Compared with the previous method, the method in this paper only needs to obtain easy-to-obtain surface motion records to judge the liquefaction of the site. At the same time, the concept is clear and the calculation is simple. It has certain reference value for the evaluation of liquefaction disasters after the earthquake.
References
-
Chen Guoxing, Xie Junfei Seismic response analysis of pile foundation high-rise building system considering the influence of foundation liquefaction. Earthquake engineering and engineering vibration, Vol. 15, Issue 4, 1995, p. 93-103, (in Chinese).
-
Chen Wenhua, Men Fulu Experimental study on liquefaction vibration table of saturated sand soil foundation with buildings. Earthquake Engineering and Engineering Vibration, Vol. 18, Issue 4, 1998, p. 54-60, (in Chinese).
-
Fukushima Y., Bonilla L. F., Scotti O., et al. Site classifications using horizontal-to-vertical response spectral ratios and its impact when deriving empirical ground-motion prediction equations. Journal of Earthquake Engineering, Vol. 11, Issue 5, 2007, p. 717-724.
-
Ljung L. System Identification: Theory for the User. Prentice-Hall, Englewood Cliffs, New Jersey, 1987.
-
Luong M. P. Stress-strain aspects of cohesionless soils under cyclic and transient loading. Proceedings of the International Symposium on Soils under cyclic and transient loading, Balkema Rotterdam, The Netherlands, 1980, p. 315-324.
-
Kayen R., Seed R. B., Moss R. E., et al. Global shear wave velocity database for probabilistic assessment of the initiation of seismic-soil liquefaction. 11th International Conference on Soil Dynamics & Earthquake Engineering, Berkeley, 2004, p. 506-512.
-
Miyajima M., Kitaura M., Nozu S. Detective method of liquefaction using strong ground motion records. Proceedings of 3rd China-Japan-US trilateral Symposium on Lifeline Earthquake Engineering, Kunming, Beijing, China, 1998.
-
Sun Rui Identification Method of Ground Motion and Site Liquefaction of Liquefied Soil. Institute of Engineering Mechanics, China Earthquake Administration, 2006, (in Chinese).
-
Chen Shun Identification of Soil Liquefaction Based on Strong Earthquake Records. Chongqing University, 2014, (in Chinese).
-
Bindi D., Parolai S., Spallarossa D., et al. Site effects by H/V ratio: comparison of two different procedures. Journal of Earthquake Engineering, Vol. 4, Issue 1, 2000, p. 97-113.
-
Davor S., Snježana M., Mario G., et al. Assessment of the seismic site amplification in the City of Ivanec (NW Part of Croatia) using the microtremor HVSR method and equivalent-linear site response analysis. Geosciences, Vol. 25, Issue 7, 2019, p. 312-337.
-
Dong Yinfeng Improvement of Non-Stationary Signal Processing Method and Its Application in Seismic Engineering. Chongqing University, 2010, (in Chinese).
About this article

