Abstract
This study presents a new solution to address challenges encountered in additive manufacturing, specifically in the context of 3D printing, where failures can occur due to complications associated with the nozzle or filament. The proposed solution in this research involves using a time-domain feature extraction method that leverages sound and vibration patterns. By implementing sensors to capture these signals in a controlled and noise-free environment, and then utilizing a Multi-Layer Perceptron (MLP) model trained accurately to predict upcoming signals and vibrations, proactive anticipation of printing outcomes is facilitated, including potential failures. Simulation results obtained using MATLAB for the MLP showcase the effectiveness of this approach, demonstrating remarkably low error rates. Furthermore, through rigorous data validation, the proposed method's ability to accurately identify sound and vibration signals is confirmed. As a result, the likelihood of failures is significantly reduced, thereby preventing defects in the filament. The implications of this solution hold great promise in substantially enhancing the reliability and efficiency of additive manufacturing processes.
1. Introduction
3D printing technology, also known as Additive Manufacturing (AM), and its related techniques, such as Fused Deposition Modeling (FDM) or Fused Filament Fabrication (FFF) [1]-[4], have become increasingly popular in recent years [5]-[8]. As it continues to evolve, additive manufacturing solutions are being increasingly explored for orthopedic applications, including the recreation of body parts, the creation of machine parts, and even the construction of houses. This technology offers a reduction in both the time and cost involved in developing a product prior to mass production. Additionally, it allows for quick modifications of parts during product testing. However, while additive manufacturing is highly efficient in producing small batches, it becomes less practical for large-scale manufacturing due to the long production time per unit [9]. Another limitation of additive manufacturing is the potential for material anisotropy in the produced parts due to the layer-based fabrication process. As a result, parts produced using additive manufacturing may not be as smooth as those manufactured using factory-grade equipment, such as injection molding [10]. However, 3D printing technology still faces certain challenges, such as in the area of Non-Destructive Evaluation (NDE) and Non-Destructive Testing (NDT) techniques for monitoring equipment. During the 3D printing process, various issues [11] can cause failures with the filament, such as the heat bed being too close, residual filament in the nozzle, or blockages in the tube. A monitoring system for additive manufacturing refers to the process of collecting and analyzing data during the 3D printing process to ensure that the final product meets the desired specifications [12]. This system typically includes various components, such as sensors, software, and hardware, that track various aspects of the printing process, including temperature [13], layer thickness, material usage, and build progress [14].
Fig. 1Various forms of additive manufacturing, including powder bed fusion, material extrusion, directed energy deposition, vat polymerization, binder jetting, and sheet lamination [15]
![Various forms of additive manufacturing, including powder bed fusion, material extrusion, directed energy deposition, vat polymerization, binder jetting, and sheet lamination [15]](https://static-01.extrica.com/articles/23452/23452-img1.jpg)
The monitoring system [16] can be used to detect and correct any deviations from the intended design, optimize the printing process for maximum efficiency and quality, and provide a detailed record of the manufacturing process for future reference. Monitoring tasks utilizing intelligent algorithms and image processing have been conducted by Ugandhar and Shing Chang [17]. They employed a camera to determine the quality of products, specifically focusing on the “Oval” shape. Additionally, Revin et al. [18] utilized neural networks and several sensors for monitoring and fault detection in 3D printing. By utilizing a monitoring system, manufacturers can improve the accuracy, reliability, and repeatability of their 3D printing operations, leading to better outcomes and greater confidence in the finished product. However, 3D printing machines still have limited condition monitoring techniques. To address this, there is a growing interest in utilizing machine learning techniques [19] to monitor the condition of 3D printing machines. Specifically, the use of intelligent algorithms, such as Artificial Neural Network (ANN) [20], [21], and other time-domain feature extraction [22] methods based on sound and vibration patterns during printing, have shown promise in detecting and predicting conditions within the printing machines. By recording data with sensors [23] within a soundproof room [24], the ANN can anticipate future signals and vibrations, thereby identifying print results and avoiding filament damage. In conclusion, the integration of machine learning techniques [17] into 3D printing monitoring systems has the potential to significantly improve the reliability, efficiency, and quality of the additive manufacturing process [25]. By effectively detecting and predicting machine conditions, manufacturers can reduce the likelihood of failures and optimize their operations for maximum output and quality. This research endeavors to investigate early pattern recognition in the outcomes of 3D printing for cylindrical shapes, utilizing the analysis of sound and vibration signals generated during the printing process. The primary objective is to identify initial indications of issues in the 3D printer, thereby mitigating filament losses caused by unsuccessful print result.
2. Proposed method
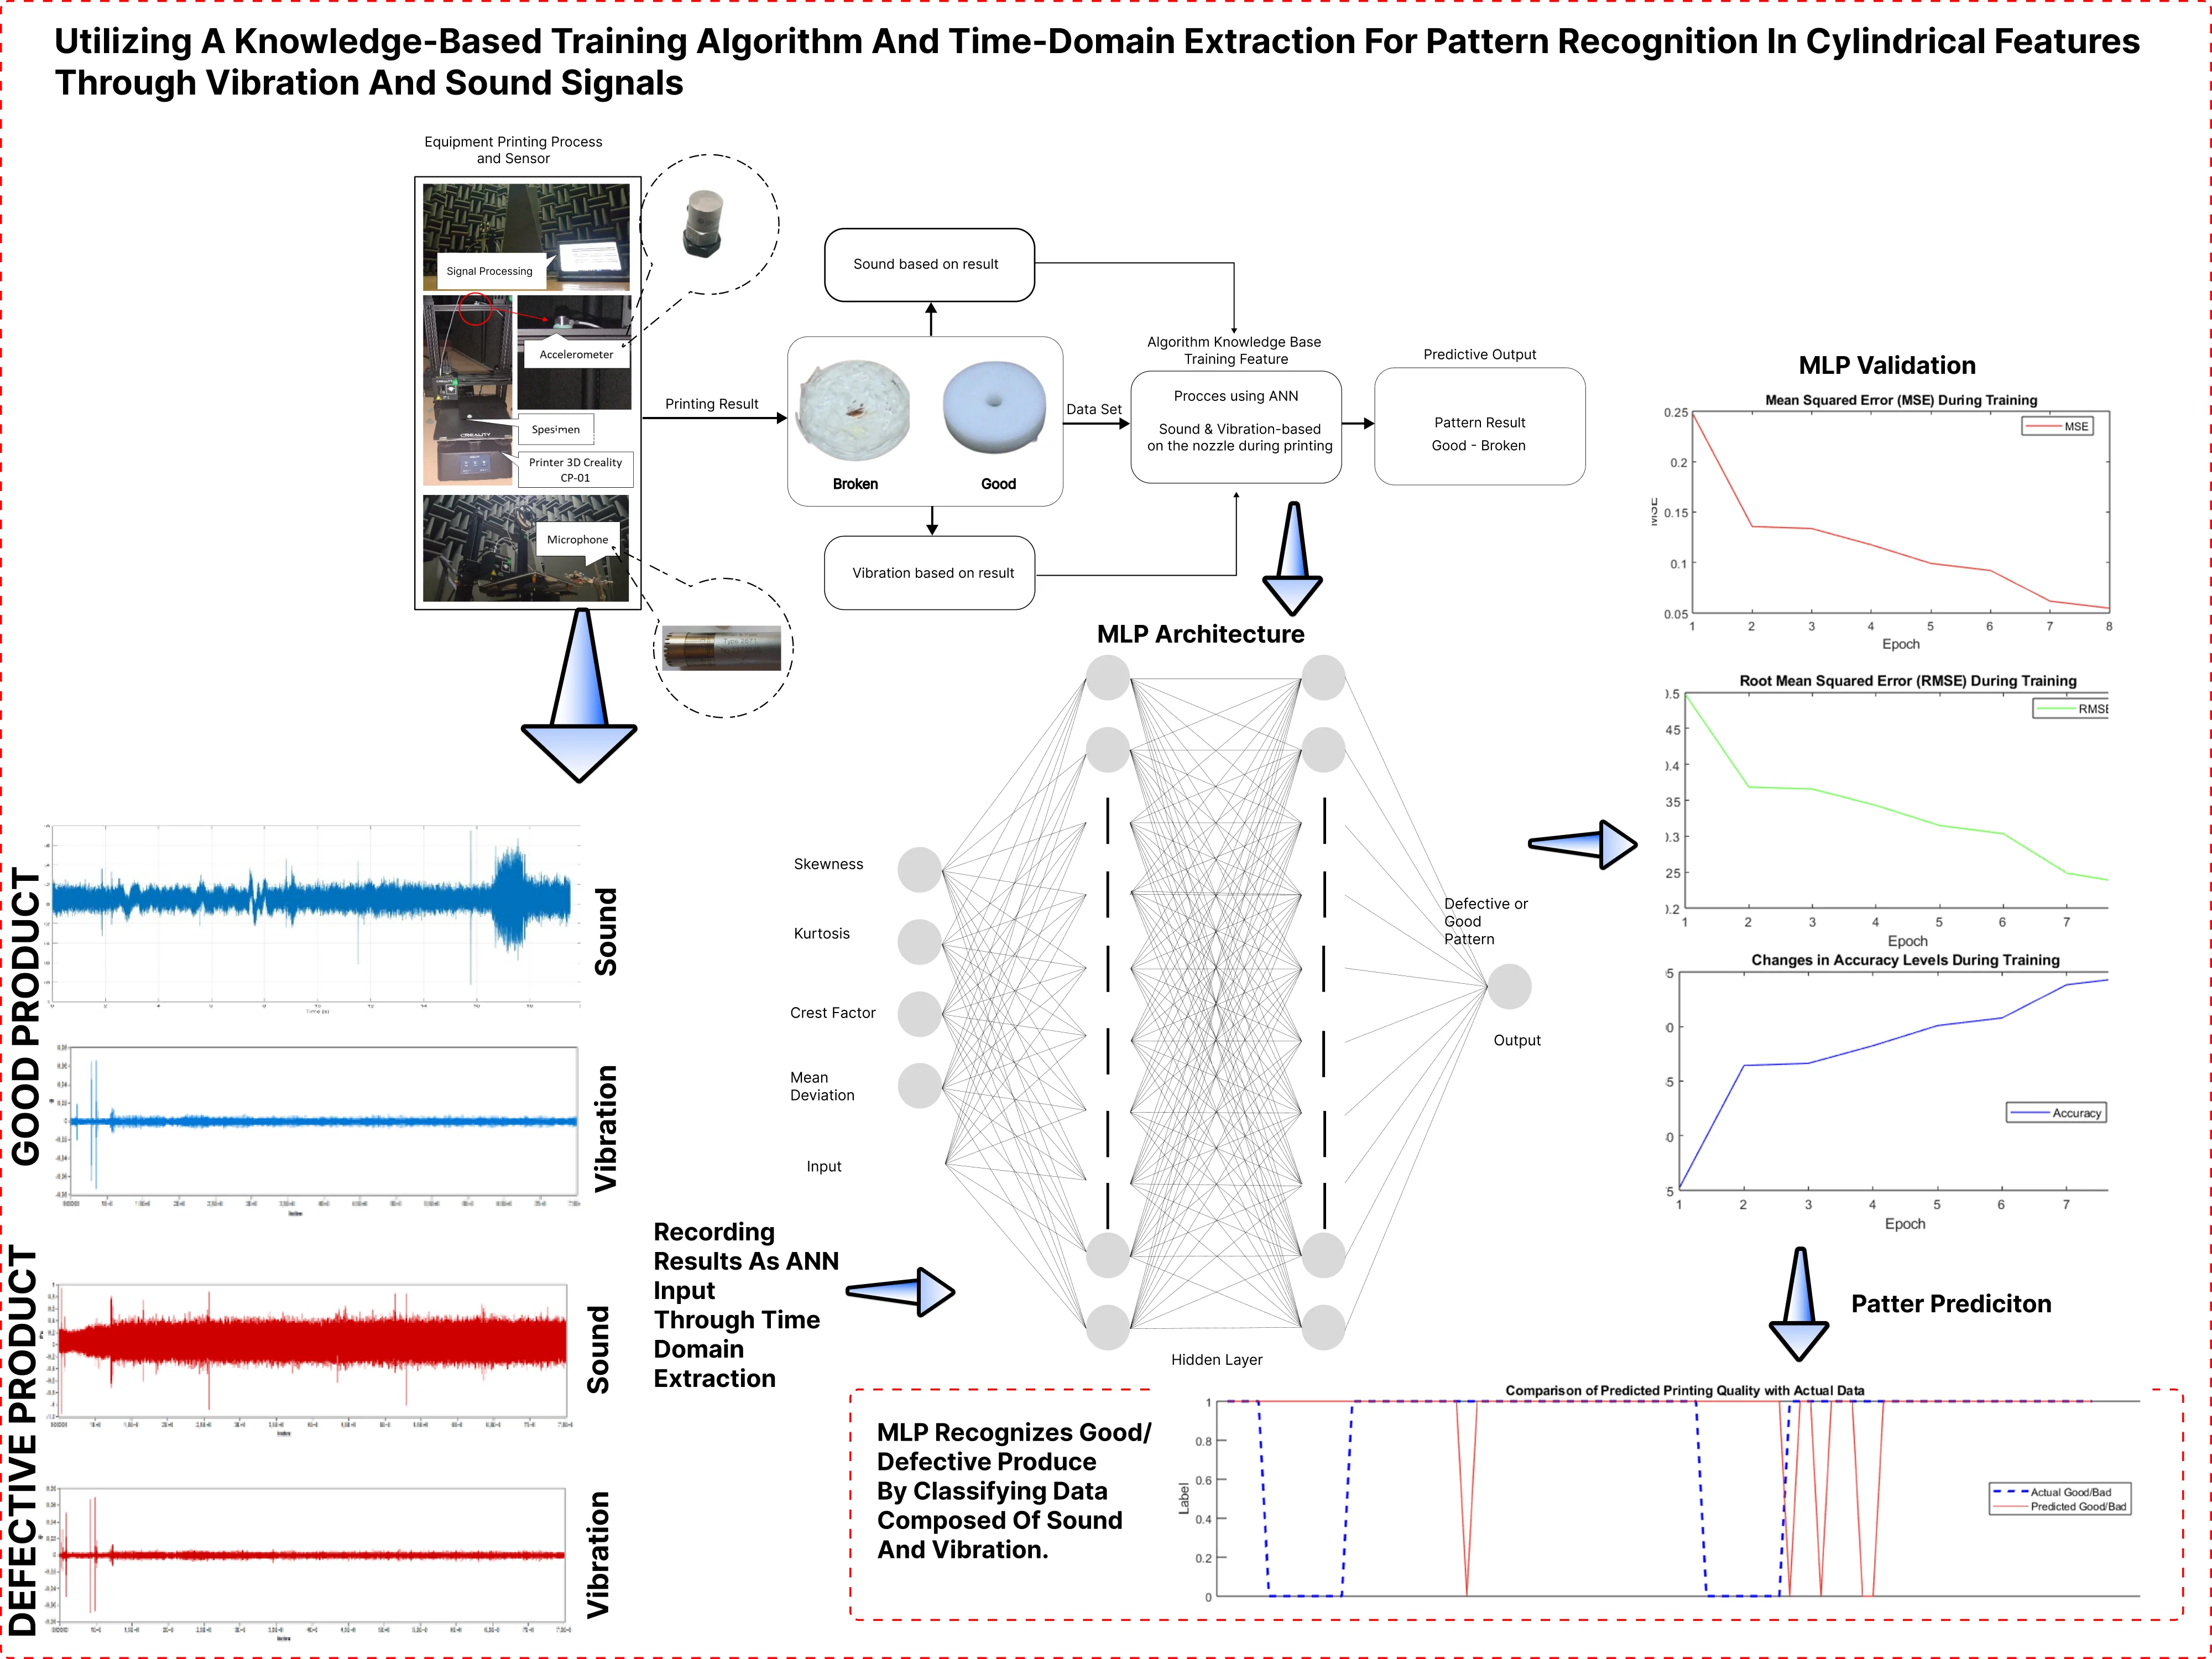
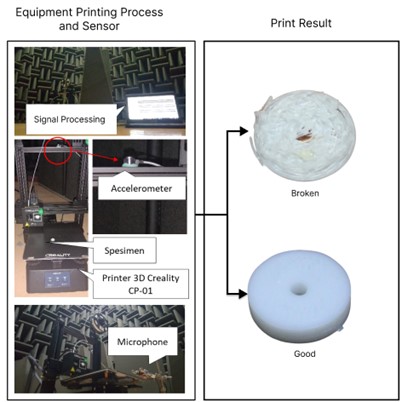
The data analysis process commences with the preparation of test materials using Autodesk Inventor software, resulting in the creation of 3D STL files. To ensure environmental sustainability, PLA, a plastic polymer derived from eco-friendly sources, is employed as the filament of choice. The monitoring of cylindrical features within a controlled acoustic environment is depicted in Fig. 1, accomplished using a 3D Print Creality CP-01 machine paired with a Ni-DAQ 9254 4-channel data logger. Sound and vibration patterns during the printing procedure are captured via two microphone sensors and an accelerometer sensor [26], [27]. The acquired datasets play a vital role in predicting printing outcomes and identifying nozzle-related errors. This research study is focused on investigating the application of cylindrical shapes as representative samples for the purpose of classifying printing data into two categories: damaged or acceptable. The dataset of acceptable products is derived from Layer 1 to Layer 15, comprising a total of 11,200 samples for sound analysis and 9,800 samples for vibration analysis. The classification process is based on the careful analysis of sound waves and vibrations recorded throughout the entire printing process.
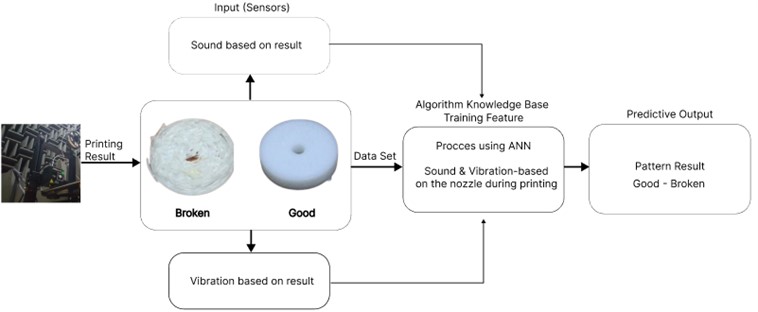
Fig. 2a) Equipment during printing process and result, b) proposed pattern prediction method using ANN
a)
b)
Feature extraction [28] is a crucial process employed to identify and extract pertinent characteristics from signals, facilitating their interpretation while preserving their intrinsic properties [29]. In the present study, we focus on extracting the signal obtained from the printing results to enable the prediction of printing outcomes and monitor nozzle conditions during the printing process, effectively mitigating filament loss and nozzle clogging [31]. This involves meticulous analysis of sound and vibration signals in the time domain, leveraging statistical features such as kurtosis coefficient (KC), crest factor (CF), skewness coefficient (SC), and Mean Deviation [32], as well as additional considerations. These features, calculated based on N sample data points, where represents the discrete signal data, offer valuable insights into the amplitude distribution and the relationship between peak and RMS values. Additionally, the inclusion of median deviation provides information about the spread of data points around the median. The selection of these features in the time domain is underpinned by several reasons, each of which contributes to the robustness and applicability of our methodology. Firstly, this choice aligns with industry practices where time domain analyses find extensive use in real-world manufacturing settings, ensuring that our approach remains relevant to practical applications [5, 13]. Moreover, these features exhibit a unique ability to capture characteristics of signals that are crucial for additive manufacturing quality assessment [32]. Their interpretability and relevance to the physical phenomena being studied make them particularly suitable for our investigation of symmetrical shapes and their printing outcomes. This decision is in line with our overarching research objective of proactive result anticipation and potential nozzle issue detection [8, 18].
Skewness coefficient:
Kurtosis coefficient:
Crest factor:
Mean deviation:
Delving into time domain analysis and utilizing these robust statistical features allows for a comprehensive assessment of the printing process, leading to enhanced prediction accuracy for printing outcomes and timely detection of potential nozzle issues. As a result, this feature-based algorithm holds significant promise for improving additive manufacturing processes and optimizing overall printing performance [31]. The utilization of kurtosis, crest factor, skewness, and median deviation as part of the feature-based algorithm is supported by their ability to capture important aspects of the printing signals, making it a promising approach for enhancing the reliability and efficiency of additive manufacturing [32]. By effectively identifying and extracting meaningful characteristics from the signals, this method contributes to the development of precise and dependable classification systems. Furthermore, as our understanding of symmetrical shapes and their various printing outcomes advances, this research endeavor holds implications for broader applications in the field of additive manufacturing and contributes to the advancement of reliable and efficient manufacturing processes. By adopting a meticulous and well-designed methodology, this study aims to pave the way for further advancements in additive manufacturing technology, benefiting a wide range of industries and applications.
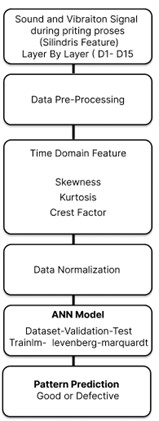
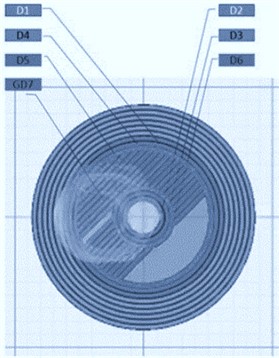
Fig. 3a) Flowchart of proposed prediction using time domain, b) characteristic of printing movement layer by layer
a)
b)
Data normalization holds a significant role as a preprocessing step in numerous machine learning algorithms [33], [34]. Raw data and extracted features often manifest distinct scales, which can introduce challenges during the training phase, leading to decreased accuracy and extended training times. In Fig. 3, a visual representation is provided, illustrating accordance with the layer-by-layer printing process [35]. The recording of sound and vibration signals commences from the initial printing layer situated on the outermost side and progressively advances towards the innermost layer. This meticulous approach grants comprehensive insights into the complete printing process, spanning from its inception to its culmination. Table 1 represents the time domain signal data that has been normalized and extracted for use as a dataset, the data from each layer is different. For example, layer 1 has over 100 features for sound and vibration extraction, and the same goes for the other layers, depending on the desired model to be produced:
3. MLP neural network model
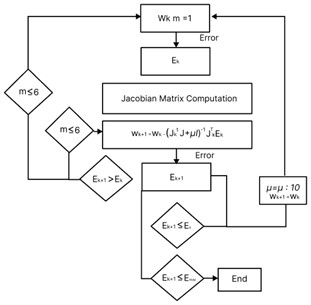
The present study proposes a novel approach that employs an MLP Neural Network (NN) to analyze symmetrical shapes using a feature-based algorithm. Various types of ANN models are explored, including Perceptron, Feed Forward Neural Networks, Backpropagation Neural Network, Multilayer Perceptron, Convolutional Neural Network (CNN), Radial Basis Function Neural Networks (RBFNN), and Modular Neural Network [36]-[38]. The methodology is built upon a meticulously curated dataset comprising printing results with varying conditions, encompassing both defective and good outcomes. The accuracy of the ANN hinges upon its effective classification of the training, validation, and testing datasets in the context of classification problems. In this research, we specifically focus on the application of ANNs (Artificial Neural Networks) rather than SNNs (Spiking Neural Networks), which is a different neural network paradigm. To train the ANN, the “trainlm” batch training algorithm is utilized, leveraging the powerful Levenberg-Marquardt optimization technique to fine-tune the weight and bias values. The performance function employed in this study is the logistic sigmoid transfer function, responsible for mapping the output of the input layer. The evaluation of the NN's performance is conducted through the application of the Mean Square Error (MSE) and Root Mean Square Error (RMSE) [39], which comprehensively assesses the discrepancy between the target output and the actual output. This evaluation sheds light on the network’s efficacy in accurately predicting and classifying the data. By implementing this meticulously designed methodology, we aim to enhance our understanding of symmetrical shapes and their various printing outcomes, ultimately advancing the development of reliable and precise classification systems in the field of printing technology.
Table 1Extraction printing signal sample in time domain layer 1 – 7 – 15
Defective-Sound | Good Product-Sound | ||||||||
Layer | Signal | SC | KC | CF | MD | SC | KC | CF | MD |
D1 | 1 | 0,802 | 0,264 | 0,202 | 0,510 | 0,991 | 0,307 | 0,304 | 1.000 |
0,839 | 0,544 | 0,176 | 0,492 | 0,632 | 0,911 | 0,206 | 0,590 | ||
0,954 | 0,306 | 0,084 | 0,517 | 0,838 | 0,891 | 0,571 | 0,604 | ||
0,636 | 0,470 | 0,242 | 0,485 | 0,323 | 0,176 | 0,071 | 0,597 | ||
0,984 | 0,348 | 0,106 | 0,510 | 0,660 | 0,251 | 0,406 | 0,611 | ||
D7 | 1 | 0,920 | 0,813 | 1,000 | 0,516 | 0,649 | 0,579 | 0,475 | 0,590 |
0,730 | 0,544 | 0,673 | 0,590 | 0,318 | 0,535 | 0,171 | 0,604 | ||
0,723 | 0,000 | 0,132 | 0,604 | 0,532 | 0,535 | 0,431 | 0,597 | ||
1,000 | 0,416 | 0,676 | 0,597 | 0,547 | 0,561 | 0,131 | 0,611 | ||
0,700 | 0,813 | 0,585 | 0,611 | 0,552 | 0,660 | 0,353 | 0,601 | ||
D15 | 1 | 0,413 | 0,035 | 0,046 | 0,601 | 0,107 | 0,007 | 0,516 | 0,608 |
0,887 | 1,000 | 0,589 | 0,608 | 0,145 | 0,008 | 0,121 | 0,594 | ||
0,502 | 0,555 | 0,212 | 0,515 | 0,247 | 0,005 | 0,313 | 0,594 | ||
0,833 | 0,522 | 0,404 | 0,515 | 0,313 | 0,005 | 0,268 | 0,604 | ||
0,518 | 0,105 | 0,099 | 0,516 | 0,158 | 1,000 | 0,892 | 0,601 | ||
Defective-Vibration | Good-Vibration | ||||||||
Layer | Signal | SC | KC | CF | MD | SC | KC | CF | MD |
D1 | 1 | 0,220 | 0,046 | 0,000 | 0,597 | 0,619 | 0,000 | 0,266 | 0,608 |
0,139 | 0,308 | 0,530 | 0,611 | 0,396 | 0,363 | 0,135 | 0,597 | ||
0,379 | 0,275 | 0,206 | 0,601 | 1,000 | 0,299 | 0,528 | 0,604 | ||
0,532 | 0,437 | 0,647 | 0,608 | 0,760 | 0,826 | 1,000 | 0,611 | ||
0,000 | 0,214 | 0,047 | 0,594 | 0,000 | 0,360 | 0,166 | 0,601 | ||
D7 | 1 | 0,836 | 0,110 | 0,545 | 0,510 | 0,247 | 0,626 | 0,653 | 0,594 |
0,844 | 0,104 | 0,554 | 0,498 | 0,361 | 0,338 | 0,214 | 0,604 | ||
0,461 | 0,069 | 0,158 | 0,460 | 0,313 | 0,076 | 0,000 | 0,597 | ||
0,000 | 1,000 | 1,000 | 0,501 | 0,346 | 0,121 | 0,276 | 0,608 | ||
0,783 | 0,069 | 0,463 | 0,511 | 0,645 | 0,087 | 0,136 | 0,601 | ||
D15 | 1 | 0,836 | 0,110 | 0,545 | 0,526 | 0,634 | 0,257 | 0,403 | 0,611 |
0,844 | 0,104 | 0,554 | 0,485 | 0,553 | 0,166 | 0,312 | 0,594 | ||
0,461 | 0,069 | 0,158 | 0,486 | 0,474 | 0,156 | 0,463 | 0,604 | ||
0,000 | 1,000 | 1,000 | 0,487 | 0,672 | 0,261 | 0,225 | 0,597 | ||
0,783 | 0,069 | 0,463 | 0,488 | 0,336 | 0,141 | 0,000 | 0,608 | ||
Activation function:
Mean square error:
Root main square error:
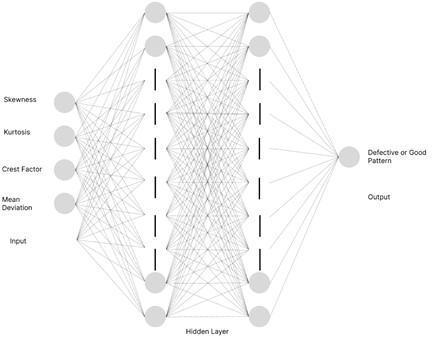
Fig. 4a) Proposed neural network architecture, b) Levenberg-Marquardt flowchart
a)
b)
Table 2Perceptron of ANN
MLP | |
Neuron in input layer | 4 |
Neurons in the 1st hidden layer | 10 |
Neurons in the 2nd hidden layer | 10 |
Output layer | 1 |
Number of Epoch | 1000 |
4. Adaptive manufacture and phenomenon
Machine movement results in an adaptive manufacturing phenomenon that produces characteristic vibration and sound signals. Fig. 4 displays the interpreted vibration and acoustic signal features based on the results obtained from the accelerometer and microphone. The first stage involves recording the vibration signal from the accelerometer in digital form using Ni-DAQ. The data is then processed through Ni-Signal Express software to be used as a prediction dataset after time domain extraction.
During the printing process, an in-depth analysis of sound and vibration data was conducted. Fig. 5 displays sound and vibration signals during the printing process under both good and bad conditions, then focusing on parameters such as skewness, kurtosis, and crest factor in the time domain. The acquired data was subsequently normalized and utilized as input for a neural network, trained using the Feed-forward Backpropagation algorithm with the “Trainlm” (Levenberg-Marquardt) optimization technique in MATLAB. In-depth examination of the printing process was then carried out through time domain analysis. To evaluate the reliability of the trained neural network, regression values were carefully assessed, providing a robust measure of the accuracy in predicting both actual and anticipated values.
Fig. 5Interpretation of vibration and sound signal results during the printing process due to microphone and acceleration (before extraction)
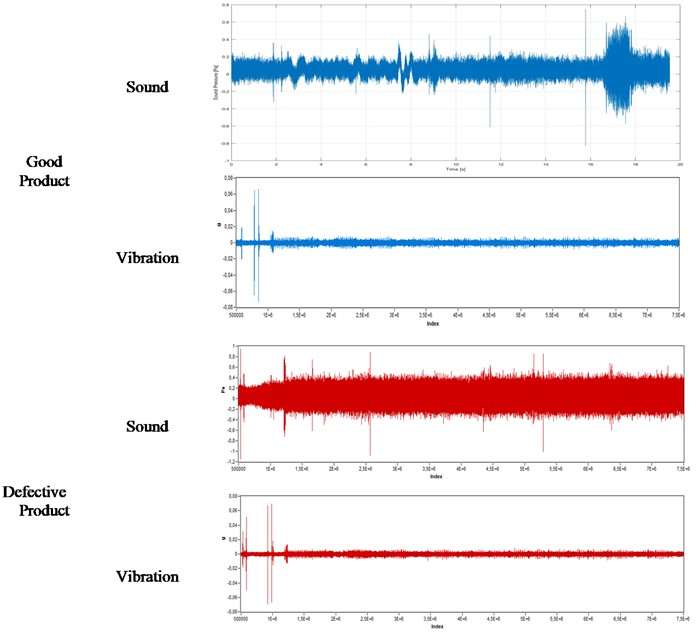
Fig. 6a) Regression plot of the proposed model for training, validation and testing data; b) MSE validation performance
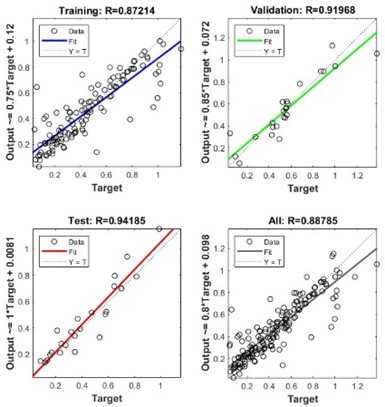
a)

b)
Fig. 6(a) illustrates the regression plots for the training, validation, and testing datasets, while Fig. 6(b) showcases the correlation coefficient for various neurons within the hidden layer. Employing a neural network architecture featuring 10 neurons in the hidden layer, a tangent transfer function, and a logsig output layer, yielded the most favorable outcomes, as indicated by -values of 0.872 for both the training and testing stages. This correlation coefficient signifies the strength of the relationship between the dataset and the target variable. For optimum training results, a testing iteration of 1000 epochs was employed, yielding a validation value of 0.919, thus demonstrating exceptional validation outcomes with a close match between the output and error values. Overall, the regression value attained a commendable 0.882, indicating a high degree of concordance between the predicted and actual values for all printing result datasets. Remarkably, our Artificial Neural Network (ANN) showcases the capability to discern patterns in both intact and defective products. Validation of the results in the Artificial Neural Network (ANN) was performed using Mean Square Error (MSE), which is a parameter used to measure the accuracy of the test results. Fig. 6(b) displays the validation graph of the repeatedly trained data, demonstrating minimal error with an MSE. A lower MSE value indicates higher accuracy. Furthermore, output and error parameters were analyzed to assess the success of the predictions based on the dataset.
5. Result and discussion
This study highlights the Neural Network’s (NN) successful prediction of cylindrical 3D printing outcomes, particularly for cylindrical shapes, as depicted in Fig. 7.
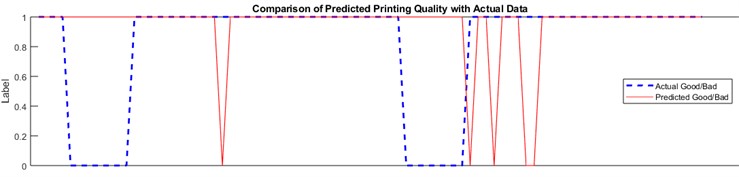
Fig. 7a) NN accuracy, b) RMSE, c) MSE, d) test results between training data and test data, e) comparison of predicted and actual data in determining printing results (good or defective)
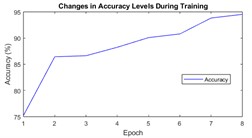
a)
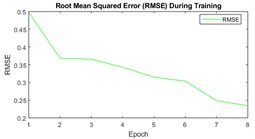
b)
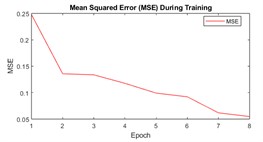
c)
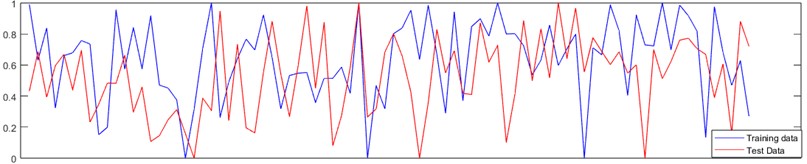
d)
e)
The validation process involved meticulous reprinting, ensuring robustness, and enabling comprehensive comparison with actual data. Notably, Fig. 7(a) demonstrates the NN’s impressive accuracy exceeding 80 % during training. Additionally, Fig. 7(b) and 7(c) analyze the network’s error performance. Rigorous pattern testing, utilizing binary codes 0 and 1 to signify defective and optimal products, was systematically conducted. Fig. 7(e) visually illustrates the NN’s adeptness in discerning intricate patterns for both categories. This research significantly contributes to manufacturing by offering proactive quality assessment insights into vibrational and auditory patterns during cylindrical 3D printing, enhancing predictive precision and overall production processes.
Table 3Error calculated of NN performance
Dataset | MSE | RMSE |
Train | 0.21 | 0.46 |
Validation | 0.03 | 0.18 |
Test | 0.21 | 0.46 |
Accuracy | 80.9524 % | |
6. Conclusions
An approach for predicting the results of 3D printing using a trained artificial neural network. The approach involves analyzing pattern signals and vibrations recorded during the printing process of symmetrical features in a soundproof room. The process starts with recognizing pattern signals layer by layer, based on successful and failed printing conditions. The collected data is then processed using Ni-Signal Express to extract features such as skewness, kurtosis, and crest factor, which are used as inputs for the MLP neural network. The network has a small MSE and RMSE which can accurately classify and predict the volume percentage of the printed object. This enables detection of signals during the printing process to determine good or defective products and prevent filament loss due to failed prints. The proposed approach has the potential to improve the efficiency and quality of 3D printing by implementing monitoring and identification of issues during the printing process through time domain extraction. However, this method can be further expanded and implemented in future research to accommodate the diverse range of shapes that are produced through 3D printing.
References
-
R. B. Kristiawan, F. Imaduddin, D. Ariawan, Ubaidillah, and Z. Arifin, “A review on the fused deposition modeling (FDM) 3D printing: Filament processing, materials, and printing parameters,” Open Engineering, Vol. 11, No. 1, pp. 639–649, Apr. 2021, https://doi.org/10.1515/eng-2021-0063
-
A. Szmidt and A. Rębosz-Kurdek, “New approaches of improving FDM/FFF printing technology,” Mechanik, Vol. 90, No. 3, pp. 258–261, Mar. 2017, https://doi.org/10.17814/mechanik.2017.3.46
-
M. Yakout, M. A. Elbestawi, and S. C. Veldhuis, “A review of metal additive manufacturing technologies,” Solid State Phenomena, Vol. 278, pp. 1–14, Jul. 2018, https://doi.org/10.4028/www.scientific.net/ssp.278.1
-
Y. Tao et al., “A review on voids of 3D printed parts by fused filament fabrication,” Journal of Materials Research and Technology, Vol. 15, pp. 4860–4879, Nov. 2021, https://doi.org/10.1016/j.jmrt.2021.10.108
-
V. Cabreira and R. M. C. Santana, “Effect of infill pattern in fused filament fabrication (FFF) 3D Printing on materials performance,” Matéria (Rio de Janeiro), Vol. 25, No. 3, pp. e–12826, 2020, https://doi.org/10.1590/s1517-707620200003.1126
-
M. Baechle-Clayton, E. Loos, M. Taheri, and H. Taheri, “Failures and flaws in fused deposition modeling (FDM) additively manufactured polymers and composites,” Journal of Composites Science, Vol. 6, No. 7, p. 202, Jul. 2022, https://doi.org/10.3390/jcs6070202
-
L. Sandanamsamy et al., “A comprehensive review on fused deposition modelling of polylactic acid,” Progress in Additive Manufacturing, Vol. 8, No. 5, pp. 775–799, Oct. 2023, https://doi.org/10.1007/s40964-022-00356-w
-
J. I. Aguilar-Duque, J. L. Garcia, and J. L. Hernández-Arellano, “Additive manufacturing using Fused Filament Fabrication: evolution and trends,” Research Square Platform LLC, Feb. 2021.
-
T. D. Ngo, A. Kashani, G. Imbalzano, K. T. Q. Nguyen, and D. Hui, “Additive manufacturing (3D printing): A review of materials, methods, applications and challenges,” Composites Part B: Engineering, Vol. 143, pp. 172–196, Jun. 2018, https://doi.org/10.1016/j.compositesb.2018.02.012
-
M. A. Sarabia-Vallejos, F. E. Rodríguez-Umanzor, C. M. González-Henríquez, and J. Rodríguez-Hernández, “Innovation in additive manufacturing using polymers: a survey on the technological and material developments,” Polymers, Vol. 14, No. 7, p. 1351, Mar. 2022, https://doi.org/10.3390/polym14071351
-
Y. Tlegenov, G. S. Hong, and W. F. Lu, “Nozzle condition monitoring in 3D printing,” Robotics and Computer-Integrated Manufacturing, Vol. 54, pp. 45–55, Dec. 2018, https://doi.org/10.1016/j.rcim.2018.05.010
-
A. O. Oluwajobi and F. O. Kolawole, “Design of a fused filament fabrication (FFF) 3D-printer,” Nigerian Journal of Technology, Vol. 40, No. 2, pp. 252–260, Oct. 2021, https://doi.org/10.4314/njt.v40i2.10
-
V. E. Kuznetsov, A. N. Solonin, A. Tavitov, O. Urzhumtsev, and A. Vakulik, “Increasing strength of FFF three-dimensional printed parts by influencing on temperature-related parameters of the process,” Rapid Prototyping Journal, Vol. 26, No. 1, pp. 107–121, Jan. 2020, https://doi.org/10.1108/rpj-01-2019-0017
-
E. Prianto, H. Sigit Pramono, and Yuchofif, “IoT-based 3D printer development for student competence improvement,” in Journal of Physics: Conference Series, Vol. 2111, No. 1, p. 012002, Nov. 2021, https://doi.org/10.1088/1742-6596/2111/1/012002
-
Editorial Staff. “What is Additive Manufacturing? (Working, Types, and Technologies).”. https://www.erp-information.com/additive-manufacturing (accessed 2023).
-
K. Gomathi, T. Ganesh, J. Bharanidharan, A. P. Arvindh Prajathkar, and R. Aravinthan, “Condition monitoring of 3D printer using micro accelerometer,” in IOP Conference Series: Materials Science and Engineering, Vol. 1055, No. 1, p. 012035, Feb. 2021, https://doi.org/10.1088/1757-899x/1055/1/012035
-
U. Delli and S. Chang, “Automated process monitoring in 3D printing using supervised machine learning,” Procedia Manufacturing, Vol. 26, pp. 865–870, 2018, https://doi.org/10.1016/j.promfg.2018.07.111
-
R. N. Alief, M. R. Redha, M. Verana, M. Adi, and P. Putra, “Multiple sensors scheme on 3D printing for monitoring and fault detection,” in KICS, 2021.
-
S. Nasiri and M. R. Khosravani, “Machine learning in predicting mechanical behavior of additively manufactured parts,” Journal of Materials Research and Technology, Vol. 14, pp. 1137–1153, Sep. 2021, https://doi.org/10.1016/j.jmrt.2021.07.004
-
M. A. Mahmood, A. I. Visan, C. Ristoscu, and I. N. Mihailescu, “Artificial neural network algorithms for 3D printing,” Materials, Vol. 14, No. 1, p. 163, Dec. 2020, https://doi.org/10.3390/ma14010163
-
B. Yin, F. Corradi, and S. M. Bohté, “Accurate and efficient time-domain classification with adaptive spiking recurrent neural networks,” Nature Machine Intelligence, Vol. 3, No. 10, pp. 905–913, Oct. 2021, https://doi.org/10.1038/s42256-021-00397-w
-
J. Chen, B. Xu, and X. Zhang, “A vibration feature extraction method based on time-domain dimensional parameters and Mahalanobis distance,” Mathematical Problems in Engineering, Vol. 2021, pp. 1–12, Jul. 2021, https://doi.org/10.1155/2021/2498178
-
A. Pilipović, G. Baršić, M. Katić, and M. Rujnić Havstad, “Repeatability and reproducibility assessment of a polyjet technology using x-ray computed tomography,” Applied Sciences, Vol. 10, No. 20, p. 7040, Oct. 2020, https://doi.org/10.3390/app10207040
-
K. Monkova, M. Vasina, P. P. Monka, J. Vanca, and D. Kozak, “Effect of 3D-printed PLA structure on sound reflection properties,” Polymers, Vol. 14, No. 3, p. 413, Jan. 2022, https://doi.org/10.3390/polym14030413
-
G. A. R. Sampedro, D. J. S. Agron, G. C. Amaizu, D.-S. Kim, and J.-M. Lee, “Design of an in-process quality monitoring strategy for FDM-Type 3D printer using deep learning,” Applied Sciences, Vol. 12, No. 17, p. 8753, Aug. 2022, https://doi.org/10.3390/app12178753
-
Y. Tlegenov, W. F. Lu, and G. S. Hong, “A dynamic model for current-based nozzle condition monitoring in fused deposition modelling,” Progress in Additive Manufacturing, Vol. 4, No. 3, pp. 211–223, Sep. 2019, https://doi.org/10.1007/s40964-019-00089-3
-
S. Pagliano et al., “Micro 3D printing of a functional MEMS accelerometer,” Microsystems and Nanoengineering, Vol. 8, No. 1, pp. 1–11, Sep. 2022, https://doi.org/10.1038/s41378-022-00440-9
-
W. Caesarendra and T. Tjahjowidodo, “A review of feature extraction methods in vibration-based condition monitoring and its application for degradation trend estimation of low-speed slew bearing,” Machines, Vol. 5, No. 4, p. 21, Sep. 2017, https://doi.org/10.3390/machines5040021
-
M. Dirhamsyah, H. Riza, F. D. Ariefianto, U. Aulia, and M. Z. B. Nuawi, “Feature variations on the cartesian 3D print machine using vibration and sound signal readings,” in Proceedings of the 2nd International Conference on Experimental and Computational Mechanics in Engineering, Singapore: Springer Singapore, 2021, pp. 481–499, https://doi.org/10.1007/978-981-16-0736-3_45
-
G. Sharma, K. Umapathy, and S. Krishnan, “Trends in audio signal feature extraction methods,” Applied Acoustics, Vol. 158, p. 107020, Jan. 2020, https://doi.org/10.1016/j.apacoust.2019.107020
-
N. Lambos, G.-C. Vosniakos, and G. Papazetis, “Low-cost automatic identification of nozzle clogging in material extrusion 3D printers,” Procedia Manufacturing, Vol. 51, pp. 274–279, 2020, https://doi.org/10.1016/j.promfg.2020.10.039
-
A. K. Alanazi et al., “Application of neural network and time-domain feature extraction techniques for determining volumetric percentages and the type of two phase flow regimes independent of scale layer thickness,” Applied Sciences, Vol. 12, No. 3, p. 1336, Jan. 2022, https://doi.org/10.3390/app12031336
-
R. Yogitha and G. Mathivanan, “Performance analysis of transfer functions in an artificial neural network,” in 2018 International Conference on Communication and Signal Processing (ICCSP), p. 2018, Apr. 2018, https://doi.org/10.1109/iccsp.2018.8524387
-
D. Singh and B. Singh, “Investigating the impact of data normalization on classification performance,” Applied Soft Computing, Vol. 97, p. 105524, Dec. 2020, https://doi.org/10.1016/j.asoc.2019.105524
-
A. Dirhamsyah, M., T. Edisah Putra, and A., “Condition Monitoring Based On Sounds And Vibrations On The 3-D Printing Cartesian,” Lecture in Computational and Exprerimental Mechanism, 2023.
-
Y. Raptodimos and I. Lazakis, “An ANN approach for predicting the performance of machinery equipment,” in Maritime Safety and Operations 2016 Conference Proceedings, 2023.
-
T. Jayalakshmi and A. Santhakumaran, “Statistical normalization and back propagation for classification,” International Journal of Computer Theory and Engineering, Vol. 3, No. 1, pp. 89–93, 2011, https://doi.org/10.7763/ijcte.2011.v3.288
-
M. Fernandes, J. M. Corchado, and G. Marreiros, “Machine learning techniques applied to mechanical fault diagnosis and fault prognosis in the context of real industrial manufacturing use-cases: a systematic literature review,” Applied Intelligence, Vol. 52, No. 12, pp. 14246–14280, Sep. 2022, https://doi.org/10.1007/s10489-022-03344-3
-
D. K. Jana, P. Bhunia, S. Das Adhikary, and B. Bej, “Optimization of effluents using artificial neural network and support vector regression in detergent industrial wastewater treatment,” Cleaner Chemical Engineering, Vol. 3, p. 100039, Sep. 2022, https://doi.org/10.1016/j.clce.2022.100039
-
C. M. Vastrad, “Performance analysis of neural network models for oxazolines and oxazoles derivatives descriptor dataset,” International Journal of Information Sciences and Techniques, Vol. 3, No. 6, pp. 1–15, Nov. 2013, https://doi.org/10.5121/ijist.2013.3601
About this article

The authors have not disclosed any funding.
Thanks to the Acoustic Laboratorium, Department of Mechanical and Manufacturing Engineering, Faculty of Engineering and Built Environment, Universiti Kebangsaan Malaysia.
The datasets generated during and/or analyzed during the current study are available from the corresponding author on reasonable request.
Muhammad Dirhamsyah: conceptualization, methodology, validation, formal analysis, writing – original draft, investigation, resources. Hammam Riza: validation, formal analysis. Muhammad Syamsu Rizal: investigation, resources, review and editing.
The authors declare that they have no conflict of interest.
