Abstract
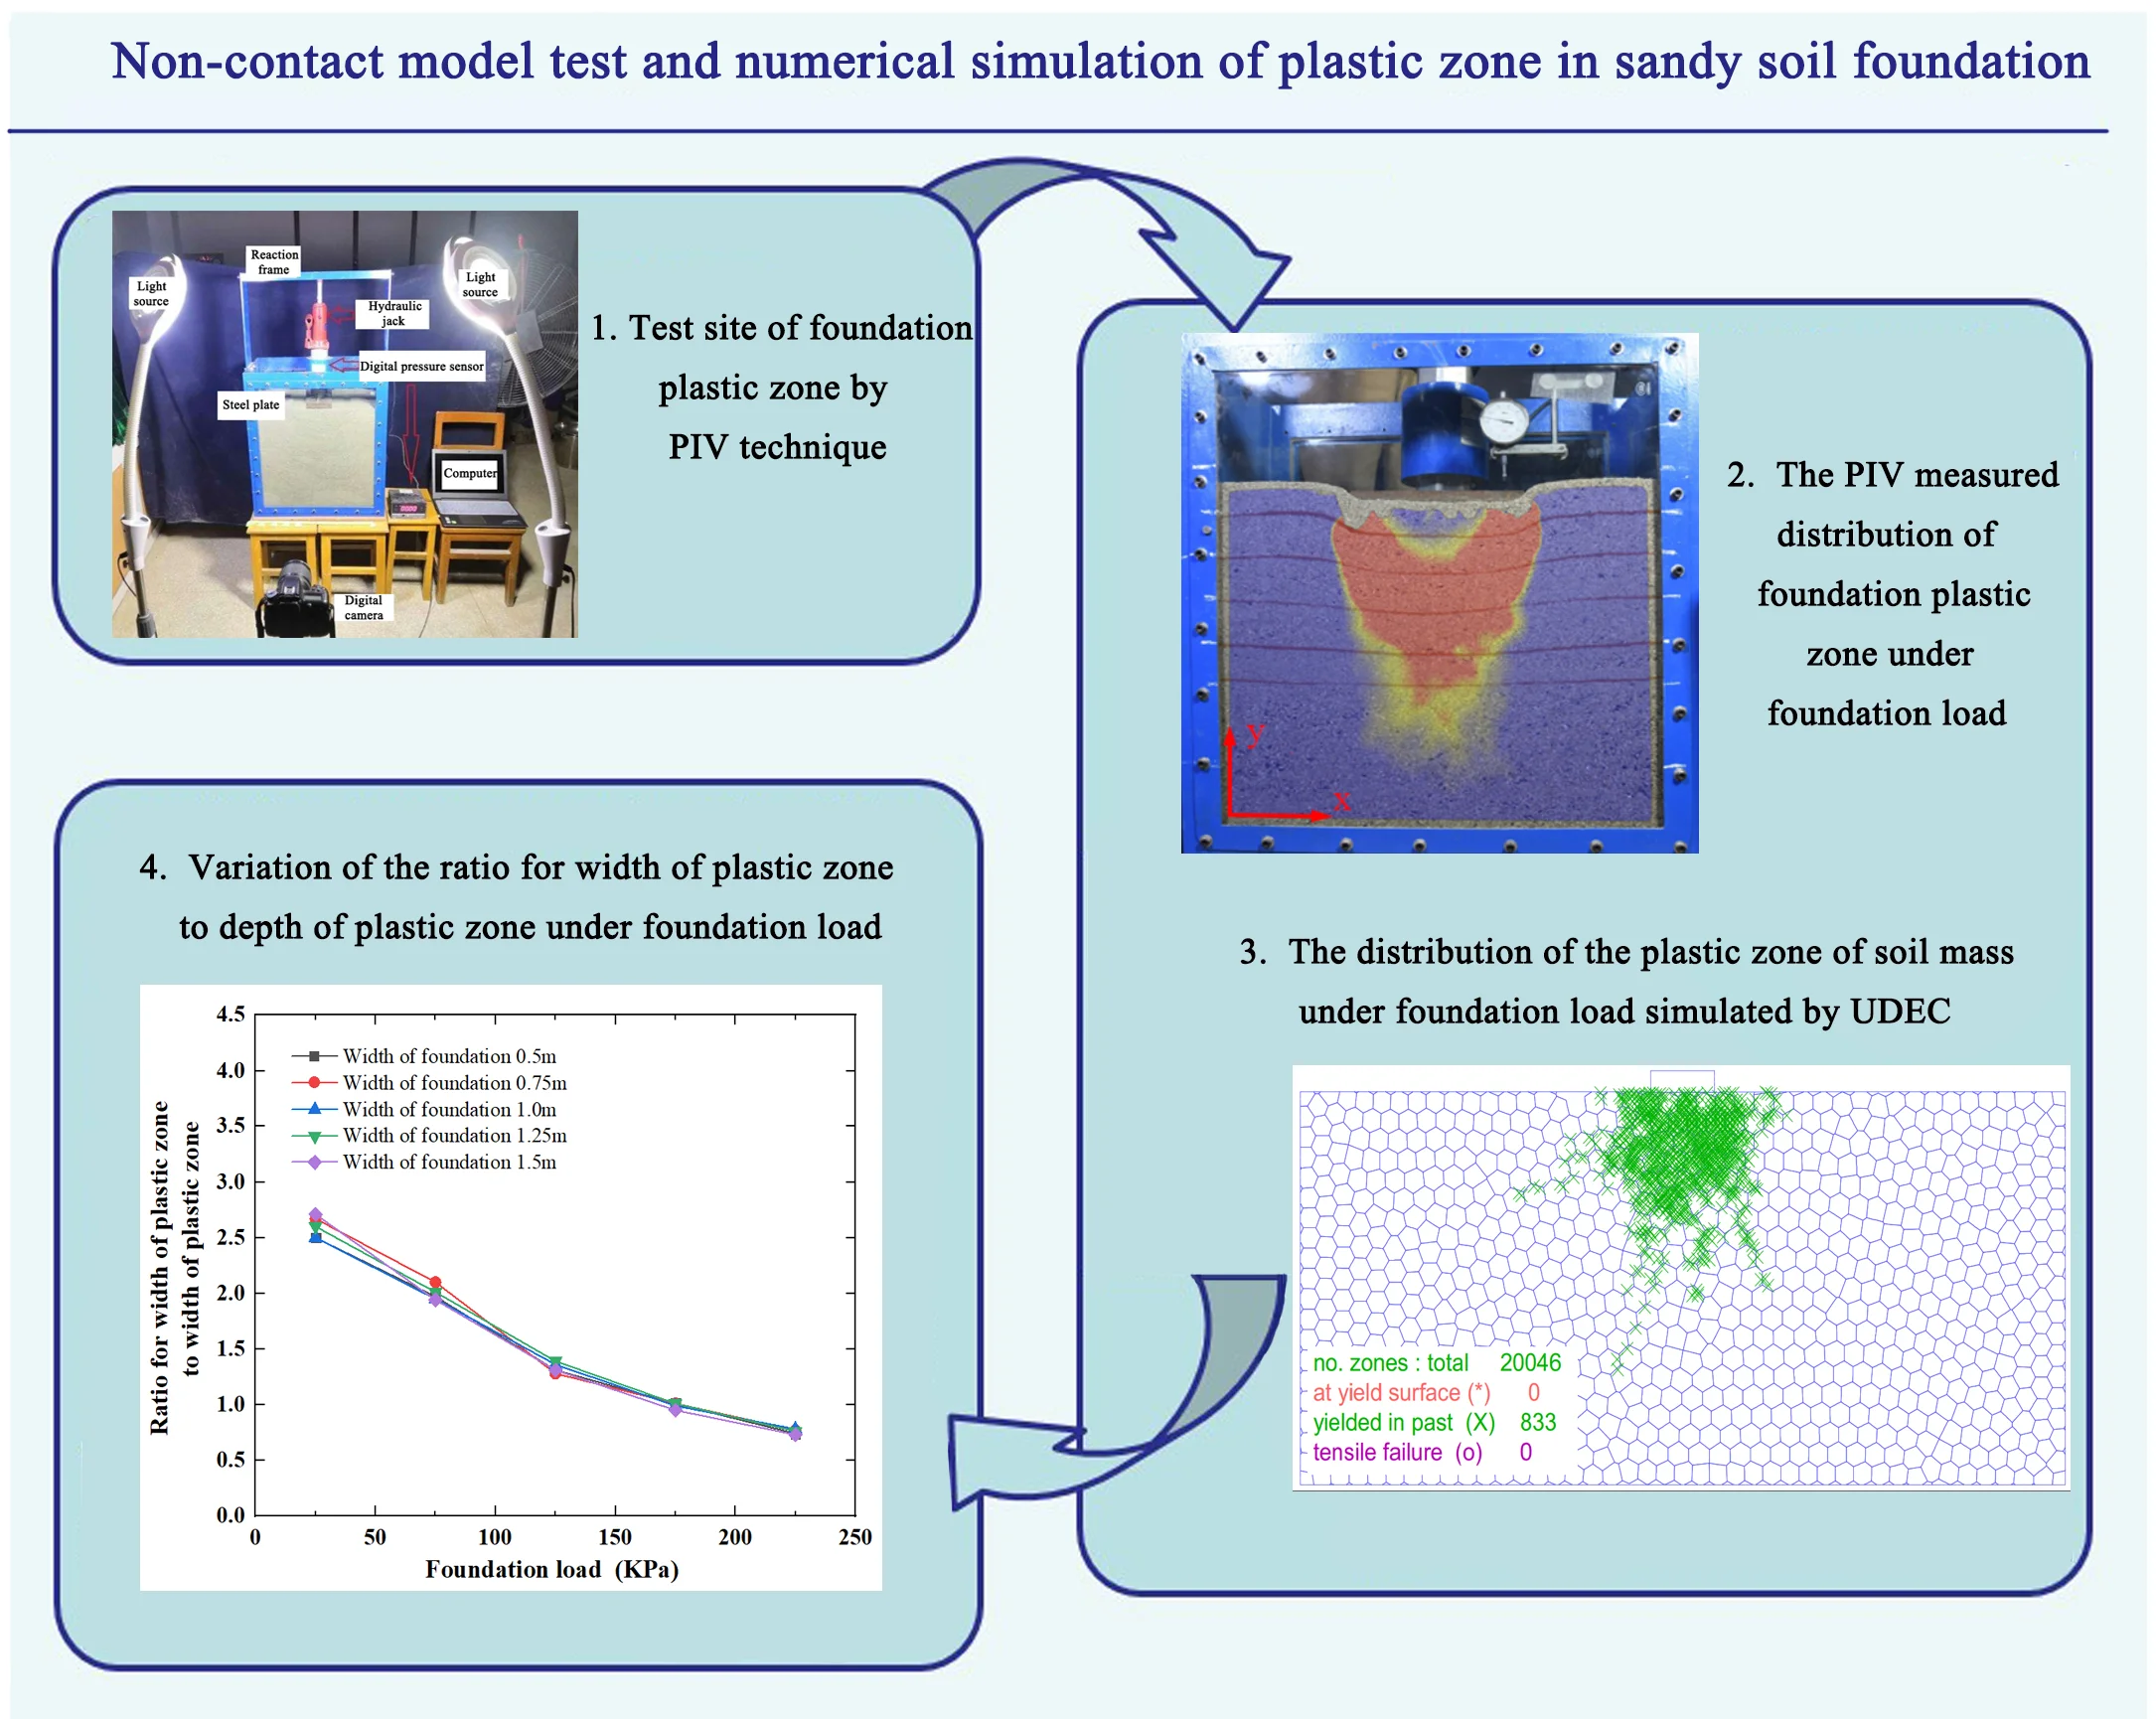
Reasonable determination of the ultimate bearing capacity of the foundation is of great significance in engineering applications. Based on the self-developed non-contact testing device for the plastic zone of shallow foundation, this paper carries out model test research on the plastic zone of sandy soil shallow foundation and analyzes the development law of plastic zone under the action of foundation load. The main advantages and functional characteristics of the foundation plastic zone test system are that it can realize the non-contact test of displacement deformation of soil, the dynamic development process of shear deformation, and the plastic zone of model foundation can be obtained intuitively. The development process, morphological boundary characteristics, and foundation failure mode of the plastic zone of the sand foundation are obtained. The plastic zone of the foundation starts from the edges of both sides of the bearing plate; with the increase of the load, the plastic zone gradually develops downward and approaches to the center line, and finally crosses through at the bottom until the local shear failure of the foundation occurs. The measured plastic zone is a symmetrical spindle shape with thin ends and a bulge in the middle; the sand on both sides of the bearing plate partially bulges, forming a “V” shaped shear failure zone, and the bottom of bearing plate forms a triangular compression zone, the foundation failure mode of sandy soil represents a typical punching shear failure mode. In order to study the distribution characteristics of the plastic zone range of foundation under different foundation loads and foundation widths, the Universal Distinct Element Code (UDEC) based on the discrete element method is used for numerical simulation research. By conducting parameterized numerical simulation test for the plastic zone of foundation and analyzing the results, with the changes in the foundation load and the foundation width, the variation law of (1) the depth of the plastic zone on the foundation bottom, (2) the width of the plastic zone on both sides of the foundation, (3) the ratio for the depth of plastic zone to the width of foundation, (4) the ratio for the width of plastic zone to the width of foundation and (5) the ratio for the width of plastic zone to the depth of plastic zone is obtained. The research has significant guiding significance for the study of the development law of plastic zone and foundation design.
Highlights
- The model test research on the plastic zone of sandy soil shallow foundation and the analysis of the development law of plastic zone under the action of foundation load is carried out.
- The development process, morphological boundary characteristics, and foundation failure mode of the plastic zone of the sand foundation are obtained.
- The measured plastic zone is a symmetrical spindle shape with thin ends and a bulge in the middle; the sand on both sides of the bearing plate partially bulges, forming a “V” shaped shear failure zone, the foundation failure mode of sandy soil represents a typical punching shear failure mode.
- The development law of the foundation plastic zone simulated by UDEC is highly consistent with that of the foundation plastic zone based on PIV test. Therefore, it is evident that UDEC can simulate the development law of foundation plastic zone more effectively.
1. Introduction
The ultimate bearing capacity of foundation is an important research topic in soil mechanics. It is of great significance to reasonably determine the ultimate bearing capacity of foundation and ensure the safety and normal use of various projects located on the foundation. With the load increase, the foundation deformation gradually increases; in the initial stage, the foundation is in the elastic equilibrium state. When the load increases to the shear stress of each point in a small area in the foundation in a certain direction plane reaches the shear strength of the soil, the points in a small area will occur shear failure and be in the ultimate equilibrium state, the stress in the soil will be redistributed; the small shear failure zone is called the plastic zone [1-2]. When the foundation load is small, the plastic zone of the shallow foundation is the local shear failure zone; at this time, the existence of the plastic zone in the foundation will not seriously affect the instability of the foundation. However, with the increase of the load, the plastic zone will continue to expand, and finally form a continuous failure surface, the whole foundation will lose stability [3-4]. Therefore, it is very important for the design and stability of foundation to study the development law, boundary characteristics and failure mode of the plastic zone of foundation.
Many universities and research institutes at home and abroad have carried out extensive research on the bearing capacity computation of foundation and the method to determine plastic zone. Based on the secondary development of ABAQUS, the Hill’s sufficient stability condition and finite element method is applied to calculated limit bearing capacity of strip foundation and the potential instability regions of cohesive frictional soils, when the dilatancy angle is much smaller than the frictional angle, the limit bearing capacity computed by finite element method(FEM) with Hill’s sufficient stability condition is close to theoretical solution of the equivalent material, and smaller than that of regular FEM. When the dilatancy angle is close to the frictional angle, the results of FEM with Hill’s sufficient stability condition and the regular FEM are close. The FEM with Hill’s sufficient stability condition can also give the potential instability regions of soil system, which can depict the surface failure mode and field failure mode simultaneously [5]. The flexible interface and trapezoidal load are the main features of foundation under highway subgrade. By adopt finite element method associated the Mohr-Coulomb inside-tangent circle yield criterion with elastic-plastic flow rule, the bearing capacity behavior and failure modes of foundation under highway subgrade are studied and compared with those of rigid strip foundation, it is revealed that the relative ratio of central point settlement to foundation width under highway subgrade is bigger than that of foundation under rigid strip load; the failure modes of foundation under highway subgrade are mainly influenced by friction angle and elastic modules; the plastic formation mainly occurred at the middle of foundation and extended to the toe of slope; the determination method of the characteristic value of bearing capacity foundation and the value range of modified coefficient are proposed [6]. It is common that the foundations have under soft layer in engineering; however their failure mechanism depends on assumed condition and experience to a large extent. Jiang [7] carries out strain controlling numerical experiment for a foundation model with under soft layer based on limit analysis and fast Lagrangian numerical simulation method; the different ultimate bearing capacities, stress-strain curves, progressive failure pattern, and the under soft layer settlements corresponding to different loading sizes is also obtained; the safety factors respectively acquired by load increasing method and strength reduction method based on above numerical model are also compared, it is found that the variation trend of reduction coefficient and loading coefficient with load size for load increasing method and strength reduction method is the same, but the value of the former is small. Ultimate bearing capacity analysis of the strip footing is a classical topic in soil mechanics. Based on the Hellinger-Reissner mixed variational principle and finite element method, a geotechnical elasto-plastic problem involving the Mohr-Coulomb model can be casted into a second-order cone programming (SOCP) problem in the finite element framework; Wang [8] proposed a second-order cone programming based incremental finite element method (FEM-SOCP), the proposed approach can avoid the complex stress integration algorithms and the smoothing treatment of the yield surface edges and corners, which are often necessary in the traditional elasto-plastic calculations. The FEM-SOCP method is applied to the ultimate bearing capacity analysis of a shallow strip footing, with the associated and non-associated Mohr-Coulomb yield criteria considered, respectively; which show that the bearing capacity coefficients and bearing capacity obtained by the incremental loading FEM-SOCP method is consistent with the traditional FEM solution, but the yield zone attained is generally smoother compared to that obtained from conventional FEM. By using the Drucker elasto-plastic model of SAP91 nonlinear finite element analysis program, for the soft soil subgrade under the circular plank, the effects of foundation size, foundation stiffness and embedded depth of the foundation upon the settlement and plasticity development of the subgrade are analysed [9], the foundation settlement increases with increasing foundation geometrical size, and decreases with increasing foundation stiffness and embedded depth of foundation; the increasing of foundation stiffness, the increasing of foundation geometrical size, and the increasing of embedded depth of foundation all improve the bearing capacity of foundation.
Based on elastic theory and Mohr-Coulomb criterion, the governing equation of plastic zone for isotropic soils under uniform strip load with varying lateral pressure coefficient is derived [10], the range, development trend and stress evolution process of plastic zone can be determined. Compared with the method assuming that the lateral pressure coefficient is equal to 1, the plastic zone determined by governing equation method is slightly deeper; with the increase of load, the plastic zone two sides develop independently downward and the connecting trend is not obvious; When the load reaches a certain value, the depth of plastic zone will deepen rapidly, but the width of plastic zone is basically unchanged. In traditional methods for the critical load, the soil above load working plane is treated as surcharge, which does not consider influence of embedded depth on subsidiary stress distribution or the variation of coefficient of earth pressure at rest on self-weight stress. Based on the subsidiary stress formula of embedded distributed load and considering that the coefficient of earth pressure at rest varies with internal friction angle of ground material, the critical load of ground is investigated. The calculated results indicate that the critical load is overestimated if the coefficient of earth pressure at rest equals 1; meanwhile, the subsidiary stress in ground significantly reduces and the critical load increases by a large margin after the influence of load embedded depth is considered [11]. In order to consider the influence of foundation shape and depth in the calculation of foundation bearing capacity and foundation pit stability analysis of cohesive soil layer, Wang [12] proposed an approximate analytical calculation method for calculating the value of foundation bearing capacity coefficient NC, which can unify the bearing capacity of foundation with different shapes and buried depths in one formula. If the depth of plastic zone is properly adjusted, the calculated results can be very close to the experimental result and field data. Based on this method, Terzaghi's anti uplift stability analysis method can consider the influence of the insertion depth of the retaining structure; at the same time, an approximate estimation method of bearing capacity coefficient of shallow foundation is also given. Two dimensional physical model tests have been performed to investigate the response of dry granular soils to the impact of a free falling steel plate; the tests have been performed to study the mechanics of the densification of soils during dynamic compaction, which is a widely used process to improve the performance of deep soil deposits by repeated dropping of large weights onto the ground surface. High speed photography and digital image correlation techniques have enabled the deformation patterns, soil strains and strain localisations to be observed. Tests have been performed on sand with a range of densities and a sand–silt mixture, which shown that the soil deformations are comprised of a conventional bearing capacity mechanism at the surface and a series of compaction bands that propagate downwards beneath the impacting plate [13]. In order to study the generation and distribution of plastic zone of cohesive soil foundation with the change of foundation pressure and foundation width, particle image velocimetry testing technology and discrete element method are used to study the dynamic distribution characteristics of plastic zone of cohesive soil, foundation failure mode and corresponding foundation bearing capacity values, the foundation failure mode of cohesive soil represents a typical general shear failure mode, the plastic zone of the foundation on both sides below the foundation penetrates to form a symmetrically continuous failure surface, the foundation collapses to the weaker side and the whole foundation loses stability [14].
Experts and scholars increasingly focus on refining and advancing traditional ultimate bearing capacity methods. Current approaches typically use limit equilibrium and slip line methods [15-17], which fail to account for the stress-strain relationship of soil and rely on predetermined slip surface shapes, rendering them unreliable in practice. The determination of plastic zone in the subgrade is an elastic-plastic equilibrium problem, and there is no strict theoretical solution. Generally, the approximate solution is obtained by making the stress obtained according to the elastic theory in the foundation meet the yield condition, or the elastic-plastic solution-critical plastic load is derived when the soil stress in the semi-infinite subgrade reaches the limit equilibrium. Combined with practical experience and specific requirements, the allowable bearing capacity of foundation is determined by controlling the development depth of plastic zone.
In practical engineering application, there are two ways to determine the foundation bearing capacity; one is to calculate it with different theoretical methods according to the strength criterion of soil and the failure characteristics of subgrade, and the other is to combine construction experience and use field test method to determine the foundation bearing capacity. The study on foundation bearing capacity involves a wide range of factors, such as soil material category, mechanical properties, foundation size, and buried depth. To simplify the calculation, most theoretical calculation formulas have assumptions that are not in line with the actual conditions; the empirical formula is only a certain degree of mathematical transformation and lacks theoretical support; at the same time, an in-situ test is time-consuming and expensive [18]. In this paper, aiming at the shallow foundation, the particle image velocimetry (PIV) technique and discrete element method are used to study the dynamic quantitative characteristics of the plastic zone, foundation failure mode, and foundation bearing capacity; the evolution mode of mechanical mechanism in the development process of foundation plastic zone is discussed, which can be used to study the dynamic development process of plastic zone of shallow foundation, the morphological characteristics of plastic zone and the value optimization of foundation bearing capacity. The proposed method can avoid the above problems to a certain extent and provide theoretical and data support for determining the ultimate bearing capacity of the foundation.
2. Experimental analysis on plastic zone of sandy soil
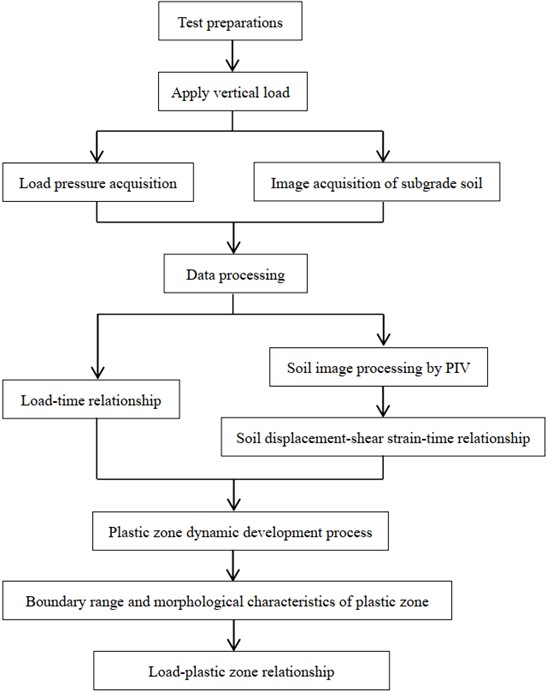
The foundation plastic zone test device is composed of open steel structure foundation model box, vertical loading system, image acquisition and processing system based on PIV technology. Through the foundation model box and vertical loading system, the loading process of the actual foundation is simulated; the image is collected by high-speed camera and is processed by particle image velocimetry technology. The displacement and shear strain fields of the foundation soil filled in the model box are analysed; therefore, the dynamic development process, boundary range, and morphological characteristics of the plastic zone of foundation soil are obtained. The test flow chart of foundation plastic zone is shown in Fig. 1.
Fig. 1The test flow chart of foundation plastic zone
2.1. Foundation model box and vertical loading system
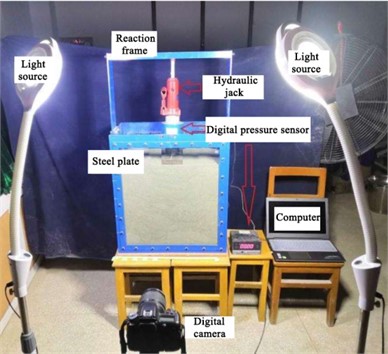
In the model tests, sandy soil was used as the filling material. Fig. 2 shows the schematic diagram of the model box, and Fig. 3 depicts the test site of the foundation plastic zone through the PIV technique. The steel foundation model box contains soil that simulates an engineering subgrade. It is a cuboid structure made of welded steel plate and channel steel, with inner dimensions of 600 mm in length, 335 mm in width, and 1055 mm in height. The front, back, and top surfaces are open, and the left and right sides are made of 12mm thick steel plates. The top surface installed an adjustable reaction frame, at the same time, the front and back sides consist of 16mm thick transparent tempered glass, making it easy to observe and take pictures of the load-deformation process of foundation. The vertical loading system includes a reaction frame, hydraulic jack, pressure sensor, pressure bearing steel plate, and a dial indicator. The hydraulic jack applies vertical pressure, and a digital display pressure sensor with a maximum range of 500 kPa is placed between the hydraulic jack and the pressure bearing steel plate to read the load of each level directly. The bearing steel plate is placed on the filling soil surface with 300 mm in length, 65 mm in width, and 20 mm in thickness. It is assumed that the foundation's embedded depth is zero.
Fig. 2The schematic diagram of model box
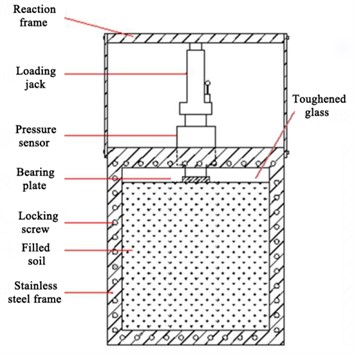
Fig. 3Test site of foundation plastic zone by PIV technique
2.2. Image acquisition and processing system
The image acquisition and processing system based on PIV technology consists of an LED shadowless light source, a high-resolution digital camera, a computer, and the advanced GOM Correlate image analysis software. The site of particle image velocimetry test system is depicted in Fig. 3, which facilitates continuous photography, image acquisition, and image analysis. With PIV technology, a real-time sequence of high-definition pictures is captured using the digital camera, and all images are digitized using GOM Correlate image analysis software. During plastic zone measurement, the PIV test system uses sandy soil as the analysis object, with automated camera shots every 0.5 seconds, and the PIV analysis software analyses the soil displacement. The system utilizes consecutive digital images to perform continuous analysis, generating a quantitative shear strain field and a visibly dynamic shear development process. It’s worth noting that the light source is positioned on both sides of the test equipment to minimize mirror reflection.
2.3. Arrangement scheme for test
The foundation plastic zone test system's main advantages and functional characteristics are as follows [14]: (1) it can realize the non-contact test of foundation pressure and deformation of soil. The digital pressure sensor is used to obtain the foundation pressure, and the displacement field and shear strain field of the foundation soil are obtained through PIV technology. Compared with the conventional geotechnical model test, it dramatically reduces the artificial disturbance for foundation soil during the test and increases the accuracy of the test results. (2) The dynamic development process of the model foundation’s shear deformation and plastic zone can be obtained intuitively. Take photos continuously during the loading process, and directly analyze and process the whole process photos through GOM software, the relationship between upper load and shear strain can be directly outputted. (3) Using the visual model box, soil displacement under load can be clearly observed through the transparent tempered glass panel.
There is still a lack of uniform standard for the testing procedure of foundation plastic zone. The main steps for performing a foundation plastic zone test are: (1) Filling sandy soil with a certain width-to-height ratio in a model box that simulates an engineering subgrade. The filling process should ensure a flat soil surface by filling in layers and compacting evenly. (2) Placing a strip rigid bearing plate on the surface of filled soil to simulate a rigid foundation. The width of the rigid bearing plate should be less than 1/3 of the width of the filled soil to meet the condition of infinite soil mass. A hydraulic jack is vertically positioned at the center of the rigid bearing plate, and a pressure sensor is placed between the hydraulic jack and the strip rigid bearing plate. The hydraulic jack is adjusted until the jack head presses against the pressure sensor. (3) Turning off indoor lights and placing an LED lamp on both sides of the transparent tempered glass surface to ensure sufficient lighting. A high-definition camera is placed in front, and the focal length and shutter speed are set to capture photos ahead of 5 seconds. The images must not show any obvious light and shadow in the visualization area of the model box. (4) Vertical loading is synchronized with a high-definition camera; gradually increasing the vertical load, the compressed and deformed soil in the box is photographed at a specific frequency using the high-definition camera. Additionally, the digital pressure sensor accurately reflects the magnitude of the vertical load and records its variations over time. (5) If a sharp drop in pressure sensor value occurs at a specific time, it indicates that the soil’s stress state has progressed from a plastic deformation stage to a plastic flow stage. At this stage, soil uplift will be around the rigid bearing plate, and the experiment can be terminated. (6) After inputting the photographs into the computer, the images are processed using GOM software to analyse the entire soil deformation process, and the soil displacement field in the box is obtained. By utilizing the relevant relation between the displacement and shear strain, a shear strain field can be computed, and the dynamic development process of plastic zone, the boundary range, and morphological characteristics of plastic zone can be observed visually; Finally, by analysing the corresponding relationship between plastic zone and vertical load, the relationship between vertical load and displacement field, shear strain can be established.
2.4. Criteria for determination of foundation plastic zone
The foundation plastic zone test system uses PIV image processing technology to obtain soil deformation data, which is different from the traditional physical contact soil deformation measurement method. PIV image processing technology compares the pixel texture changes of two successive digital images by analysing a series of photos taken continuously in real time by high-definition digital camera; the quantitative displacement field in soil and visual dynamic development process are obtained. Therefore, it is completely feasible to use the camera to record the changes of foundation through the transparent tempered glass; the displacement field of foundation soil is obtained by PIV image processing technology process the foundation image.
According to the principle of PIV image processing technology, when the two adjacent frames of the soil deformation images taken by the camera are PIV processed, the soil displacement in the time period of the two frames can be obtained. According to the mechanical principle, assuming that the Cartesian coordinate of a point is and its displacement function is a function of and , the following transformation relationship exists between the displacement of this point and the shear strain , , :
Combined with the concept of strain circle in soil mechanics, the shear strains , and at this point can be converted to the principal strains , and the maximum shear strain according to the following formula:
Then, the soil displacement field is transformed into shear strain field.
When the shear stress of each point in a certain direction plane in the arbitrary area of foundation soil reaches the shear strength, the shear failure occurs at each point in the limit equilibrium state, in which the soil stress will be redistributed and the shear failure area is called the plastic zone. The stress of each point in this region does not increase obviously, but the shear strain changes obviously; therefore, it is easy to judge whether shear failure occurs at a certain point by analysing the change of shear strain in the foundation soil with the increase of external loading.
Through PIV processing of a series of images of soil deformation taken by the camera, the displacement-time relationship of each point in the foundation soil was obtained in the corresponding time period of any two adjacent pictures during the whole foundation soil movement process. According to the transformation relationship between soil displacement field and shear strain field, combined with the load-time relationship, the displacement-time relationship of each point was transformed into the shear strain-load relationship. Based on the shear strain-load relationship, the corresponding load when the shear strain mutation occurs can be found. When the shear strain increment of a point in two adjacent periods is three times than the previous shear strain increment, it can be considered that the shear strain has a sudden change [19-20]:
where is the maximum shear strain of soil in the time period (2).
The strain region with mutation of the maximum shear strain is searched; the center coordinate of strain region with mutation in this period is fitted into a closed curve by the least square method, in which the area enclosed by the curve is the plastic zone.
2.5. Experimental results and analysis
The filling soil used in this test is Dongting Lake river sand; the percentage content of each particle component, non-uniformity coefficient, and curvature coefficient are shown in Table 1. The foundation specification defines it as poorly graded coarse sand, with a water content of 1.9 % and an internal friction angle of 35°. After filling and compacting in layers and standing for 24 hours, the measured weight is 19.4 kN/m3.
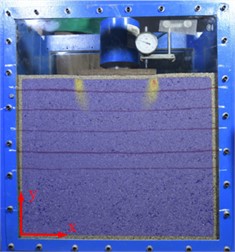
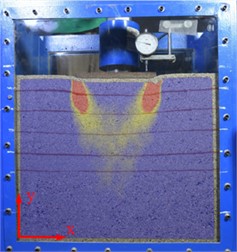
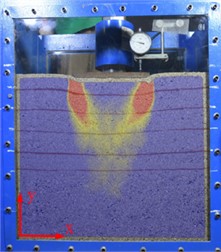
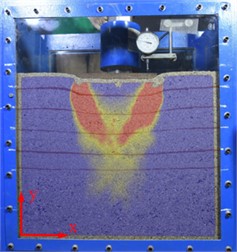
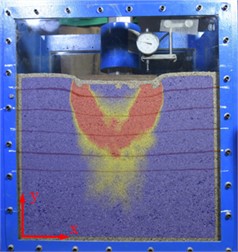
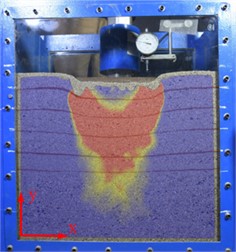
The GOM correlation image analysis software is used to process and analyze continuously photos to obtain shear strain nephogram when the foundation deformation reaches stability under different loads. Fig. 4 shows the occurrence and development law of the foundation plastic zone, the orange and red distribution area is a region with large shear strain, and the foundation sandy soil in this region has undergone shear failure; in which the local shear zone is the plastic zone.
Table 1Percentage of filling sand grain group
Particle diameter (mm) | >5 | 5-2 | 2-0.5 | 0.5-0.25 | 0.25-0.075 | < 0.075 | Non-uniformity coefficient | Curvature coefficient | Name of filling soil |
Percentage content (%) | 0.1 | 15.5 | 70.6 | 11.9 | 1.8 | 0.1 | 2.9 | 1.4 | Poorly graded coarse sand |
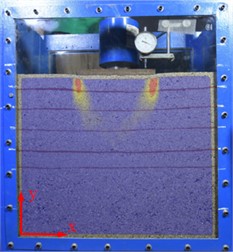
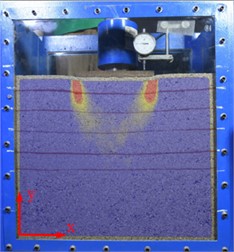
Fig. 4The measured distribution of foundation plastic zone under different loads
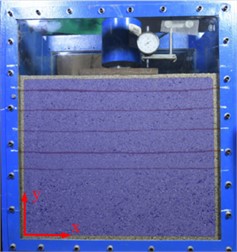
a) 30 kPa
b) 60 kPa
c) 90 kPa
d) 110 kPa
e) 120 kPa
f) 130 kPa
g) 140 kPa
h) 150 kPa
i) 160 kPa
It is different from the general shear failure mode of clay [14], from Fig. 4(a), it can be seen that the foundation sandy soil first appears compression deformation under the action of a small external load of 30 kPa. The foundation sandy soil is mainly compression deformation, the stress in the foundation is still in the elastic equilibrium stage, the shear stress at any point in the foundation is less than the shear strength, and there is no plastic zone in the foundation. In Fig. 4(b-d), it can be seen that with the increase of applied load from 60 kPa to 110 kPa, the shear failure zone (plastic zone) of the foundation starts from the edges of both sides of the bearing plate, and gradually develops downward and gets closer to the middle with the increase of the load; the plastic zone distribution range gradually increases, resembling a spindle shape. According to Fig. 4(e-g), it can be seen that with the increase of applied load from 120 kPa to140 kPa, the plastic zone of the foundation on both sides below the foundation penetrates to form a continuous failure surface, the intersection range of the plastic zone on both sides increases, at the same time, the sandy soil on both sides of foundation heaves upper; when the load reaches 140 kPa, the plastic zones on both sides begin to intersect at the bottom. It can be considered that the foundation reaches the ultimate equilibrium state and the ultimate bearing capacity can be taken as 140 kPa. In Fig. 4(h-i), when the load increases to 150 kPa, the plastic zones on both sides basically penetrate at the bottom until become one piece. The sand on both sides of the bearing plate partially bulges, forming a “V” shaped shear failure zone, and the bottom of the bearing plate forms a triangular compression zone, the foundation failure mode of sandy soil represents a typical punching shear failure mode.
3. Numerical analysis on plastic zone of sandy soil
3.1. Introduction to universal distinct element code
Different from the finite element method, which discrete the complex geometric region of the medium into elements with simple geometric shapes, a set of equations is obtained by unit integration, external load and constraint conditions, and then the approximate expression of the behavior of the medium can be obtained by solving the equations; Discrete element method is to find out the contact relationship of discrete element by analyzing the contact between the blocks, establish the physical and mechanical model of the contact, and simulate the discontinuous and discrete according to Newton’s second law.
The Universal Distinct Element Code (UDEC) is a two-dimensional numerical program based on the distinct element method for discontinuum modeling. UDEC simulates the response of discontinuous media (such as a jointed rock mass) subjected to either static or dynamic loading. The discontinuous medium is represented as an assemblage of discrete blocks. The discontinuities are treated as boundary conditions between blocks; large displacements along discontinuities and rotations of blocks are allowed [21-22]. Individual blocks behave as either rigid or deformable material. Deformable blocks are subdivided into a mesh of finite-difference elements, and each element responds according to a prescribed linear or nonlinear stress-strain law. The relative motion of the discontinuities is also governed by linear or nonlinear force-displacement relations for movement in both the normal and shear directions. UDEC has several built-in material behavior models, for both the intact blocks and the discontinuities, which permit the simulation of response representative of discontinuous geologic (or similar) materials. UDEC is based on a “Lagrangian” calculation scheme that is well-suited to model the large movements and deformations of a blocky system; therefore, it is most appropriate to use UDEC to conduct numerical simulation research on the plastic zone of sandy soil.
3.2. Model building of numerical simulation
3.2.1. Geometric dimensions and boundary states
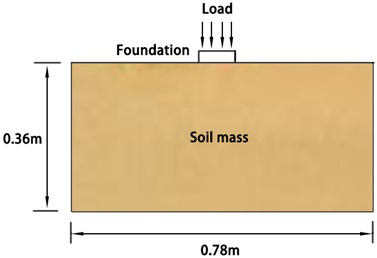
After conducting the PIV test in the plastic zone of the foundation, a numerical model was established using UDEC 6.0 software. The model dimensions of the soil analyzed in UDEC are depicted in Fig. 5, where the horizontal and vertical dimensions of the soil are set to 0.78 m and 0.36 m, respectively; while the bearing steel plate thickness and width are 0.02 m and 0.065 m, respectively. It is essential to note that the ratios of soil width and soil height to the bearing steel plate width are 12 and 5.5, respectively; which can better reduce the influence of soil boundaries on the plastic zone of the foundation.
Fig. 5Schematic diagram of numerical calculation model for foundation plastic zone
3.2.2. Constitutive relation and material parameters
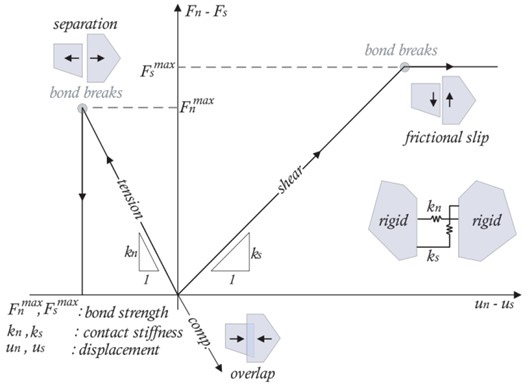
With the development of numerical simulation technology, it is possible to simulate the microstructure of soil and study its mechanical properties. From the observation of actual soil microstructure, the polygonal particle structure is close to the real situation. The response of discrete element program UDEC under static or dynamic load of discontinuous media has certain advantages; which is suitable for simulating large movement and deformation of block system. In UDEC, Thiessen Polygon Method with Voronoi model is applied to generate polygonal particle structure of soil, the contact between soil particles with polygonal random shape is embedded and self-locking; the mechanical characteristics of contact surface are determined by parameters such as normal stiffness, tangential stiffness, cohesion, tensile strength and friction angle. UDEC Voronoi assembly micro-properties and constitutive contact behavior are shown in Fig. 6.
Fig. 6UDEC Voronoi assembly micro-properties and constitutive contact behavior
The UDEC Voronoi modeling method uses the automatic generator of Voronoi mosaic mode built in UDEC to subdivide the model into polygons of random size. UDEC numerical model of foundation plastic zone is shown in Fig. 7, by using the Voronoi tessellation generator in UDEC, soil can be represented as the accumulation of randomly generated rigid bodies or deformable polygon sub-blocks combined on the contact surfaces. The particle interface failure process of randomly sized cemented polygons is very similar to the natural failure process of soil particles; therefore, the Voronoi tessellation generator can excellently reflect the failure law between soil particles.
Mohr Coulomb constitutive model is one of the most commonly used constitutive models in geotechnical engineering. Engineering practice and research results show that Mohr Coulomb constitutive model can effectively simulate the mechanical behavior of soil; thereby, Mohr Coulomb constitutive model is selected to simulate soil in the calculation. The bottom boundary of model is fully constrained; the left and right boundaries of model are only horizontally constrained. As shown in Fig. 8, Mohr Coulomb constitutive model is tensile shear yield failure.
Fig. 7UDEC numerical model of foundation plastic zone
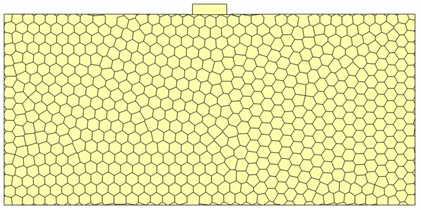
Fig. 8Mohr-Coulomb failure criterion
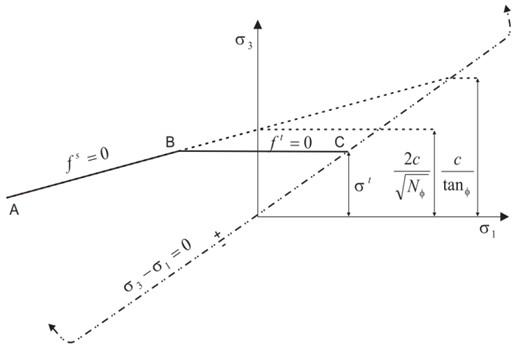
Point A to Point B in Fig. 8 is Mohr Coulomb shear failure criteria:
Point B to Point C in Fig. 8 is Mohr Coulomb tension failure criteria:
where and is the maximum principal stress and minimum principal stress, respectively. is the cohesion, is the tensile strength of soil, the expression and is:
where is the internal friction angle, is the dilation angle.
For a material with internal friction angle and the tensile strength of the material cannot exceed the value given by:
Shear failure occurs when the stress at a certain point in the soil satisfies , tensile failure occurs when the stress at a certain point in the soil satisfies ; the shear stress assumption of Mohr Coulomb constitutive model only considers the maximum principal stress and minimum principal stress of soil, ignoring the influence of second principal stress. Mohr Coulomb constitutive model can accurately reflect the physical and mechanical behavior of soil and has the characteristics of high calculation efficiency, which is widely used in geotechnical engineering.
For joints, the yield criterion of joint surface is Mohr Coulomb slip model, which is the most commonly used model in general engineering research. Coulomb friction angle and cohesion properties are often easier to obtain than other joint properties. The mechanical properties such as deformation, slip and separation between blocks are simulated by setting joint parameters.
For an intact joint (i.e., without previous slip or separation), the tensile normal force is limited to:
where is maximum tension, is the joint tensile strength, is joint contact area.
The maximum shear force allowed is given by:
where and are the joint cohesion and internal friction angle, is the normal stress.
Once the onset of tension or shear failure is identified at the contact and residual values are specified, the tensile strength and the maximum shear force allowed are set to the residual values:
where is joint residual tension strength, is joint maximum residual shear strength, is joint residual contact area.
The physical and mechanical indexes of sandy soil are shown in Table 2. The joint model parameters generated and assigned by UDEC-Voronoi are shown in Table 3.
Table 2The physical and mechanical indexes of sandy soil
Density (kg/m3) | Elastic modulus (MPa) | Poisson ratio | Cohesion (KPa) | Internal friction angle (°) | Tensile strength (KPa) |
1940 | 35 | 0.22 | 0 | 35 | 0 |
Table 3Voronoi randomly distributed joint characteristic parameters
Normal stiffness (Pa/m) | Tangential stiffness (Pa/m) | Cohesion (KPa) | Internal friction angle (°) | Tensile strength (KPa) |
9e11 | 9e11 | 0 | 35 | 0 |
3.2.3. Mesh generation and initial state of stress
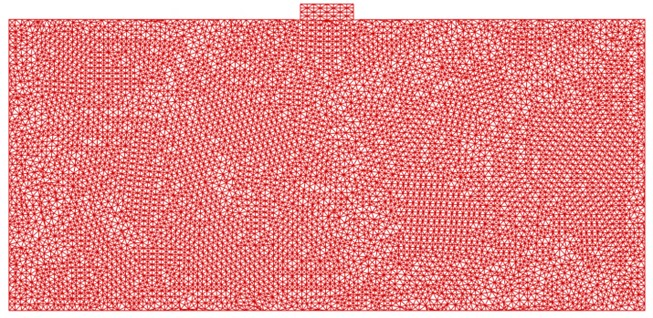
In the discrete element calculation, the size of mesh elements has a great influence on the calculation results; the smaller the size of the mesh elements, the higher the calculation accuracy, but it will occupy more memory and consume more calculation time. In UDEC simulation, the boundary conditions on both sides and the bottom of the numerical model are fixed through displacement; the left and right boundaries have no horizontal displacement, and the bottom boundary has no horizontal and vertical displacement. Additionally, the upper boundary of the model is free boundary, enabling it to undergo loading through the bearing steel plate to represent the building’s load. Since the study zone consisted of uniform soil, the internal soil structure was relatively simple, only the gravity stress of soil was considered in the model and the effect of tectonic stress was not considered. Blocks are generally cut into a large number of triangular finite difference zones. The mesh division of the calculation model for foundation plastic zone is shown in Fig. 9, a total of 20046 zones are generated in the model.
Fig. 9Mesh generation of UDEC model
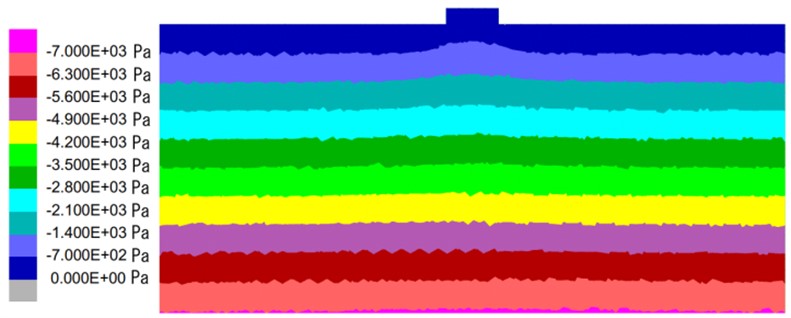
The vertical stress distribution contour map of calculation model is shown in Fig. 10. It can be seen that the vertical stress of soil increases with the increase of depth. The vertical stress at the bottom of calculation model is about 7 KPa, which is close to the vertical stress of 6.844 KPa generated by the 0.36 m calculation model under gravity. The vertical stress of numerical model is approximately equal to the unit weight of soil overlying layer, which indicating that the accuracy of UDEC model is high.
Fig. 10Contour map of the vertical stress
3.2.4. Preliminary result and distribution law of plastic zone
The vertical displacement curve of the foundation under different loads is presented in Fig. 11. It is evident that the maximum displacement values are 0.072 mm, 0.136 mm, 0.201 mm, 0.253 mm, 0.305 mm, 0.351 mm, 0.423 mm, 0.745 mm, 0.982 mm and 1.269 mm when the load is 30 kPa, 60 kPa, 90 kPa, 110 kPa, 120 kPa, 130 kPa, 140 kPa, 150 kPa, 160 kPa and 170 kPa. Moreover, a slowly increase in vertical displacement with load can be observed for loads ranging from 0 kPa to 140 kPa. When the load exceeds 140 kPa, there is a considerable increase in the foundation's vertical displacement. Therefore, it can be inferred that the ultimate bearing capacity of the foundation can be determined as 140 kPa, which is consistent with the ultimate bearing capacity obtained from the foundation’s plastic zone test depicted in Fig. 4.
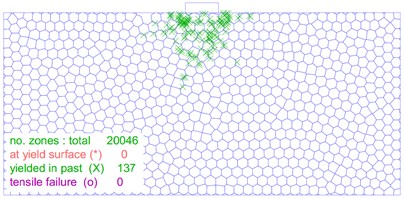
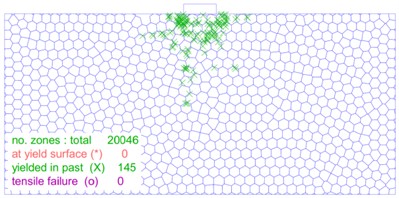
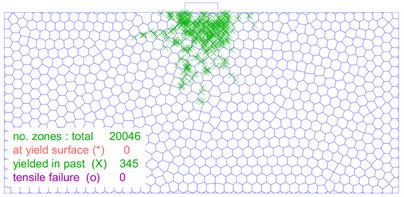
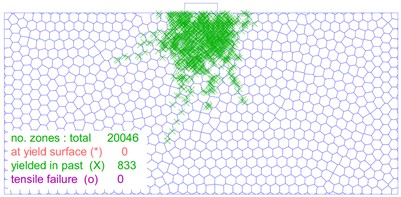
The distribution and location of the plastic zone are key index that determine the stability of a soil mass. As illustrated in Fig. 12, the size and shape of the plastic zone changes significantly as the load on the foundation increases. In Fig. 12(a), the plastic zone of the foundation is minimal at a load of 30 kPa, and the foundation experiences only slight plastic deformation. On the other hand, Fig. 12(b-f) show that as the foundation load increases to 60 kPa, 90 kPa, 110 kPa, 120 kPa and 130 kPa, respectively, the plastic zone of the foundation gradually extends on both sides of the foundation. However, no connecting area is formed. Fig. 12(g) shows that when the foundation load reaches 140 kPa, a significant number of plastic zones form below the foundation, and a connected foundation plastic zone appears. Furthermore, as shown in Fig. 12(h-j), the plastic zone of the foundation continues to expand and extend around as the load is increased from 150 kPa to 170 kPa.
The development law of the foundation plastic zone simulated by UDEC is highly consistent with that of the foundation plastic zone based on PIV test shown in Fig. 4. Therefore, it is evident that UDEC can simulate the development law of foundation plastic zone more effectively.
Fig. 11Foundation vertical displacement curve under different loads
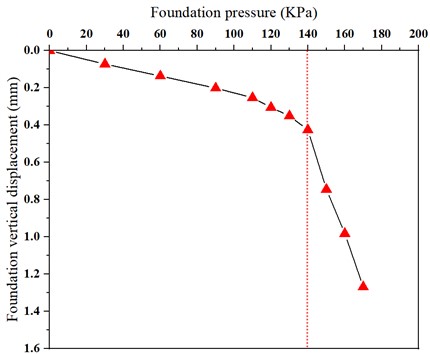
Fig. 12The distribution of the plastic zone of soil mass under different loads
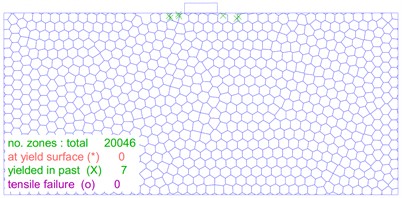
a) 30 kPa
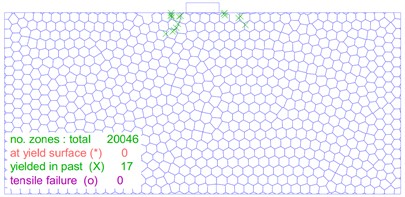
b) 60kPa
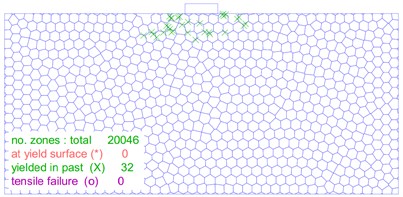
c) 90 kPa
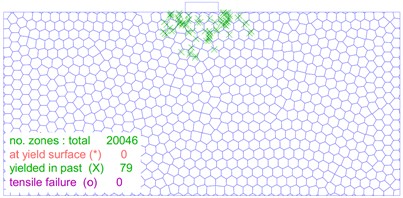
d) 110 kPa
e) 120 kPa
f) 130 kPa

g) 140 kPa

h) 150 kPa
i) 160 kPa
j) 170 kPa
3.3. Parametric study on plastic zone of sandy soil
Based on the above analysis results, it is apparent that the size and distribution of the plastic zone beneath the foundation are impacted by the foundation width and the foundation load. In order to thoroughly study how these parameters affect the plastic zone, a parametric analysis was conducted. The foundation width was varied between 0.5 m to 1.5 m in 0.25 m increments, while the foundation load was adjusted from 25 kPa to 225 kPa in 50 kPa increments. The test results of the numerical simulations depicting the foundation plastic zone are presented in Table 4. Through this parametric analysis, a comprehensive understanding of the relationship of the influence of the width of foundation and the size of foundation load on the depth of plastic zone on foundation bottom, the width of plastic zone on both sides of foundation, the ratio for the depth of plastic zone to the width of foundation, the ratio for the width of plastic zone to the width of foundation, and the ratio for the width of plastic zone to the depth of plastic zone is obtained.
3.4. Numerical simulation results and discussion
The variation of plastic zone depth and plastic zone width under different foundation loads is shown in Fig. 13 and Fig. 14, respectively. It can be seen from Fig. 13 and Fig. 14 that for the foundation width of 0.5 m, 0.75 m, 1.0 m, 1.25 m, 1.5 m, the plastic zone depth and the plastic width show the different rule with the change of foundation load, that is, when the load is 25 kPa, the plastic zone depth and the plastic width are both at small values in the range of 0.02-0.07 m and 0.05-0.19 m, respectively; the foundation sandy soil first appears compression deformation under the action of a small external load. The foundation sandy soil is mainly compression deformation, the stress in the foundation is still in the elastic equilibrium stage. For the depth of foundation plastic zone, when the foundation load increases from 25 kPa to 225 kPa, the foundation gradually reaches the ultimate equilibrium state, the plastic zone depth show a linear increase trend; as a result, the plastic zone depth range increases from 0.02-0.07 m to 1.13-3.45 m. For the width of foundation plastic zone, when the foundation load increases from 25 kPa to 75 kPa, the width of plastic zone increase significantly; Subsequently, as the foundation load gradually increases from 75 kPa to 225 kPa, the plastic zone width show a similar linear increase trend; as a result, when the foundation load increases from 25 kPa to 225 kPa, the plastic zone width range increases from 0.05-0.19 m to 0.84-2.51 m.
Table 4Numerical simulation test schedule and results for plastic zone of foundation
Test number | Width of foundation (m) | Load at the bottom of foundation (kPa) | The depth of plastic zone on foundation bottom (m) | The width of plastic zone on both sides of foundation (m) | Ratio for the depth of plastic zone to the width of foundation | Ratio for the width of plastic zone to the width of foundation | Ratio for the width of plastic zone to the depth of plastic zone |
1 | 0.5 | 25 | 0.02 | 0.05 | 0.04 | 0.10 | 2.50 |
2 | 0.5 | 75 | 0.31 | 0.61 | 0.62 | 1.22 | 1.97 |
3 | 0.5 | 125 | 0.55 | 0.72 | 1.10 | 1.44 | 1.31 |
4 | 0.5 | 175 | 0.78 | 0.79 | 1.56 | 1.58 | 1.01 |
5 | 0.5 | 225 | 1.13 | 0.84 | 2.26 | 1.68 | 0.74 |
6 | 0.75 | 25 | 0.03 | 0.08 | 0.04 | 0.11 | 2.67 |
7 | 0.75 | 75 | 0.42 | 0.88 | 0.56 | 1.17 | 2.10 |
8 | 0.75 | 125 | 0.85 | 1.09 | 1.13 | 1.45 | 1.28 |
9 | 0.75 | 175 | 1.17 | 1.18 | 1.56 | 1.57 | 1.01 |
10 | 0.75 | 225 | 1.65 | 1.27 | 2.20 | 1.69 | 0.77 |
11 | 1 | 25 | 0.04 | 0.10 | 0.04 | 0.10 | 2.50 |
12 | 1 | 75 | 0.64 | 1.25 | 0.64 | 1.25 | 1.95 |
13 | 1 | 125 | 1.09 | 1.48 | 1.09 | 1.48 | 1.36 |
14 | 1 | 175 | 1.58 | 1.57 | 1.58 | 1.57 | 0.99 |
15 | 1 | 225 | 2.17 | 1.69 | 2.17 | 1.69 | 0.78 |
16 | 1.25 | 25 | 0.05 | 0.13 | 0.04 | 0.10 | 2.60 |
17 | 1.25 | 75 | 0.76 | 1.53 | 0.61 | 1.22 | 2.01 |
18 | 1.25 | 125 | 1.34 | 1.86 | 1.07 | 1.49 | 1.39 |
19 | 1.25 | 175 | 1.96 | 1.98 | 1.57 | 1.58 | 1.01 |
20 | 1.25 | 225 | 2.78 | 2.10 | 2.22 | 1.68 | 0.76 |
21 | 1.5 | 25 | 0.07 | 0.19 | 0.05 | 0.13 | 2.71 |
22 | 1.5 | 75 | 0.94 | 1.82 | 0.63 | 1.21 | 1.94 |
23 | 1.5 | 125 | 1.66 | 2.18 | 1.11 | 1.45 | 1.31 |
24 | 1.5 | 175 | 2.45 | 2.32 | 1.63 | 1.55 | 0.95 |
25 | 1.5 | 225 | 3.45 | 2.51 | 2.30 | 1.67 | 0.73 |
Fig. 13Variation of plastic zone depth with foundation load
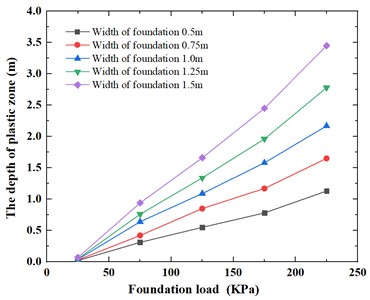
Fig. 14Variation of plastic zone width with foundation load
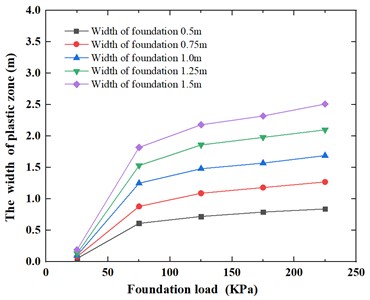
Fig. 15 and Fig. 16 illustrate the changes in plastic zone depth and plastic zone width respectively, with differing foundation widths. The data indicate that for foundation pressures of 25 kPa, 75 kPa, 125 kPa, 175 kPa, and 225 kPa, as the size of foundation increases, the area of foundation pressure on subgrade increases; a similar trend emerges whereby the plastic zone depth and the plastic width exhibit a similar linear increase as the foundation width increases from 0.5 m to 1.5 m. The depth of the plastic zone varies from 0.02-1.13 m to 0.07-3.45 m, while the width of the plastic zone varies from 0.05-0.84 m to 0.19-2.51 m.
Fig. 15Variation of plastic zone depth with foundation width
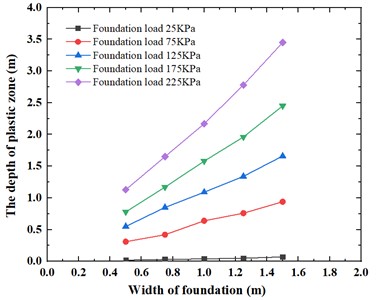
Fig. 16Variation of plastic zone width with foundation width
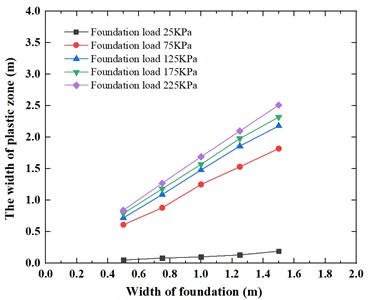
Fig. 17Variation of the ratio for depth of plastic zone to width of foundation under foundation load
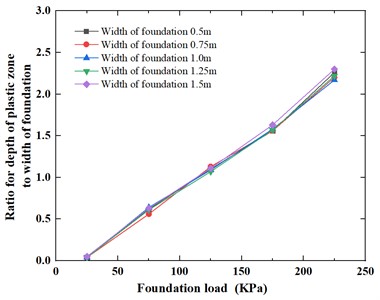
Fig. 18Variation of the ratio for width of plastic zone to width of foundation under foundation load
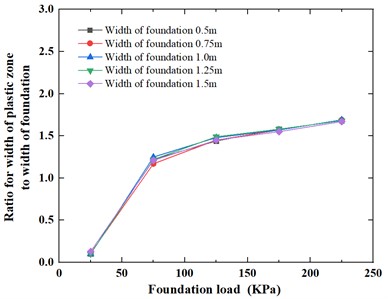
The variation of the ratio for depth of plastic zone to width of foundation and the ratio for width of plastic zone to width of foundation under different foundation loads is shown in Fig. 17 and Fig. 18, respectively.
It can be seen from Fig. 17 and Fig. 18 that for the foundation width of 0.5 m, 0.75 m, 1.0 m, 1.25 m, 1.5 m, the ratio for depth of plastic zone to width of foundation and the ratio for width of plastic zone to width of foundation show the different rule with the change of foundation load, that is, when the load is 25 kPa, the ratio for depth of plastic zone to width of foundation and the ratio for width of plastic zone to width of foundation are both small in the range of 0.04-0.05 and 0.10-0.13, respectively. For the ratio for depth of plastic zone to width of foundation, when the foundation load increases from 25 kPa to 225 kPa, the ratio for depth of plastic zone to width of foundation show a linear increase trend and has very close curves; as a result, the ratio for depth of plastic zone to width of foundation range increases from 0.04-0.05 to 2.17-2.30. For the ratio for width of plastic zone to width of foundation, when the foundation load increases from 25 kPa to 75 kPa, the ratio for width of plastic zone to width of foundation increase significantly; Subsequently, as the foundation load gradually increases from 75 kPa to 225 kPa, the ratio for width of plastic zone to width of foundation show a similar linear increase trend and also has very consistent curves; as a result, when the foundation load increases from 25 kPa to 225 kPa, the ratio for width of plastic zone to width of foundation range increases from 0.10-0.13 m to 1.67-1.69.
Fig. 19 and Fig. 20 illustrate the variations of the ratios for the depth of the plastic zone and width of the plastic zone to the width of the foundation, respectively, under different foundation widths. It can be observed from the graphs that, for foundation pressures of 25 kPa, 75 kPa, 125 kPa, 175 kPa, and 225 kPa, the values of the ratios for both depth of the plastic zone and width of the plastic zone to the foundation width remain approximately constant as the foundation width increases. As the foundation width increases from 0.5 m to 1.5 m, the ratio for depth of plastic zone to width of foundation ranges from 0.04-2.26 to 0.05-2.30, while the ratio for width of plastic zone to width of foundation ranges from 0.10-1.68 to 0.13-1.67.
Fig. 19Variation of the ratio for depth of plastic zone to width of foundation under foundation width
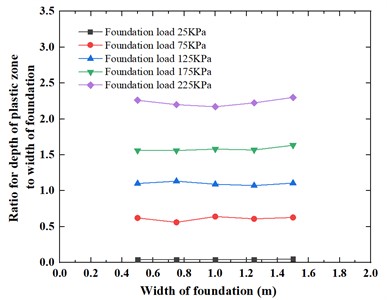
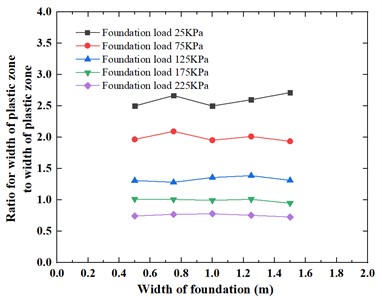
Fig. 20Variation of the ratio for width of plastic zone to width of foundation under foundation width
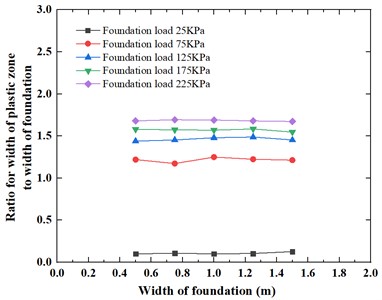
Fig. 21 and Fig. 22 depict the correlation between the width of plastic zone and depth of plastic zone with varying foundation loads and foundation widths, respectively. It is evident from that as the foundation load increases, the depth of plastic zone significantly increase, but the width of plastic zone increases slightly, the foundation failure mode of sandy soil represents a typical punching shear failure mode; therefore, the curve for the ratio of the width of plastic zone to the depth of plastic zone drops. Conversely, as the foundation width increases, the depth of plastic zone and the width of plastic zone also significantly slightly and has the same increase ratio, the curve for the ratio of the width of plastic zone to the depth of plastic zone for different foundation widths remains relatively consistent. Fig. 21 shows that for foundation widths of 0.5 m, 0.75 m, 1.0 m, 1.25 m and 1.5 m, as the foundation load increases from 25 kPa to 225 kPa, the ratio for the width of plastic zone to the depth of plastic zone changes from 2.50-2.71 to 0.73-0.78; Fig. 22 shows that for the foundation load pressure is 25 kPa, 75 kPa, 125 kPa, 175 kPa and 225 kPa, as the foundation width increases from 0.5 m to 1.5 m, the ratio for the width of plastic zone to the depth of plastic zone varies from 0.74-2.50 to 0.73-2.71.
Fig. 21Variation of the ratio for width of plastic zone to depth of plastic zone under foundation load
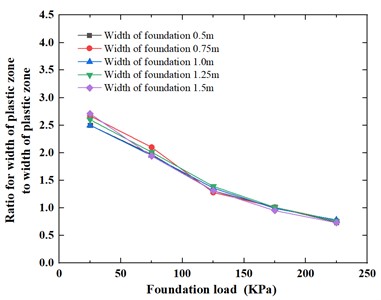
Fig. 22Variation of the ratio for width of plastic zone to depth of plastic zone under foundation width
4. Conclusions
In this study, the particle image velocimetry (PIV) technique and discrete element method are used to study the dynamic quantitative characteristics of the plastic zone, foundation failure mode and foundation bearing capacity; Based on the above PIV test in the plastic zone of foundation, a numerical calculation model is established through UDEC 6.0. The main conclusions are drawn as follows:
1) This paper introduces in detail the scheme and steps of foundation plastic zone, including foundation model box and vertical loading system, Image acquisition and processing system, arrangement scheme for test, and criteria for determination of foundation plastic zone; which can excellently meet the test requirements.
2) For analyse the plastic zone with the particle image velocimetry technique, the foundation sandy soil first appears compression deformation under the action of a small external load of 30 kPa. with the increase of applied load from 60 kPa to 110 kPa, the shear failure zone (plastic zone) of the foundation starts from the edges of both sides of the bearing plate, and gradually develops downward and gets closer to the middle with the increase of the load; the plastic zone distribution range gradually increases, resembling a spindle shape. With the increase of applied load from 120 kPa to140 kPa, the plastic zone of the foundation on both sides below the foundation penetrates to form a continuous failure surface, the intersection range of the plastic zone on both sides increases, at the same time, the sandy soil on both sides of foundation heaves upper; when the load reaches 140 kPa, the plastic zones on both sides begin to intersect at the bottom. It can be considered that the foundation reaches the ultimate equilibrium state and the ultimate bearing capacity can be taken as 140 kPa. When the load increases to 150 kPa, the plastic zones on both sides basically penetrate at the bottom until become one piece. The sand on both sides of the bearing plate partially bulges, forming a “V” shaped shear failure zone, and the bottom of the bearing plate forms a triangular compression zone, the foundation failure mode of sandy soil represents a typical punching shear failure mode.
3) For analyse the plastic zone with discrete element method, the distribution range and location of plastic zone is an important index to measure the stability of soil mass. The plastic zone of the foundation is minimal at a load of 30 kPa, and the foundation experiences only slight plastic deformation. as the foundation load increases to 60 kPa, 90 kPa, 110 kPa, 120 kPa and 130 kPa, respectively, the plastic zone of the foundation gradually extends on both sides of the foundation. However, no connecting area is formed. When the foundation load reaches 140 kPa, a significant number of plastic zones form below the foundation, and a connected foundation plastic zone appears. Furthermore, the plastic zone of the foundation continues to expand and extend around as the load is increased from 150 kPa to 170 kPa. The development law of the foundation plastic zone simulated by UDEC is highly consistent with that of the foundation plastic zone based on PIV test. Therefore, it is evident that UDEC can simulate the development law of foundation plastic zone more effectively.
4) By conducting parameterized numerical simulation test for plastic zone of foundation and analysing the results, with the changes of the foundation load and the foundation width, the variation law of (1) the depth of plastic zone on foundation bottom, (2) the width of plastic zone on both sides of foundation, (3) the ratio for the depth of plastic zone to the width of foundation, (4) the ratio for the width of plastic zone to the width of foundation and (5) the ratio for the width of plastic zone to the depth of plastic zone is obtained.
For the foundation width of 0.5 m, 0.75 m, 1.0 m, 1.25 m, 1.5 m, the plastic zone depth and the plastic width show the different rule with the change of foundation load, that is, when the load is 25 kPa, the plastic zone depth and the plastic width are both at small values; For the depth of foundation plastic zone, when the foundation load increases from 25 kPa to 225 kPa, the plastic zone depth show a linear increase trend; For the width of foundation plastic zone, when the foundation load increases from 25 kPa to 75 kPa, the width of plastic zone increase significantly; Subsequently, as the foundation load gradually increases from 75 kPa to 225 kPa, the plastic zone width show a similar linear increase trend.
For the changes in plastic zone depth and plastic zone width with differing foundation widths, the data indicate that for foundation pressures of 25 kPa, 75 kPa, 125 kPa, 175 kPa, and 225 kPa, as the size of foundation increases, the area of foundation pressure on subgrade increases; a similar trend emerges whereby the plastic zone depth and width exhibit a similar linear increase as the foundation width increases from 0.5 m to 1.5 m.
For the foundation width of 0.5 m, 0.75 m, 1.0 m, 1.25 m, 1.5 m, the ratio for depth of plastic zone to width of foundation and the ratio for width of plastic zone to width of foundation show the different rule with the change of foundation load, that is, when the load is 25 kPa, the ratio for depth of plastic zone to width of foundation and the ratio for width of plastic zone to width of foundation are both small; For the ratio for depth of plastic zone to width of foundation, when the foundation load increases from 25 kPa to 225 kPa, the ratio for depth of plastic zone to width of foundation show a linear increase trend; For the ratio for width of plastic zone to width of foundation, when the foundation load increases from 25 kPa to 75 kPa, the ratio for width of plastic zone to width of foundation increase significantly; Subsequently, as the foundation load gradually increases from 75 kPa to 225 kPa, the ratio for width of plastic zone to width of foundation show a similar linear increase trend.
For the variations of the ratios for the depth of the plastic zone and width of the plastic zone to the width of the foundation under different foundation widths, for foundation pressures of 25 kPa, 75 kPa, 125 kPa, 175 kPa, and 225 kPa, the values of the ratios for both depth of the plastic zone and width of the plastic zone to the foundation width remain approximately constant as the foundation width increases.
For the correlation between the width of plastic zone and depth of plastic zone with varying foundation loads and foundation widths, respectively; it is evident from that as the foundation load increases, the curve for the ratio of the width of plastic zone to the depth of plastic zone drops. Conversely, the curve for the ratio of the width of plastic zone to the depth of plastic zone for different foundation widths remains relatively consistent.
The research has significant guiding significance for the study of the development law of plastic zone and foundation design.
References
-
C. J. Deng, W. X. Kong, and Y. R. Zheng, “Analysis of ultimate bearing capacity of foundations by elastoplastic FEM through step loading,” (in Chinese), Rock and Soil Mechanics, Vol. 26, No. 3, pp. 500–504, 2005.
-
W. X. Kong, Y. R. Zheng, S. Y. Zhao, and B. M. Tang, “Finite element analysis for the bearing capacity of foundations and its application in bridge engineering,” (in Chinese), China Civil Engineering Journal, Vol. 38, No. 4, pp. 97–102, 2005.
-
H. Y. Wang, “Shear strength index of soils in bearing capacity analysis for existing footings near excavations,” (in Chinese), Rock and Soil Mechanics, Vol. 29, No. 8, pp. 2215–2220, 2008.
-
R. A. Galindo and M. A. Millán, “An accessible calculation method of the bearing capacity of shallow foundations on anisotropic rock masses,” Computers and Geotechnics, Vol. 131, No. 1, p. 103939, Mar. 2021, https://doi.org/10.1016/j.compgeo.2020.103939
-
L. Z. Wang and H. Shu, “Application of hill’s stability condition to bearing capacity computation of foundation with finite element method,” (in Chinese), Chinese Journal of Rock Mechanics and Engineering, Vol. 29, 2010.
-
L. L. Liu and M. S. Huang, “Bearing capacity behaviors and failure modes of foundation under highway subgrade,” (in Chinese), Chinese Journal of Underground Space and Engineering, Vol. 6, No. 1, pp. 84–89, 2010.
-
A. N. Jiang and C. A. Tang, “Limit analysis and bearing capacity safety research for foundation with under soft layer using numerical experiment,” (in Chinese), Rock and Soil Mechanics, Vol. 31, No. 3, pp. 956–960, 2010.
-
D. Y. Wang, X. Chen, Y. Z. Yu, and Y. N. Lv, “Ultimate bearing capacity analysis of shallow strip footing based on second-order cone programming optimized incremental loading finite element method,” (in Chinese), Rock and Soil Mechanics, Vol. 40, No. 12, pp. 4890–4896, 2019.
-
Y. F. Ying and W. F. Pan, “Nonlinear finite element analysis of strength and settlement of soft soil foundation under circular plank,” (in Chinese), Rock and Soil Mechanics, Vol. 23, No. 2, pp. 250–256, 2002.
-
S. Q. Li, S. F. Zhao, and Y. D. Jia, “Plastic zone induced by band-distributed-load considering change of lateral earth pressure coefficient,” (in Chinese), Journal of Liaoning Technical University, Vol. 25, No. 4, pp. 530–532, 2006.
-
Chen Leyi, Li Jingpei, and Liang Fayun, “Critical load of ground considering load embedded depth and variation of K0,” (in Chinese), Yantu Gongcheng Xuebao, Vol. 32, No. 12, pp. 1930–1934, 2010.
-
H. X. Wang, “Estimation and engineering application of bearing capacity factors (Nc) in clay strata under undrained condition,” (in Chinese), Chinese Journal of Geotechnical Engineering, Vol. 38, No. 3, pp. 546–553, 2016.
-
Y. Nazhat and D. Airey, “The kinematics of granular soils subjected to rapid impact loading,” Granular Matter, Vol. 17, No. 1, pp. 1–20, Feb. 2015, https://doi.org/10.1007/s10035-014-0544-y
-
X. H. Liu, S. Q. Jiang, Y. Q. Zeng, W. D. Hu, Y. Gong, and J. L. Chen, “The plastic zone of clay under foundation load: an experimental and numerical analysis,” International Journal of Simulation Modeling, Vol. 22, No. 1, pp. 145–156, 2023.
-
M.-X. Peng and H.-X. Peng, “The ultimate bearing capacity of shallow strip footings using slip-line method,” Soils and Foundations, Vol. 59, No. 3, pp. 601–616, Jun. 2019, https://doi.org/10.1016/j.sandf.2019.01.008
-
M. Tan and S. K. Vanapalli, “Foundation bearing capacity estimation on unsaturated soil slope under transient flow condition using slip line method,” Computers and Geotechnics, Vol. 148, No. 1, p. 104804, Aug. 2022, https://doi.org/10.1016/j.compgeo.2022.104804
-
G. Santhoshkumar and P. Ghosh, “Ultimate bearing capacity of skirted foundation on cohesionless soil using slip line theory,” Computers and Geotechnics, Vol. 123, No. 1, p. 103573, Jul. 2020, https://doi.org/10.1016/j.compgeo.2020.103573
-
W. Hu, X. Zhu, Y. Zeng, X. Liu, and C. Peng, “Active earth pressure against flexible retaining wall for finite soils under the drum deformation mode,” Scientific Reports, Vol. 12, No. 1, pp. 1–25, Jan. 2022, https://doi.org/10.1038/s41598-021-04411-4
-
R. J. Adrian and J. Westerweel, Particle Image Velocimetry. New York, America: Cambridge university press, 2011.
-
C. Y. Wang, X. P. Liu, J. Q. Zhang, and Z. H. Cao, “Experimental study on passive slip surface of limited width soil behind a rigid wall,” (in Chinese), Rock and Soil Mechanics, Vol. 42, No. 7, pp. 1839–1849, 2021.
-
S.-Q. Yang, M. Chen, H.-W. Jing, K.-F. Chen, and B. Meng, “A case study on large deformation failure mechanism of deep soft rock roadway in Xin’An coal mine, China,” Engineering Geology, Vol. 217, No. 1, pp. 89–101, Jan. 2017, https://doi.org/10.1016/j.enggeo.2016.12.012
-
“Universal Distinct Element Code, Version 6.0 User’s manual,” ITASCA Consulting Group Inc., Minneapolis, Minnesota, 2014.
About this article

The study was supported by the Natural Science Foundation of Hunan Province of China (Grant No. 2017JJ2110 and Grant No. 2022JJ40160), the Key Scientific Program of Hunan Education Department, China (Grant No. 20A228 and Grant No. 22A0472), the Postgraduate Scientific Research Innovation Project of Hunan Institute of Science and Technology (Grant No. 2022-080 and Grant No. 2022-081), the Teaching Reform Research Project of Hunan Institute of Science and Technology (Grant No. 2022A34), the Teaching Reform Research Project of Hunan Province Education Department, China (Grant No. HNJG-2022-0904), the Innovation Project of Hunan Undergraduate Students (Grant No. S202210543054 and Grant No. S202210543057) and the National Innovation and Entrepreneurship Training Program for Undergraduate Students (Grant No. 202210543054).
The datasets generated during and/or analyzed during the current study are available from the corresponding author on reasonable request.
Xiaohong Liu contributed to Conceptualization, Funding Acquisition and Data Curation of the study. Yuchen Liu and Sanxian Liu contributed significantly to Investigation and Methodology; Yongqing Zeng performed the Formal Analysis and wrote the Original Draft Preparation; Yuxin Wang and Yinghuan Zhang helped perform Review and Editing with constructive discussions.
The authors declare that they have no conflict of interest.
