Abstract
Software test cases are one of the most critical aspects of software testing in the product development process. As software products are updated several times, the same test requirement may be covered by multiple test cases, so this aspect is often redundant, yet the approximate test case set has an impact on its error detection rate. This study proposes the idea of using redundant test cases in software error location, introduces a coupling metric, analyses its program slicing and establishes a second coverage criterion in order to balance the relationship between the reduced test suite and the false detection rate the test case set. The results show that the size of test set and the number of error detection by the Ruby On Rails (ROR) method used in this study are larger than those of other commonly used reduction algorithms. The test suite has the lowest error detection loss rate, with an average of 17.96 % across the six test case sets. The highest error detection capability of individual test cases was found in the reduced test set, with a mean value of 90.63 % in the test set. The method also has the highest average reduction efficiency of 91.05 %. Compared with other simplification methods, the research method has a better balance between the size and false detection rate of the reduced test suite and the advantages of simplification.
1. Introduction
With the boom in computer technology, software testing has become an important way of ensuring software quality in the software industry, throughout the software maintenance and development cycle [1-2]. Software errors can occur in a variety of places, and the main method of locating errors based on program slicing is to analyse the program’s data flow and control flow to decompose the program to be tested and identify statements related to a subset of the program's behaviour, thus narrowing down the scope of statement checking [3]. In addition, in the actual software testing process, redundancies in test suite can occur due to product updates and therefore test suite needs to be reduced. Maintaining a balanced relationship between the impact of test case set simplification on its error detection rate is an important study today [4]. It has been shown that software programs are prone to errors at locations with high coupling and that applying coupling to test case set simplification can help improve the error detection rate of test case sets, but existing coupling measures based on program slices do not distinguish between different types of nodes in the coupled common parts [5-6]. To this end, an improved coupling metric based on program slicing in software error location is proposed, aiming to improve the efficiency of test case set reduction while better balancing its relationship with the size of the reduced test case set.
2. Related work
As software testing has received more and more attention in the development of software products, software use case testing has also received sufficient attention. As software products need to be updated and upgraded several times, the number of test cases also increases. Therefore, how to improve the parsimony rate of the test case set and achieve a balance between it and the parsimony size of the test case set has become a hot topic of research today. Tempero E. et al. proposed a coupling model that relies on the concretization of concepts as the basic unit in order to solve the problem caused by incomplete metric definitions, and experiments have shown the superiority of this model [7]. Dutta et al. proposed a mutation-based fault location technique that can identify incorrect statements by calculating the proximity to different mutants [8]. Yan et al. established a framework based on entropy, which was called Efilter and could filter untagged test cases to solve the problem of filtering untagged test cases. The efficiency of fault location was significantly improved with the use of Efilter [9]. Pradhan et al. proposed to determine the priority of test cases by defining the fault detection capability and test case dependency score, and by considering the results of run-time test case execution in order to obtain higher fault detection capability. The results showed that the method is effective and applicable [10]. Yong et al. determine the priority of test cases by defining the fault detection capability and test case dependency score, and by considering the results of run-time test case execution to reduce the execution cost of mutation-based error location techniques, a mutation execution method was proposed to prioritize implementation of variants and test suite. The experimental proved that this method can effectively reduce the execution cost of mutation tests while ensuring the error location rate [11].
Kumar L. et al. scholars put forward a framework of software fault prediction model based on cost and efficiency evaluation of testing phase, and experimental results showed that the model selected the best set of source code metrics for fault prediction [12]. Hellhake et al. researchers analysed the relationship that was between coupling measures of different components and interfaces and fault distribution in automobile system integration test. There is a positive correlation between fault propensity, the results verified that coupling is a valid indicator of fault propensity [13]. Yu et al. scholars proposed a new process metric based on evolutionary data of object-oriented programs, from the historical package defect rate and the degree of class variation, and the results verified that the method can improve the performance of evolution-oriented defect prediction [14]. Chiang et al. proposed an algorithm to improve fault detection. A four-weighted combination algorithm and a linear programming model were proposed to improve the effectiveness of fault detection. Experimental showed the fault detection rate of the software was improved, and the test set is significantly reduced [15]. Rathee et al. proposed an artificial intelligence metaheuristic-based algorithm to optimise the test sequence in order to reduce the time, effort, and redundancy used to design an optimised test sequence. The algorithm was shown to be effective [16].
The research on test case reduction techniques by scholars at home and abroad shows that there are relatively few research results on their use in software error location. As it is necessary to reduce the test suite, the change in size of the test suite will affect the error detection rate, the coupling metric can help the error detection rate, and the high coupling position can help detect software errors. The study therefore proposes a coupling metric-based test case reduction method for software error location, aiming to improve the reduction rate of the test suite, and balance the change of test suite size after reduction.
3. A Study of test case minimization methods based on coupling metrics in software error location
3.1. Coupling metrics and test case set simplification methods in software error location
Software error location is a dynamic software debugging process in which the tester usually needs to record information generated by a particular test suite during the runtime of various program entities and locate the location of software errors based on this information [17-18]. During the run of the software, the information collected may be the number of times a program entity has been executed by a test case, covered by a test case. Then, according to different program spectrum formulas, this information is used to calculate the suspiciousness of the program entity, which are ranked, and the program statements are examined one at a time in rank order until an erroneous statement is found [19]. Firstly, the program to be tested is represented by and the entity representation formula for is given in Eq. (1):
where, can be interpreted in various ways, such as a statement, method, class or a code fragment in a program. The program entity under study is the statement in the test program and represent the number of rows. The test suite of the program to be tested is shown in Eq. (2):
where, represents the number of test suite, where and represent the test case in the test case set. The result of the test case execution is shown in Eq. (3):
where, indicates the result of the first test case, where . If , the output of the test case is different from the expected output, which means that the result of the test case fails. Conversely, if indicates that the test suite was successful. The program spectrum can be expressed as a coverage matrix, as in Eq. (4):
where, represents the matrix of coverage relationships between the set of test cases and program entities, and is the matrix of . the first row of indicates that when the test case is executed, whether the statements in are executed or not is determined by the coverage vector of the test case. The column in can be represented as the execution of the statement in by the test cases. If , then the test case executes to the executable code line. If , the test case is not executed to the line of executable code during the run.
Software metrics are studied in a wide range of ways, and software metrics can be divided into structure-oriented metrics, object-oriented metrics, methods, classes and objects are modules in object-oriented programming, and software design metrics are a node of object-oriented and process-oriented metrics. Coupling is a key point in the metrics. There are five types of coupling, which represent two types of interdependent metrics, namely inherited coupling, combined coupling, aggregated coupling, associative coupling, and usage coupling [20]. The coupling information between various classes includes the number of access attributes, the number of different methods called, the number of return types, and the number of parameters passed. Based on these four parameters the dependency between the client class and the service class can be measured by integrating the four parameters into one expression using " " and using this to express the coupling between the classes and as in Eq. (5):
where, indicates the number of common variables of class used between classes and indicates the number of methods of class called by class. indicates the number of different return types that occur in and indicates the number of different parameters that occur in . The normalized estimation method for a complexity is denoted and can be expressed in its normalized form by Eq. (6):
where, represents the complexity information matrix of the test pile, and the rows and columns represent the dependencies of each class and class on class respectively. Where , . A test pile is estimated as shown in Eq. (7):
where, , , , represents the weights and . , is calculated according to Eq. (8):
where, the values of , are obtained with the opener tool SOOT, and the values of , and , are obtained with the opener tool SOOT, representing the maximum and minimum values of the attribute and method coupling matrix, respectively, of the statistical data. Respectively, constituted by the statistical data. , is calculated according to Eq. (9):
where, the values of , are obtained through the opener tool SOOT, and the values of , and , are obtained through the opener tool SOOT, representing the maximum and minimum values of the return value coupling matrix and the parameter coupling matrix constituted by the statistical data, respectively. For the weights , , , , the study proposes a calculation method as in Eq. (10):
For a given test sequence , breaking the dependent edge , the overall test stub complexity for this test sequence is calculated as in Eq. (11):
There are two main types of use case set simplification methods: direct simplification of the test suite, and analysis of each test requirement first to find out its interconnection, and then simplification of the test case based on its connection line about the test requirement [21]. The requirements-based simplification algorithm requires first delineating the relationships between the test requirements, as shown in Fig. 1.
Fig. 1Relationship division between test requirements
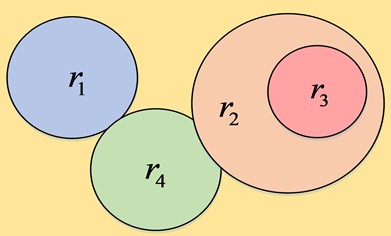
As in Fig. 1, if the test requirement contains , then any test case covering the test requirement will cover , and the test style will only test the requirement . If the test requirements and are mutually inclusive, then and are said to be equivalent test requirements and only one of them needs to be tested. If there is an overlap between the test requirements and, then the intersection of and is tested as one test requirement and and are removed. If they are independent of each other, then there is no intersection between their test cases and it is not possible to simplify the test requirements. After them have been reduced, the resulting test requirements and test cases are then reduced according to the hairpin algorithm.
3.2. Test case set simplification based on improved coupling metrics in software error location
After the test cases have been reduced, a key issue to consider is the test suite error detection rate. Numerous studies have shown that the error detection capability of the test suite is proportional to the size of the test case set, and increases with its increase [22-23]. Therefore, it is essential to ensure the error detection rate of the test suite when it is reduced. Traditional methods of computing coupling are based on information flow metrics, in contrast to slice-based metrics which are more accurate [24]. Mark Harman proposes to use slicing to compute slices for each primary variable in method , and defines to denote the flow from into a function . Its formula for calculating the coupling, as in Eq. (12):
where, reference program, indicates the number of slice statements. represents the set potential operation (cardinalit), i.e. the operation that gets the number of elements in the collection takes the number of elements in a set. definition stream represents the stream from functions to , where represents the program containing . is calculated as Eq. (13):
Define to represent the coupling between the functions and , which is calculated as in Eq. (14):
The coupling that exists between different modules in an object-oriented program is analysed by replacing with and respectively. This is shown in Eq. (15):
In Eq. (15), represents a backward slice, i.e. an utterance that is influenced by the variable . represents a forward slice, i.e. a statement that is influenced by the variable . If Eq. (15) is not , then there is a coupling between and , which leads to a formula as in Eq. (16):
where, denotes the slicing criterion, denotes the statement number of the slicing point in the program, denotes the attribute variable there, and . , the coupling between the two is calculated as shown in Eq. (17):
where, denotes the slicing criterion, denotes the method of slicing out, and represents the significant variable or set of variables for . The study analyses the backward slicing of in Eq. (17) and finds that it does not explore the different types of statement nodes in the common part of the slices in depth. For example, Fig. 2 shows the slice diagram corresponding to the method and the method in a program.
Fig. 2Slice corresponding to method function1 and function2 in the program
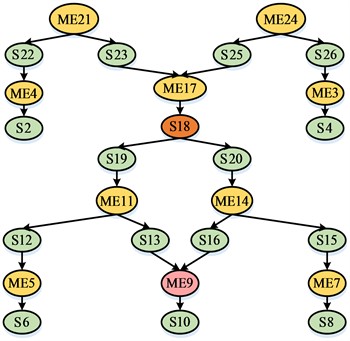
As shown in Fig. 2, it based on program slicing and found the coupling of the method pairs and in this program by first computing the slices of these two methods with the slicing criteria and respectively . The result of the slicing of the graph consists of the remaining nodes 25, 24, 26, 3, 4 with the nodes removed in Fig. 2 . The result of the slicing of the graph consists of the remaining nodes 21, 22, 23, 1, 2 after removing the nodes in that graph. The intersection of the two slicing criteria is a directed graph with statement 17 as the root, and node 18 is used as a judgment statement, with a true result executing statement 19. Conversely, statement 20 is executed. If executes statement 18 as true during execution and executes statement 18 as false during execution, the two methods affect only statements 17, 18, 9, 10, and must jointly affect statements 9, 10, 17, 18.
The coupling calculation must consider all possible intersections of slices between two modules and distinguish their nodes by the probability of being affected. In case of coupling, the intersection of slices must be represented separately for nodes that will be executed and for nodes that are likely to be executed. Finding the set of nodes that must be executed when the method is coupled with the method , the remaining node in represents the node that has a certain probability of being affected, thus transforming Eq. (17) into Eq. (18):
In Eq. (18), represents the average probability that the remaining nodes in the slice graph intersection are affected. The probability of each point in being affected is 0.5. To simplify the process of calculating the metric value, the study takes to be 0.5. The improved coupling calculation is more rigorous and better represents the degree of coupling between modules, as in Eq. (19):
In order to the relationship between the size of the test suite and its error detection rate, it has been proposed to add redundant test cases to the test suite [15]. The GE reduction algorithm was chosen to reduce the test suite through the first coverage standard, and then retain the second coverage standard for the generated redundant test cases. This reduced scale of test suite and ensured its error detection capability, as shown in Fig. 3.
Fig. 3Algorithm flow of adding redundant test case set
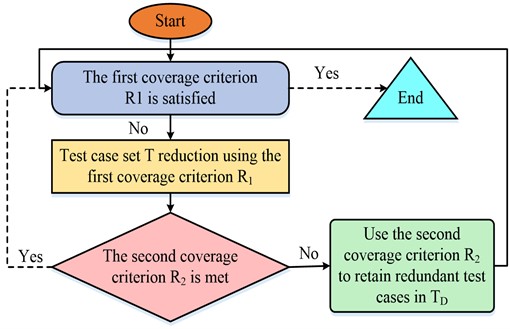
It can be seen from Fig. 3, first, select the basic test case from the test suite to add to the reduced set , and to remove the test requirements met by these test cases from . If the test case can meet the test requirement that has been removed, it will be added to the redundant test cases to be retained at . The second step is to select the redundant test cases from using the second coverage criterion and add them to . The test case from that meets the highest number of test requirements from the second coverage criterion is selected and added to . Then delete the test conditions met by . Until the remaining test suite at do not meet the test requirements for the new second coverage criterion, empty . Finally go to the next step and use the greedy algorithm [25-26] on the test case set . If the first sub-criterion is not fully covered, find the test case that can meet the highest number of remaining test conditions at and add it to , while removing the test conditions from the first coverage criterion covered by . If all the requirements met by an are removed, it is added to . Enter the second step if the second coverage criterion is not fully covered [27-28]. Conversely, the last step continues until the test requirements in the first coverage criterion are completely covered.
4. Analysis of experimental results of coupling metric-based test case simplification in software error location
The experiments start with the implementation of a program slicing and coupling metric tool, with the program slicing part starting with the analysis of the source program lexicography and syntax. The experiments use the open source compiler generation tool ANTLR, which is able to automatically generate a compiler based on a given grammar. The grammar of the auxiliary code segment was then embedded in ANTLR to construct a lexical and syntactic analyser for the text. In this experiment 700 test cases satisfying branch coverage were constructed and the satisfaction relationship between each test case and the score coverage was maintained during the construction process. This group of test cases is called test case library, which has a high level of redundancy. A group of six test cases is then constructed from the test case library , , , , , . During construction, the test cases from the library are then selected from and added to . If not all of the scores covered by are met, then select test cases from the library that meet other conditions and added to until all requirements are met. This experiment compared the coupling metric-based test case set reduction algorithm with four other reduction algorithms, as shown in Fig. 4.
Fig. 4Experimental process of reduction algorithm comparison
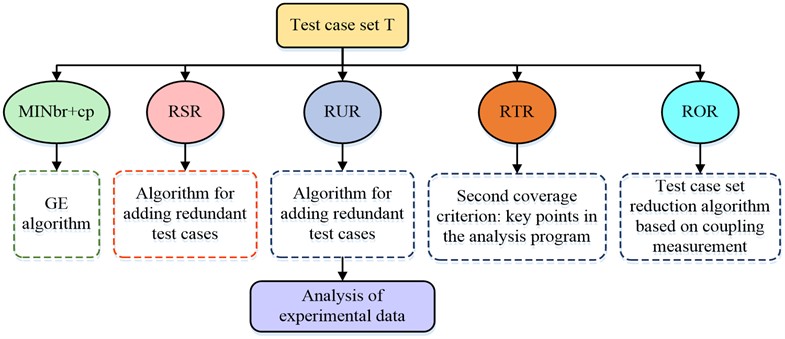
As shown in Fig. 4, fractional coverage was used as the first coverage criterion. And use each of the five reduction algorithms to reduce each group of test cases The GE algorithm can reduce the test suite, RSR was reduced using the add redundant test cases algorithm, and the second coverage criterion was unstated coverage RUR. The algorithm for adding redundant test cases was used, the second coverage criterion was all-useful coverage, and the ATAC tool was used. RTR the second coverage criterion was not analysed for critical points in the program. A coupling metric based test case set simplification algorithm was able to simplify the algorithm for adding test cases, and the second coverage criterion was not used to analyse the coupling paths obtained by the algorithms with higher coupling in this study. Experiments were conducted on the definition of error points in the program, and various methods were used to simplify to obtain the test suite and to record the number of test cases and the number of tests contained in . The raw data for each test case set is shown in Fig. 5.
Fig. 5Raw data of each test case set
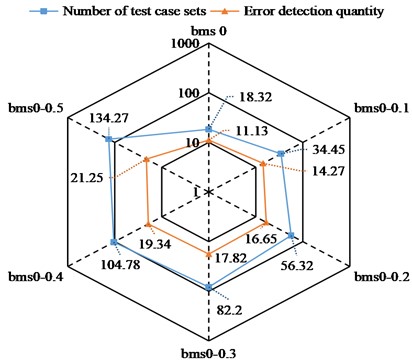
According to Fig. 5, there are six test case sets and each corresponds to its own number of use case sets and number of error checks, the number of which increases with each use case set. The number of test cases ranged from 18.32-134.27 and the number of error checks ranged from 11.13-21.25. The experiments were conducted eight times for each set of using the five methods, and the average of the experiments was taken. Fig. 6 shows scale of test case set and number of errors detected after reduction of five methods.
Fig. 6Scale of test suite and number of error detection after reduction by five methods
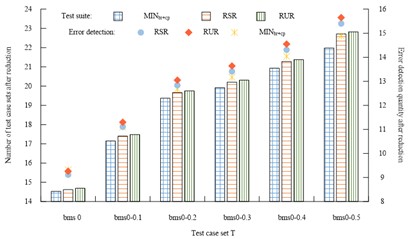
a) Number of test cases and number of error detections after reduction of MINIbr+cp, RUR, RSP
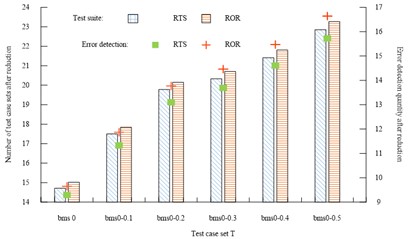
b) Number of test cases and number of error detections after reduction of RTS, ROR
As shown in Fig. 6, the ROR simplification algorithm used in this study had more test case sets in all six test case sets than the other four simplification methods, with the number ranging from 15.02 to 23.27, and the average number in the six test sets was 19.8. The average number of test suite in the six test case sets for the MINbr+cp, (Rank-sum ratio) RSR, (Rational Unified Process) RUR, and (Real Time Operating System) RTS simplification algorithms were 18.98, 19.31, 19.405, and 19.43, respectively. Similarly, the studied parsimony algorithm has more error checks in all six test case sets than the other four parsimony methods and has the highest average number of error checks in the six test sets at 13.64. The average number of error checks in the six test case sets for the MINbr+cp, RSR, RUR, and RTS parsimony algorithms is 12.52. The average error detection values for the six test case sets of MIN, RSR, RUR, and RTS were 12.52, 12.69, 12.90, and 12.95, respectively. The reduction rate of test suite after the five methods are reduced is shown in Fig. 7.
Fig. 7Reduction rate of test case set after reduction by five methods
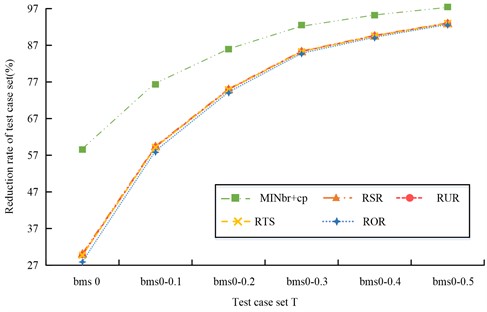
As shown in Fig. 7, among the five simplification methods, MINbr+cp has the highest test case set simplification rate in each test case set, up to 92.98. Its average simplification rate across the six test case sets is about 85.225. The average of the six test case set simplification rates for the RSR, RUR, RTS, and ROR simplification algorithms are 72.16, 71.98, 71.93, and 71.185, respectively. As the redundancy in the positive initial use case set increases with the scale of test suite, the simplification algorithm increases its simplification rate. Since the simplification does not use the method of adding redundant test cases, the reduced redundancy is the smallest and the corresponding simplification rate is the highest. As shown in Table 1, it is the result of the error detection loss rate of the test suite reduced by five methods.
Table 1Shows the result of error detection loss rate of test suite after reduction by one method
Test case set T | MINbr+cp | RSR | RUR | RTS | ROR |
Bms 0 | 16.28 % | 18.14 % | 16.81 % | 16.52 % | 13.28 % |
Bms 0-0.1 | 22.30 % | 22.10 % | 20.82 % | 20.56 % | 16.76 % |
Bms 0-0.2 | 23.96 % | 22.87 % | 21.63 % | 21.32 % | 17.25 % |
Bms 0-0.3 | 26.11 % | 24.74 % | 23.47 % | 23.15 % | 18.87 % |
Bms 0-0.4 | 27.42 % | 26.01 % | 24.78 % | 24.48 % | 20.01 % |
Bms 0-0.5 | 29.98 % | 24.53 % | 26.32 % | 26.02 % | 21.63 % |
As shown in Table 1, the error loss rate of the five approximate methods increases with the scale of test suite, while the ROR approximate method in this study has the smallest error detection loss rate compared to the other four methods in each set of use case test sets, with an average error detection loss rate of 17.96 % across the six test sets. In contrast, the mean values for the number of test cases in the six test sets for the MINbr+cp, RSR, RUR, and RTS approximate algorithms were approximately 24.341 %, 23.065 %, 22.305 %, and 22.008 %, respectively. This indicates that the approximate simplification of the studied RORs was the most effective in detecting error loss. Based on the ROR reduction method in software error location, the number of errors detected after reduction is statistically analyzed for individual test case set samples extracted in the experiment. The error range of the algorithm is further observed and studied from the whole data. The relationship between the error detection rate of the ROR reduction algorithm and the number of reduced test cases is shown in Fig. 8.
From Fig. 8, when the number of test cases set is 9.98 after reduction by the research method, the error detection rate of the research model in software error location can reach 92.3 %. With the increase of test case set, the detection rate of research model decreases accordingly. Moreover, when the test case set is less than 9.98, the error detection rate of the research model also decreases. Thus, in order to achieve the best error detection effect of the research model, the number of test cases should be within the range of 8.97-13.26. As Fig. 9 shows the individual use case error detection capability of the test case sets after the five methods were approximately simplified.
Fig. 8Error detection range of the reduction algorithm based on ROR
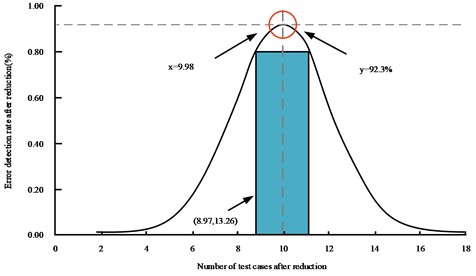
Fig. 9Error detection capability of single test case set after five methods reduction
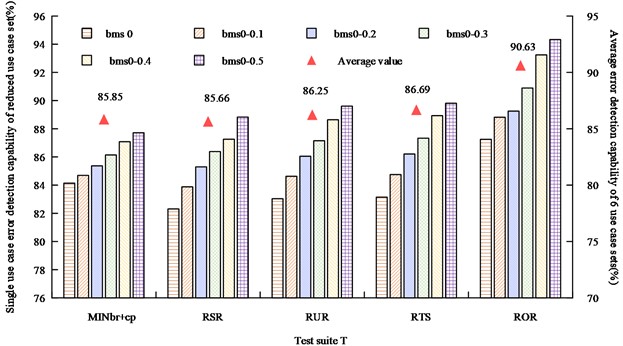
As can be seen in Fig. 9, the ROR reduction method proposed in the study has a higher error detection capability for individual use cases than the other four methods for the reduced test set, and has a mean capability of 90.63 % across the six test sets, which is on average 4.97 %-3.94 % higher than the error detection capability of the other methods. Fig. 10 shows the results of the overall efficiency comparison of the five methods of simplifying case test suite.
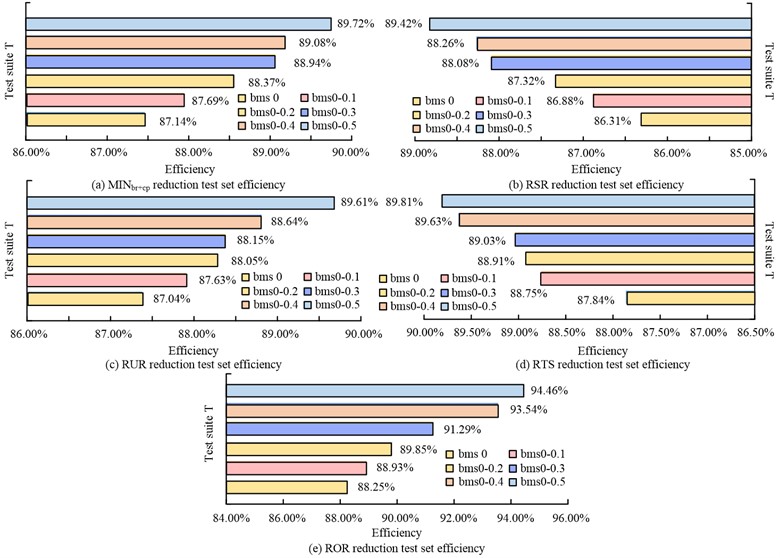
As can be seen from Fig. 10, the combined simplification efficiency of the six test case sets of the ROR simplification method studied ranged from 88.25 % to 94.46 %, with an average simplification efficiency of 91.05 %. Its simplification efficiency is better than other methods. which are all less than 90 %. The results show that the scale of the reduced use case set of the ROR reduction algorithm is higher than the other methods. The false detection rate of this method is smaller, and the reduction capability and efficiency are higher than the other four methods. It also provides a better balance between the size and error detection rate of the reduced test suite. For any test case set, the study method adds test cases with error detection capability, and the number of error detection cases after simplification is large, and the error detection capability of a single test case set is high. When the size of the test case set is small, the ROR introduces a coupling metric, so its individual use case error detection capability is higher. This shows the validity and superiority of the study of coupling metric based test case set simplification.
Fig. 10Comprehensive efficiency results of five methods to reduce test set of use cases
5. Conclusions
Software test cases are one of the most critical aspects of software testing, which are often redundant, yet the approximate test case set has an impact on its error detection rate. This study proposes the idea of redundant test cases in software error location and introduces a coupling metric for test suite reduction to balance the relationship between the reduced test suite and the false detection rate of the test case set. The experiments have proved that the size and number of false detection of the reduced test suite using the research method ROR are larger than those of the other four reduction methods. Since the reduction method uses the addition of redundant test cases, the reduced redundancy of the research method is larger and the corresponding reduction rate is the smallest among the four methods. However, its test suite error detection loss rate is also the smallest, with an average of 17.96 % across the six test case sets. And the study method has the highest error detection capability for individual test cases in the reduced test set, with a mean value of 90.63 % across the six test sets. The combined reduction efficiency of the method in the six test sets ranged from 88.25 % to 94.46 %, with an average reduction efficiency of 91.05 %, which is higher than other methods. The proposed test case set reduction based on coupling metric in software error location is effective and efficient, and has a good balance between the size and false detection rate of the reduced test suite. This study focuses on the analysis of the innovative and improved method of software coupling measurement in software error location, and verifies the effectiveness and superiority of the improved method through experiments. Secondly, the important research and application point of this paper is to introduce the coupling measure based on program slicing into the reduction of test case set. This method can achieve a better balance between the size of test case set and the error detection rate after reduction, so as to improve the efficiency of software testing in product development. Although this study has achieved good results, there is still room for improvement. Due to the limitation of the length of the paper, only C++ programming language is considered in this study, and the analysis of other languages is missing. In future studies, the differences between algorithms and frameworks applied in other programming languages will be further discussed, and a method to eliminate the differences will be designed.
References
-
V. Alizadeh, M. Kessentini, and M. Mkaouer, “An interactive and dynamic search-based approach to software refactoring recommendations,” IEEE Transactions on Software Engineering, Vol. 46, No. 9, pp. 932–961, 2018.
-
A. Lekova, P. Tsvetkova, T. Tanev, P. Mitrouchev, and S. Kostova, “Making humanoid robots teaching assistants by using natural language processing (NLP) cloud-based services,” Journal of Mechatronics and Artificial Intelligence in Engineering, Vol. 3, No. 1, pp. 30–39, Jun. 2022, https://doi.org/10.21595/jmai.2022.22720
-
Haoxiang Shi, Wu Liu, Jingyu Liu, J. Ai, and Chunhui Yang, “A software defect location method based on static analysis results,” 9th International Conference on Dependable Systems and Their Applications (DSA), Vol. 14, pp. 876–886, 2022.
-
O. Banias, “Test case selection-prioritization approach based on memoization dynamic programming algorithm,” Information and Software Technology, Vol. 115, pp. 119–130, Nov. 2019, https://doi.org/10.1016/j.infsof.2019.06.001
-
M. Iyyappan et al., “A component selection framework of cohesion and coupling metrics,” Computer Systems Science and Engineering, Vol. 44, No. 1, pp. 351–365, 2022.
-
S. Kalantari, H. Motameni, E. Akbari, and M. Rabbani, “Optimal components selection based on fuzzy-intra coupling density for component-based software systems under build-or-buy scheme,” Complex and Intelligent Systems, Vol. 7, No. 6, pp. 3111–3134, Dec. 2021, https://doi.org/10.1007/s40747-021-00449-z
-
E. Tempero and P. Ralph, “A framework for defining coupling metrics,” Science of Computer Programming, Vol. 166, pp. 214–230, Nov. 2018, https://doi.org/10.1016/j.scico.2018.02.004
-
A. Dutta, A. Jha, and R. Mall, “MuSim: mutation-based fault localization using test case proximity,” International Journal of Software Engineering and Knowledge Engineering, Vol. 31, No. 5, pp. 725–744, 2021.
-
Xiaobo Yan, B. Liu, Shihai Wang, Dong An, Feng Zhu, and Yelin Yang, “Efilter: an effective fault localization based on information entropy with unlabelled test cases,” Information and Software Technology, Vol. 134, No. 8, pp. 11–19, 2021.
-
D. Pradhan, S. Wang, S. Ali, T. Yue, and M. Liaaen, “Employing rule mining and multi-objective search for dynamic test case prioritization,” Journal of Systems and Software, Vol. 153, pp. 86–104, Jul. 2019, https://doi.org/10.1016/j.jss.2019.03.064
-
Y. Liu, Z. Li, R. Zhao, and P. Gong, “An optimal mutation execution strategy for cost reduction of mutation-based fault localization,” Information Sciences, Vol. 422, pp. 572–596, Jan. 2018, https://doi.org/10.1016/j.ins.2017.09.006
-
L. Kumar, A. Tirkey, and S.-K. Rath, “An effective fault prediction model developed using an extreme learning machine with various kernel methods,” Frontiers of Information Technology and Electronic Engineering, Vol. 19, No. 7, pp. 864–888, Jul. 2018, https://doi.org/10.1631/fitee.1601501
-
D. Hellhake, J. Bogner, T. Schmid, and S. Wagner, “Towards using coupling measures to guide black-box integration testing in component-based systems,” Software Testing, Vol. 32, No. 4, pp. 13–20, 2022.
-
Q. Yu, S. Jiang, J. Qian, L. Bo, L. Jiang, and G. Zhang, “Process metrics for software defect prediction in object‐oriented programs,” IET Software, Vol. 14, No. 3, pp. 283–292, Jun. 2020, https://doi.org/10.1049/iet-sen.2018.5439
-
C. L. Chiang, C. Y. Huang, C. Y. Chiu, K. W. Chen, and C. H. Lee, “Analysis and assessment of weighted combinatorial criterion for test suite reduction,” Quality and Reliability Engineering International, Vol. 38, No. 1, pp. 358–388, 2021.
-
N. Rathee and R. S. Chhillar, “Optimization of favourable test path sequences using bio-inspired natural river system algorithm,” Journal of Information Technology Research, Vol. 14, No. 2, pp. 85–105, Apr. 2021, https://doi.org/10.4018/jitr.2021040105
-
C. G. Burande, O. K. Kulkarni, S. Jawade, and G. M. Kakandikar, “Process parameters optimization by bat inspired algorithm of CNC turning on EN8 steel for prediction of surface roughness,” Journal of Mechatronics and Artificial Intelligence in Engineering, Vol. 2, No. 2, pp. 73–85, Dec. 2021, https://doi.org/10.21595/jmai.2021.22148
-
A. Alam Khan and Qamar-Ul-Arfeen, “Linux Kali for social media user location: a target-oriented social media software vulnerability detection,” Journal of Cyber Security, Vol. 3, No. 4, pp. 201–205, 2021, https://doi.org/10.32604/jcs.2021.024614
-
B. Cheng and M. Melgaard, “Poisson wave trace formula for Dirac resonances at spectrum edges and applications,” Asian Journal of Mathematics, Vol. 25, No. 2, pp. 243–276, 2021, https://doi.org/10.4310/ajm.2021.v25.n2.a5
-
S. Jiang, M. Zhang, Y. Zhang, R. Wang, Q. Yu, and J. W. Keung, “An integration test order strategy to consider control coupling,” arXiv, Vol. 47, No. 7, p. arXiv:2103.09471, 2021, https://doi.org/10.48550/arxiv.2103.09471
-
Y. Mu, X. Gao, and M. Shen, “Research of reuse technology of test case based on function calling path,” Chinese Journal of Electronics, Vol. 27, No. 4, pp. 768–775, Jul. 2018, https://doi.org/10.1049/cje.2018.04.012
-
L. Saganowski, “Effective test case minimization and fault detection capability using multiple coverage technique,” Advances in Computational Sciences and Technology, Vol. 11, No. 10, pp. 873–886, 2018.
-
T. S. Stelljes, D. Poppinga, J. Kretschmer, L. Brodbek, H. Looe, and B. Poppe, “Experimental determination of the "collimator monitoring fill factor" and its relation to the error detection capabilities of various 2D rrays,” Medical Physics, Vol. 46, No. 4, pp. 1863–1873, 2019.
-
D.-L. Miholca, G. Czibula, and V. Tomescu, “COMET: A conceptual coupling based metrics suite for software defect prediction,” Procedia Computer Science, Vol. 176, pp. 31–40, 2020, https://doi.org/10.1016/j.procs.2020.08.004
-
R. He, W. Ma, X. Ma, and Y. Liu, “Modeling and optimizing for operation of CO2-EOR project based on machine learning methods and greedy algorithm,” Energy Reports, Vol. 7, pp. 3664–3677, Nov. 2021, https://doi.org/10.1016/j.egyr.2021.05.067
-
S. Suzuki, M. Fujiwara, Y. Makino, and H. Shinoda, “Radiation pressure field reconstruction for ultrasound midair haptics by greedy algorithm with brute-force search,” IEEE Transactions on Haptics, Vol. 14, No. 4, pp. 914–921, Oct. 2021, https://doi.org/10.1109/toh.2021.3076489
-
N. Rezazadeh, M.-R. Ashory, and S. Fallahy, “Identification of shallow cracks in rotating systems by utilizing convolutional neural networks and persistence spectrum under constant speed condition,” Journal of Mechanical Engineering, Automation and Control Systems, Vol. 2, No. 2, pp. 135–147, Dec. 2021, https://doi.org/10.21595/jmeacs.2021.22221
-
N. Rezazadeh, M.-R. Ashory, and S. Fallahy, “Classification of a cracked-rotor system during start-up using Deep learning based on convolutional neural networks,” Maintenance, Reliability and Condition Monitoring, Vol. 1, No. 2, pp. 26–36, Dec. 2021, https://doi.org/10.21595/marc.2021.22030
About this article

The research is supported by: Science and Technology Research Project of Education Department of Jiangxi Province in 2020 (No. GJJ204203).
The datasets generated during and/or analyzed during the current study are available from the corresponding author on reasonable request.
The authors declare that they have no conflict of interest.
