Abstract
The surface with a certain microstructure and morphology has a better wear resistance and allows reduction in the drag and noise. In this work, we supplemented an ultrasonic vibration and thereby proposed the underlying mechanism in the formation of the surface microstructure of ultrasonic vibration face milling using the kinematics model. Furthermore, we established the theoretical model of the machined surface microstructure. The cutting test of TC4 titanium alloy was conducted. The rationality of the theoretical model verified by adjusting the corresponding cutting parameters and the ultrasonic parameters. In addition, the friction and wear tests of the machined surface were also performed. The results showed that the amplitude had a significant influence on the micro-morphology, roughness, and friction coefficient of the ultrasonic vibration-assisted face milling. With the increase in the amplitude, the surface roughness and friction coefficient showed an initial decreasing trend with a subsequent increase. The surface roughness declined with the increase in the cutting speed, while had little effect on the surface friction coefficient of the material.
Highlights
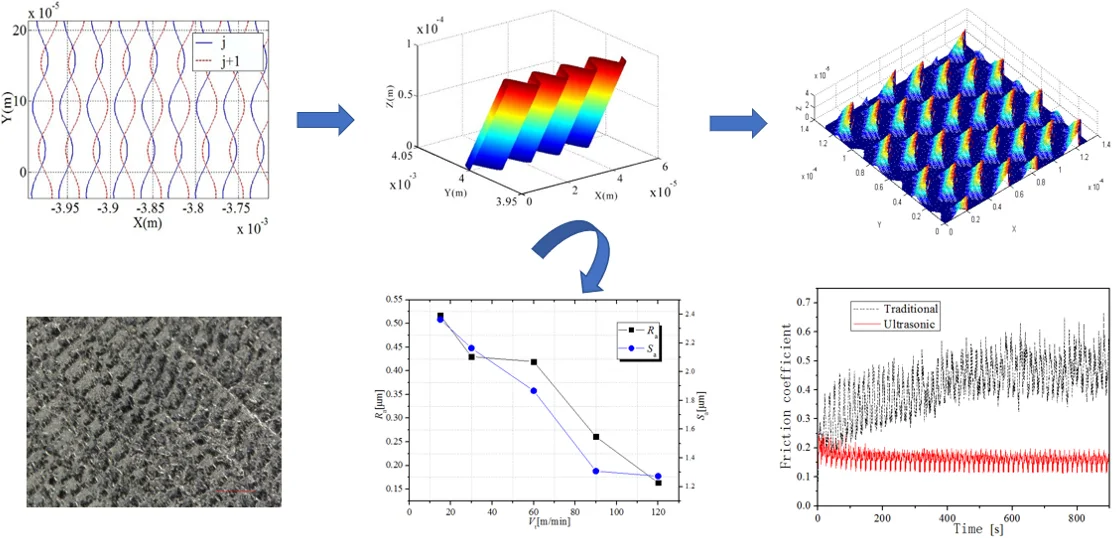
- By discretizing the cutting edge and workpiece and using MATLAB to theoretically model the microstructure of the machined surface, it was found that the surface of vibration face milling in the feed direction created a regular scaly microstructure.
- The obvious irregular structures such as tooth marks, adhesions, and pits on the machined surface using normal milling. However, in the ultrasonic vibration face milling in the feed direction, the machined surface generated uniform vibrational microstructure to overlap the normal marks, and obtained relatively regular scaly microstructure.
- The experimental results of friction and wear tests indicated that the tribological characteristics of the face milling were improved by the ultrasonic vibration in the feed direction.
1. Introduction
Titanium alloy and ceramic materials are widely used in the advanced manufacturing fields such as the aerospace and military industries due to their hardness, specific strength, and high temperature and corrosion resistance [1, 2]. However, due to the high strength, hardness and poor thermal conductivity, these materials have poor cutting performance and generally difficult to work [3]. The traditional processing faces a difficulty to meet the increasing precision and requirements for the surface processing. Ultrasonic vibration assisted cutting has been extensively studied in the recent years owing to its wide adaptability to materials, good cutting effect, high cutting efficiency, and long cutting life. The ultrasonic vibration technology is able to generate a compressive stress on the surface of the part via ultrasonic vibration during the machining process, which effectively controls the surface microstructure of the part, improves the surface microstructure and prolongs the cutter life [4-6]. Thus, it is an effective way to control the surface microstructure of the part by introducing an ultrasonic vibration into the cutting process for materials which are difficult to work [7, 8]. The surface texture has a great influence on the surface property of the materials. A rational control of the surface microstructure is an important way to improve the friction and wear properties of the parts [9-10].
Schbert et al. [11] carried out the ultrasonic vibration assisted turning experiments on AA2124 materials, and investigated the microstructure characteristics of the machined surface as the vibration was added in the axial, radial, and feed directions. Borner et al. [12] used MATLAB to develop a simulation of the ultrasonic assisted milling surface for design and modeling of the surface structure that predicted the microstructure characteristics by relevant processing parameters, and the predicted values were highly consistent with those of the machined surface. Sajjady et al. [13] analyzed the surface texture and morphology under the ultrasonic vibration assisted turning and proposed an algorithm for simulating the surface texture during the ultrasonic vibration assisted turning process. Luan et al. [14] comparatively studied the 7075-T6 using a one-direction ultrasonic vibration turning and ordinary turning. Ultrasonic vibration led to the decrease in the surface roughness due to the repeated ironing effect on the machined surface, and a more precise surface microstructure was obtained. Li et al. [15] proposed a discrete algorithm based on the abrasive grain cutting path and minimum height value envelope curved surface extraction method during the ultrasonic grinding process and established a three-dimensional shape model of the ultrasonic grinding surface, which effectively predicted the surface topography obtained during the ultrasonic grinding. Wang et al. [16] proposed a surface formation model of the ultrasonic vibration spiral grinding, and simulated the three-dimensional surface microstructure of the traditional grinding and ultrasonic vibration grinding. The influence of the surface formation process on the ultrasonic vibration was obtained. Chang et al. [17] experimentally studied the ultrasonic vibration of the friction coefficient.
Currently, there is an extensive research carried out on the ultrasonic turning and ultrasonic grinding. In contrast, the research on ultrasonic milling started late, and a few theoretical studies on the machined surface of ultrasonic vibration face milling have been reported. The present work was aimed at the theoretical analysis of the ultrasonic vibration-assisted face milling surface microstructure in feed-direction and thereby establishing a surface model. The cutting test, and friction and wear test were carried out on the TC4 titanium alloy, in order to study the control of the surface microstructure in realization of the optimized tribological properties of the machined surface under the processing conditions.
2. Kinematics analysis of ultrasonic assisted milling
The tool tip trajectory of the end mill in normal face milling showed a regular cycloid. The trajectory equations are shown in Eq. (1):
where, is the feed speed and is the radius of end mill, is the rotation angular velocity of the tool, and t is the time.
Due to imposing a high-frequency vibration on the workpiece or tool in the ultrasonic vibration face milling, the movement relationship of the workpiece relevant to the tool tip is more complicated. The tool tip trajectory no longer maintained the traditional cycloid shape, but showed the different movement characteristics with the variations in the machining parameters. In addition, due to the influence of ultrasonic vibration, the formation mechanism of cutting thickness during ultrasonic face milling essentially changed. The difference between the above-mentioned machining features and typical features in the normal milling process has established the basis to study the ultrasonic vibration milling.
When ultrasonic longitudinal vibration was imposed along the feed direction on the basis of traditional milling, it was necessary to add an additional ultrasonic vibration displacement with amplitude and frequency along the direction on the milling tool tip, and the trajectory equations are shown in Eq. (2):
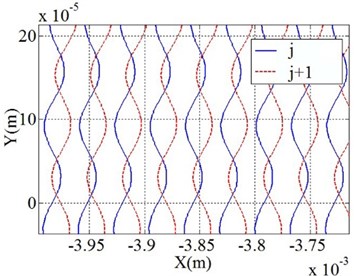
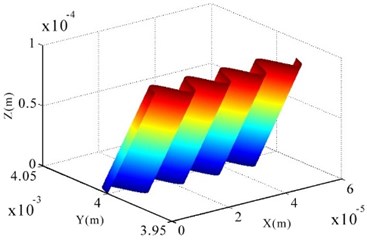
Under certain ultrasonic vibration conditions and cutting conditions, the adjacent tool-tip trajectories intersected. When the rotation rate was 6000 rev/min, the feed per tooth was 12 μm/tooth, the amplitude was 10 μm, the frequency was 33 KHz, and the number of teeth of the end mill was defined as , 4; the tool tip trajectory has been shown in Fig. 1. The dotted line and the solid line in the figure show the trajectories of the two adjacent teeth. The closed loop region formed by the intersection of the trajectories was equivalent to the displacement in the direction, and varied in the direction.
Fig. 1Simulation of longitudinal ultrasonic vibration motion trajectory
When the longitudinal vibration ultrasonic face milling was imposed along the feed direction, the formation of machined surface morphology was obtained according to the interaction between the vibration frequency and the tool rotation frequency 1/, the amplitude and the feed amount per tooth. For discussion, the ratio of the vibration frequency to tool rotation frequency (/60) was set to be 60), the ratio of the feed amount per tooth to amplitude was . Substituting, 60) into Eq. (2), the motion trajectory equation was as obtained, as shown in Eq. (3):
For a four edge end mill, the tooth passes the point at during the same rotation period while the tooth passes the point at , and the time difference between and is given in Eq. (4):
The width of the intersection area was obtained from the coordinate difference of the tool tip trajectory of two adjacent teeth in the direction according to Eq. (5):
Substituting the Eq. (3) into Eq. (5), the absolute value of the coordinate difference between the two adjacent tool tips in the direction after simplification was obtained, as shown in Eq. (6):
It can be derived from Eq. (6) that the coordinate difference of the adjacent trajectory in the direction during the ultrasonic-assisted face milling in the feed direction was a sinusoidal function. The value of represented the morphology characteristics of the machined surface micro-texture to a certain extent. When the value of was less than zero, the two adjacent tool tip trajectories intersected in the same vibration period. When the value of was equal to zero, the two tool tip trajectories were tangent to form a closed region. According to Eq. (6), the range of values of was determined by the feed per tooth and . The machined surface formed a closed region of the motion trajectory as given by Eq. (7):
When Eq. (7) was satisfied, if was an even number, the difference in the direction of the two adjacent tool tip trajectories was identically equal to the feed per tooth . Therefore, the tool tip trajectories were parallel to each other and never intersected at all, and when the tool tip was an odd number, the adjacent two too tip trajectories intersected and formed a larger closed region. The maximum spacing in the direction reached to .
When the value of was equal to zero, the adjacent two tool tip trajectories were tangent and a critical closed region appeared on the machined surface. Then the feed per tooth and the amplitude were satisfied, as shown in Eq. (8):
The above analysis shows that when was non-even and the adjacent two tip trajectories intersected and formed a closed region on the machined surface, while when , the cross closed of the adjacent two tool tip trajectories did not occur.
When Eq. (8) was satisfied, assuming that the trajectory of the tooth at intersected that of tooth at , i.e., , the minimum time difference between and is given by Eq. (9):
Similarly, when the tooth passed the point at , tooth passed the point at , and the length of the intersecting region was calculated by the coordinate difference of the adjacent two too tip trajectories in direction, as shown in Eq. (10):
By substituting Eq. (3) into Eq. (9), Eq. (11) was achieved:
From Eq. (11), it was found that the length of the closed region in the direction depended on the ratio of vibration frequency to the spindle rotation frequency (/60). The larger the value, the smaller was the length of in the direction. When the angle between the cutting edge and the axis was (, the difference of two too tip trajectories in direction was the largest. At this time, the too tip trajectory on the machined surface in the direction exhibited the largest closed region.
In summary, during the ultrasonic milling process in which the longitudinal vibration was applied in the feed direction, only if the conditions: and to be an integral multiple of 4 were satisfied, a larger intersection area appeared for the two adjacent tool tip trajectories, and the separation between tools and workpiece was obvious.
3. Model of feed-direction ultrasonic vibration-assisted face milling surface
The generation of the machined surface microstructure was essentially formed by the relevant motion between the tools and workpiece. Each cutting edge left an envelope surface after sweeping on the part surface. The theoretical model of the machined surface can be obtain after solving the height value of each envelope surface [18].
3.1. Simulation of discretization and motion trajectory of the cutting edge
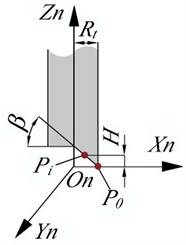
The main cutting edge participated in the cutting when the end mill is face milling. For the convenience of calculation, the cutting edge was simplified to be discrete and a linear line. Fig. 2 shows the coordinate system - of tools. This coordinate system was rotated with the main axis and the rotation angle was . The origin was located at the intersection between the plane of the tool tip and the axis of the tool, the tool radius was , and the height of any point on the cutting edge was . The coordinate of the in the coordinate system of tools was derived from the geometric relationship, as shown in Eq. (12):
where, is the radius of the end mill and is the back angle.
Fig. 2Tool coordinate system and workpiece coordinate system
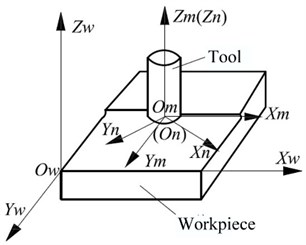
On transforming the discretized cutting edge point in the coordinate system of tools to the coordinate system of workpieces, i.e., , rotating with axis and translation along the path vector , the cutting edge vector was formed as shown in Eq. (13):
wherein, the composition of path vector is determined by kinematic parameters as shown in Eq. (14):
Eq. (13) is the motion trajectory of cutting edge which was formed in the coordinate system of the workpiece, and the simulation results are shown in Fig. 3.
Fig. 3Simulation of motion trajectory of vibration cutting edge
3.2. Modeling of the machined surface microstructure
Generally, the three-dimensional surface model is established by the Boolean calculations on the motion trajectory of each cutting edge to obtain the intersection of each motion trajectory [19]. The minimum value in the direction was taken as the residue height of the machined surface. Due to the ultrasonic vibration, the motion trajectory is complicated under ultrasonic vibration face milling. Each cutting edge interfered with each other. It was thus difficult to solve the three-dimensional motion trajectory equations of multi-edge tool for accurate results. Therefore, the machined surface of ultrasonic vibration assisted face milling was modeled by the workpiece mesh discrete method, i.e., the workpiece in the - plane was first dispersed according to the fixed step size to obtain the two-dimensional coordinates of a series of discrete points. Then the value of of each cutting edge at the discrete points of the grid was solved according to the Eq. (13), and the minimum value of each cutting edge was taken after comparison. Finally, the three-dimensional coordinates of all the dispersed points in the coordinate system of tools were obtained, and the three-dimensional micro-morphology of the machined surface was formed. According to the kinematics equation using the MATLAB software, the microstructure characteristics of the machined surface was generated, and the calculation flow is shown in Fig. 4.
When the workpiece was gridded, the workpiece was grid discretized on the basis of the step size of the original motion trajectory, and a three-dimensional matrix was built to store the discretized points on the grid. This ensures that the data matched well and the true morphology of the machined surface could be reproduced to a maximum extent. Since, the coordinate values of the grid points on the workpiece were difficult to completely match the mapped value of the motion trajectory in the - plane, each discretized grid point was approximately substituted within a certain range.
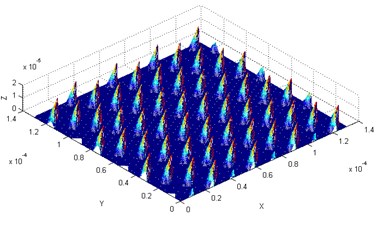
The four-edge plane end mill was used, wherein the radius of the tool was 4 mm, and the back angle of the tool was 30°. Different machining parameters were input to obtain the theoretical model of the machined surface microstructure. When the rotation rate was 600 r/min, the feed rate per tooth was 8 μm, the cut depth was 0.1 mm, the vibration frequency was 20 kHz, and the simulation of the machined surface with different amplitude are shown in Fig. 5.
Fig. 4Flow chart of theoretical modeling for machined surface
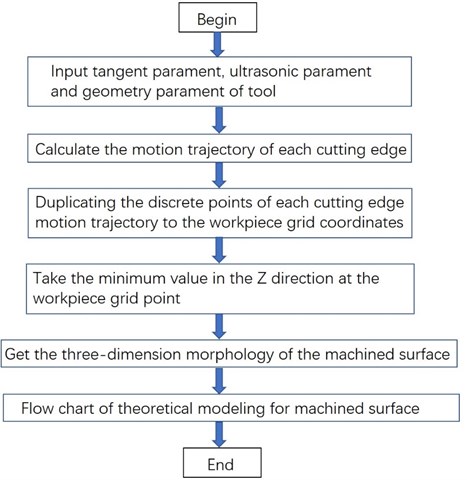
Fig. 5Theoretical model of the machined surface with different vibration amplitude
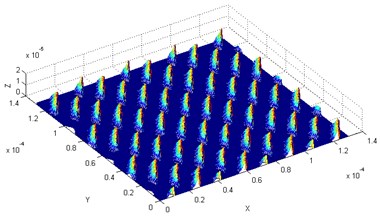
a)5 μm
b)10 μm
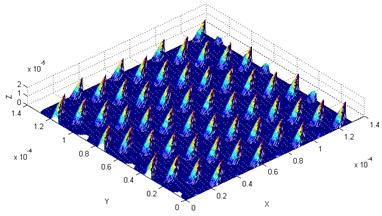
When the vibration frequency was 20 kHz, the amplitude was 8 μm, the feed rate per tooth was 8 μm, the cut depth was 0.1 mm, and the simulation of the machined surface with different rotation rate n are shown in Fig. 6.
Fig. 6Microstructure of machined surface with combined longitudinal-torsional vibration
a)600 r/min
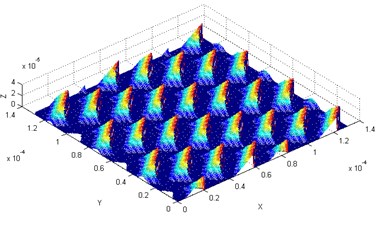
b)2000 r/min
It was observed that the ultrasonic vibration assisted face milling could form a regular squamous microstructure. The coupling of the spindle rotation, feed per tooth, and ultrasonic amplitude influenced its morphology, density, size, etc. Thus, the change of any processing parameter can lead to the change in the microstructure of the machined surface.
4. Experimental study on ultrasonic face milling
4.1. Experimental protocol
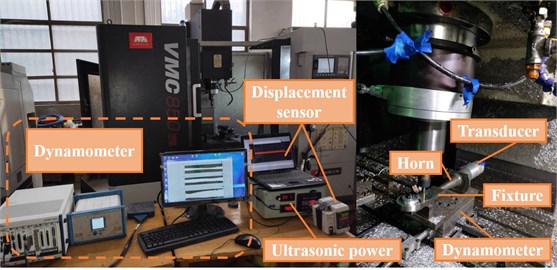
A vertical machining center was used for the cutting experiments. A one-way vibration platform of the workpiece was applied for the ultrasonic vibration luffing system. During the cutting, the workpiece reciprocated a high-frequency vibration with the vibration system in the feed direction. The ultrasonic generator generated a high-frequency oscillating electric signal and converted the electric signal to ultrasonic frequency mechanical vibration via a sandwich transducer. When the conical horn converted the energy, the vibration amplitude was amplified with an amplification coefficient . Ultrasonic current value was adjusted by changing the power to obtain different amplitudes. During the experiments, Kistler three-way tester, 5057 multi-channel charge amplifier and computer were made of the force measuring system to dynamically test the milling force generated during the cutting process. The tool consisted a four-edge plane end mill with AlTiSiN coating and a diameter of 8 mm. The down milling dry cutting method was used. The TiC4 titanium alloy was selected as the machined object. The corresponding experimental equipment and apparatus are shown in Fig. 7.
Fig. 7Experimental equipment and apparatus
A straight-line tool path was used and the effect of processing parameters on the surface microstructure was discussed by a single factor experiment. The experimental parameters are listed in Table 1.
Table 1Experimental parameters of ultrasonic longitudinal torsion face milling
Single factor experiment with amplitude | Single factor experiment with cutting rate | ||
Cutting rate (m/min) | 30 | Cutting rate (m/min) | 15/30/60/90/120 |
The feed per tooth (μm/T) | 8 | The feed per tooth (μm/T) | 8 |
Axial cutting depth DOC (mm) | 0.3 | Axial cutting depth DOC (mm) | 0.3 |
Amplitude (μm) | 0/1/2/3/5 | Amplitude (μm) | 3 |
Vibration frequency (kHz) | 22.7 | Vibration frequency (kHz) | 22.7 |
Vibration type | Feed direction | Vibration type | Feed direction |
4.2. Experimental results
4.2.1. Surface microstructure
The input factors included the cutting rate , feed per tooth , axial cutting depth DOC, vibration frequency , amplitude . The machined surface microstructure was detected using EYENCE type super depth.
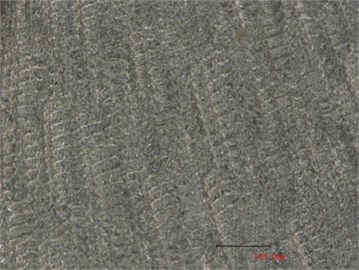
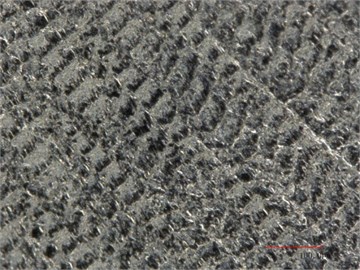
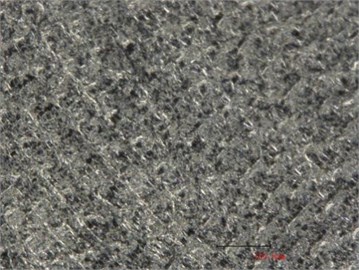
Fig. 8Surface microstructure with different amplitudes
a)0
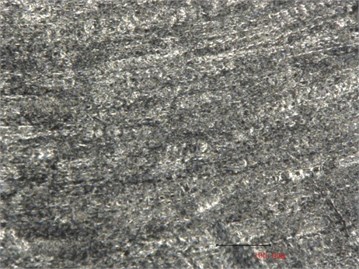
b)1
c)3
d)5
Under the irradiation of parallel light, it was found that the machined surface showed a bright light using normal milling (0), while the machined surface showed a colored texture using ultrasonic vibration assisted milling. This was caused by the overlock vibration which led to the change in the tool tip motion trajectory, resulting in the evenly distributed marks on the machined surface. These marks interfered with the light under light irradiation and formed a colored textured surface. Fig. 8 shows a cutting surface with a cutting rate 30 m/min, a feed per tooth 8 μm/T, and an axial cutting depth 0.3 mm. The microstructure of the surface, which was machined with an end milling at different amplitudes was observed under the super depth of field. A comparative analysis was performed and Fig. 8(a) shows that for the normal milling, the surface micro-texture was disordered, and there was an adhesion and thorn between the tools and workpiece. The marks interfered with each other irregularly. Fig. 8(b) shows the machined surface when the amplitude was 1 μm. The machined surface under this condition initially formed a vibration micro-texture due to the ultrasonic vibration. However, the relative amplitude led to a nonuniform distribution of the micro-vibration patterns. Fig. 8(c) shows the machined surface when the amplitude was 3 μm. At this time, a regular scale-like vibration texture was formed. The micro-texture on the surface was uniformly distributed. Fig. 8(d) shows the machined surface when the amplitude was 5 μm. This surface also showed the ultrasonic vibration texture. The sinusoidal like tool tip trajectory was visible while a large area of the tool mark was vague. This is because that the adjacent tool tip motion trajectories intersected when the amplitude was relatively large (), and the cutting marks overlapped each other to result in the unclear micro-texture of the machined surface.
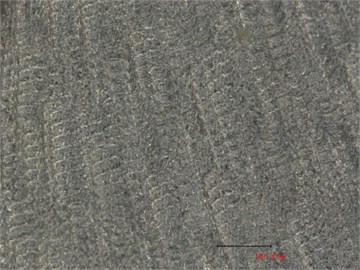
Fig. 9 shows the microstructure of the machined surface which was obtained by ultrasonic end face milling at a different cutting rate and observed in the super depth of field when the feed per tooth was 8 μm/T, axial cutting depth was 0.3 mm, and the amplitude was 3 μm. The experimental results are shown in the figure. Fig. 9(a) shows that the rotation period was relatively large when the cutting rate was 30 m/min and the axial rotation rate was low. Therefore, the number of vibrations occurred in a single rotation period were large, the bending curvature of the simple harmonic vibration surface was large, and the micro-vibration characteristics formed on the machined surface were curved and dense. The cutting rate of Fig. 9(b), 9(c), and 9(d) was 60 m/min, 90 m/min, and 120 m/min, respectively. As the cutting rate increased, the number of vibrations in a single rotation period decreased, and the vibration texture was scattered. A further analysis indicates the presence of coupling relationships between the spindle rate and rotation frequency. When the spindle rate was large, the ratio of the ultrasonic vibration frequency to the spindle rotation frequency was small, and the number of ultrasonic vibrations of the spindle rotation in a period decreased. The formed micro-texture of the ultrasonic vibration were large.
Fig. 9Surface microstructure with different rotation rates
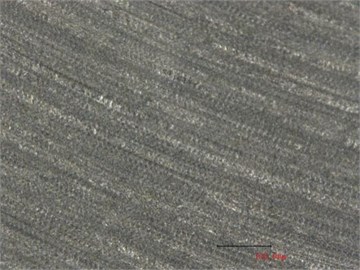
a) = 30 m/min
b) = 60 m/min
c) = 90 m/min
d) = 120 m/min
In summary, the microstructure of the machined surface from ultrasonic assisted face milling surface in the feed direction was in accordance with the theoretical results, and the experimental results were basically consistent with the theoretical model under different processing parameters.
4.2.2. Roughness of machined surface
The processed workpiece was cleaned using ultrasonic in an acetone solution, and then the value of line roughness and the surface roughness of the machined surface were measured on a Taylor Hobson white-light interferometer. The scanning range was 0.9 mm×0.9 mm. To ensure the accuracy of the measurement, 5 measuring points were selected for each machined surface, and the average value was taken as the value of roughness of the machined surface.
Fig. 10 shows the roughness of the machined surface obtained at different ultrasonic amplitudes under certain cutting rate, feed per tooth, and axial cutting depth. The measurement indicated that the roughness of machined surface obtained by ultrasonic vibration face milling was greater than the roughness of machined surface obtained by the normal face milling (0). Besides, the surface roughness first decreased and later increased, with an increase in ultrasonic amplitude. This can be ascribed to the introduction of ultrasonic vibration which led to the change of tool tip trajectory to form the scaly microstructure on the machined surface unique to the ultrasonic vibration processing. The height of the scale caused the increase in the surface roughness. With the increase of ultrasonic amplitude, the surface scaly vibration microstructure became gradually uniform and simultaneously the surface roughness declined. When the amplitude was relatively high, due to the large size of machined surface scaly vibration microstructure, the surface height of microstructure further resulted in the increase in the surface roughness.
Fig. 10Surface roughness at different amplitudes
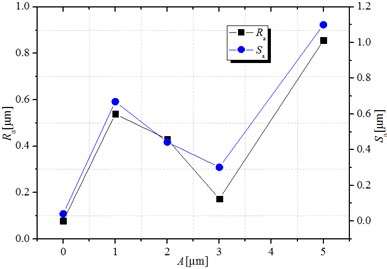
Fig. 11Surface roughness at different cutting rates
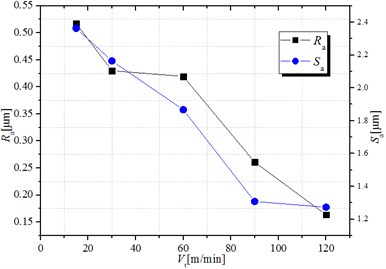
Fig. 11 shows that in a fixed amplitude, feed per tooth, and axial cutting depth, the machined surface roughness gradually declined with an increase in the cutting rate. This is because as the cutting rate increased, the power consumption of tool also increased, and more heat generated per unit time caused the cutting temperature to rise. The cutting bottom softened because of the high temperature to reduce the friction between the bottom of the cuttings and the rake face that led to a more stable cutting process. Therefore, the surface roughness decreased with an increase in the cutting rate.
5. Friction and wear characteristics under ultrasonic vibration
The friction and wear experiments were carried out on the machined surface of ultrasonic vibration face milling to investigate the tribological properties of different microstructure surfaces under different processing parameters. The parameters of friction tests are listed in Table 2. The MMW-1 vertical universal friction and wear tester was used in the experiment and the friction testing ground is shown in Fig. 12.
Table 2Parameters of friction and wear tests of the machined surface
Normal load | 20 N | Rotation rate | 4 r/min |
Friction amplitude | Pin plate | Sampling frequency | 3.3 Hz |
Friction radius | 23 mm | Testing temperature | Room temperature |
Revolution | 100 rpm | Lubrication condition | Dry friction |
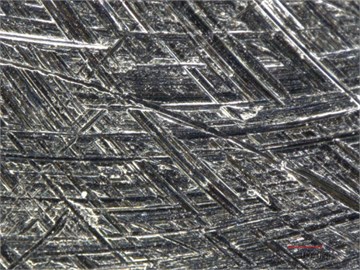
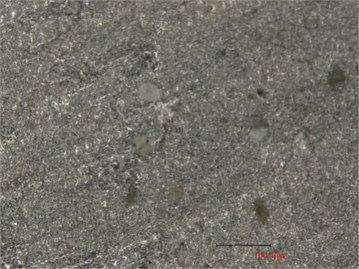
Fig. 13 shows the surface morphology of the normal face milling and ultrasonic vibration face milling after wear. It can be seen from the comparison that the wore machined surface of conventional face milling in Fig. 13(a) has burrs and breakage at the boundary of the friction groove. The bottom of the groove showed bright wear marks and surface defects such as adhesions and pits. Fig. 13(b) shows that the machined surface of ultrasonic face milling after friction, the boundary of the friction groove was smooth, and the vibration micro-texture remained on the bottom of wore friction groove. This is because that the scaly convex peaks were worn away and stored in the pits around the scaly network, effectively avoiding the three-body friction.
Fig. 12Friction and wear testing ground
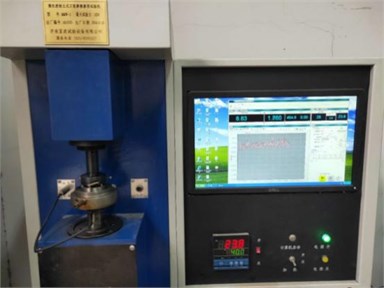
Fig. 13Frictional surface morphology after conventional milling and ultrasonic face milling
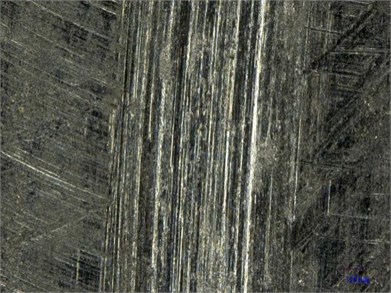
a) Conventional milling
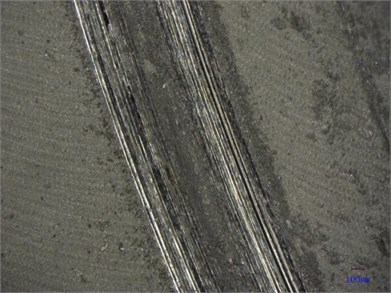
b) Ultrasonic vibration face milling
Fig. 14Friction coefficient curves of the machined surfaces of conventional milling and ultrasonic milling
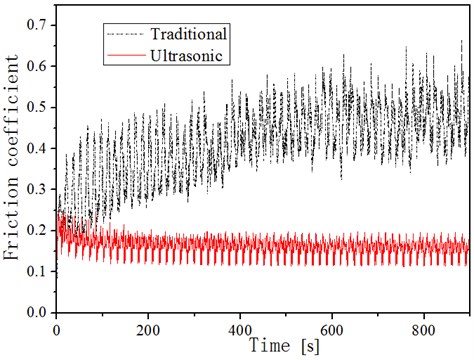
As shown in Fig. 14, there is a certain difference between the state of the friction coefficient curves of the ultrasonic vibration face milling and normal face milling. Analyzing the microstructure of the machined surface, it can be seen that due to the irregular structure on the machined surface of the conventional face milling and the disordered marks including burrs and adhesions, the friction coefficient on the test piece showed a large fluctuation. The initial wear-in stage was relatively long. However, the machined surface of ultrasonic face milling formed a uniform vibration micro-texture, resulting in a stable fluctuation of the friction coefficient and no obvious boundary was found between the initial wear-in stage and the normal wear stage. The friction coefficient slightly declined with the increasing friction time. The friction coefficient of the ultrasonic milled surface was significantly reduced compared with conventional milling.
Fig. 15Friction coefficient curve with different “A”
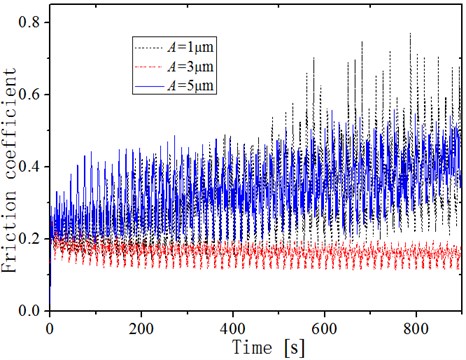
Fig. 15 shows the friction coefficient curves in 0-900s friction range of the machined surface of ultrasonic face milling under an ultrasonic amplitudes was 1 μm, 3 μm and 5 μm with a cutting rate = 30 m/min, feed per tooth 8 μm/T, and axial cutting depth 0.3 mm. It can be seen that when ultrasonic amplitude was 1 μm, the running in stage of the friction coefficient curve is longer and fluctuates violently. It because that the amplitude was small at this time, and the microstructure of the machined surface had not formed significant characteristics and was not evenly distributed. When the ultrasonic amplitude increased to 3 μm, there was no obvious running in stage on the friction coefficient curve, and the curve fluctuates smoothly and the friction coefficient was low. Because of the regular periodic surface microstructure formed on the machined surface, the contact height of the friction pair also changed periodically. At this time, due to the special tool tip movement path, the microstructure unit on the machined surface did not form a closed form, and the periodic fluctuation range of friction coefficient was reduced. Compared with other parameters, the friction and wear properties of the surface formed under this parameter are significantly improved. When the ultrasonic amplitude increased to 5 μm, the friction coefficient increased compared with the friction coefficient of 3 μm, and its fluctuation range increased. At this time, due to the intersection of adjacent tool tips, a more compact closed microstructure was formed on the machined surface, which further complicates the change of contact height between friction pairs.
Fig. 16 shows the friction coefficient of the machined surface of ultrasonic face milling under different amplitudes with = 30 m/min, 8 μm/T, and 0.3 mm. As the friction coefficient increased with the ultrasonic amplitude, the friction coefficient of the machined surface of ultrasonic face milling initially decreased and later increased. The friction coefficient was the smallest when 3 μm. At this time, the friction coefficient was reduced by 60 % in comparison with that of conventional face milling. When the ultrasonic amplitude was small, the vibrational microstructure was initially formed on the surface of the ultrasonic vibration face milling and the distribution was not yet uniform. The microscopic height of the scaly texture was small. When the textured surface was rubbed against the high hardness friction pin, the surface microstructure was rapidly worn down, and the ultrasonic vibrational micro-texture disappeared. As there was a rise in the ultrasonic amplitude, the machined surface generated a regular scaly microstructure, which could store the abrasives during the friction process, and the abrasives further separated the friction pin from the material surface, reducing the shear resistance of the two contact surfaces. Therefore, the friction coefficient was more stable and reduced to some extent. When the ultrasonic amplitude was too large, the formed scaly microstructure was high on the machined surface, and multiple cutting edges interfered, resulting in the increase in the surface roughness. The effective contact area between the frictional pairs reduced to increase the contact pressure. The friction coefficient of the machined surface thus rose, which had a negative influence on the friction and wear performance.
Fig. 16Friction coefficient of the machined surface under different amplitudes
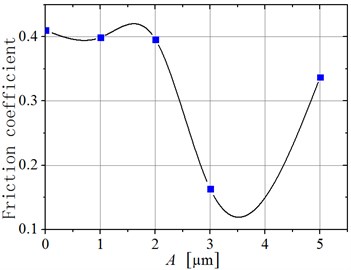
Fig. 17 shows the friction coefficient curves in 0-900 s friction range of the machined surface of ultrasonic face milling under the cutting rate was 15 m/min, 60 m/min and 120 m/min with 4 μm, 8 μm/T, and 0.3 mm.
Fig. 17Friction coefficient curve with different “vt”
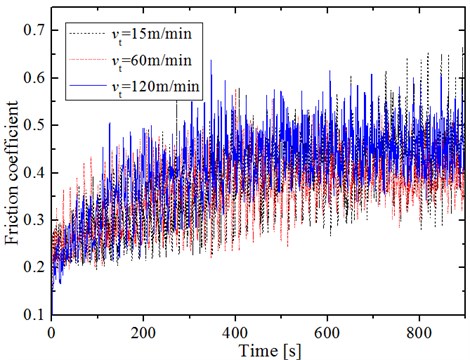
It can be seen that when the cutting rate was 15 m/min, the friction coefficient fluctuates most and the running in stage is the longest. With the increase of cutting rate, the fluctuation of friction coefficient becomes stable gradually, and the running in stage has also been shortened. When the cutting rate was low, the microstructure formed on the machined surface was relatively dense and compact, and the change period of surface microstructure characteristics was short, the change frequency of contact height of friction pair was high, which makes the friction coefficient fluctuate greatly and violently. On the contrary, when the cutting rate was high, the microstructure characteristics of the machined surface were loose and the structure size was large, the surface microstructure change period was longer, and the frequency of friction pair contact height change was low, so the friction coefficient fluctuation had been improved.
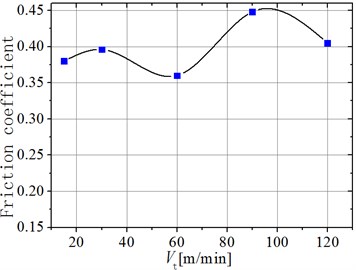
Fig. 18 shows the friction coefficient of the machined surface of ultrasonic face milling under different cutting rates with 1.2 μm, 8 μm/T, and 0.3 mm. It is observed that the increase in the cutting rate under this condition exhibited a little effect on the friction coefficient of the machined surface, and the changes showed no obvious regularity.
Fig. 18Friction coefficient of the machined surface under different cutting rates
6. Conclusions
1) When the ultrasonic vibration milling was carried out in the feed direction and only if /2 and the ratio of vibration frequency to spindle rotation frequency, i.e., /60), was an integral multiple of 4, a larger intersection area appeared for the two adjacent tool tip trajectories, and the separation between tools and workpiece was obvious.
2) By discretizing the cutting edge and workpiece and using MATLAB to theoretically model the microstructure of the machined surface, it was found that the surface of vibration face milling in the feed direction created a regular scaly microstructure. The spindle rotation rate, feed per tooth and the ultrasonic amplitude affected the morphology, density, and size.
3) Single-factor ultrasonic vibration face milling tests were carried out using TC4 titanium alloy that showed the obvious irregular structures such as tooth marks, adhesions, and pits on the machined surface using normal milling. However, in the ultrasonic vibration face milling in the feed direction, the machined surface generated uniform vibrational microstructure to overlap the normal marks, and obtained relatively regular scaly microstructure. The experimental results were highly consistent with the theoretical model.
4) With the increase in the ultrasonic amplitude, the surface scaly vibrational microstructure gradually became uniform. When the amplitude was too large, the tool tip trajectories interfered, resulting in the overlapping with each other of the microstructure. The surface roughness initially decreased and later increased with an increase in the amplitude. When the cutting rate was low, the formed micro- vibrational characteristics on the machined surface were relatively curved and dense, while when the cutting rate was large, the formed ultrasonic vibrational micro-texture was large and sparse, the surface roughness was reduced with the increase in the cutting rate.
5) The experimental results of friction and wear tests indicated that the tribological characteristics of the face milling were improved by the ultrasonic vibration in the feed direction. The friction coefficient on the machined surface of conventional face milling showed obvious fluctuation and the initial wear-in stage was long. The friction coefficient on the machined surface of ultrasonic vibration face milling was stable and the initial wear-in stage showed no boundary in comparison with the normal wear stage. Amplitude exhibited a great influence on the friction and the wear performance on the machined surface, and the friction coefficient initially reduced and later increased with an increase in the vibration amplitude. The friction coefficient was the smallest with a cutting rate = 30 m/min and vibrational amplitude 3 μm, which reduced by 60 % in comparison with the normal face milling.
References
-
I. Inasaki, “Grinding of hard and brittle materials,” CIRP Annals, Vol. 36, No. 2, pp. 463–471, 1987, https://doi.org/10.1016/s0007-8506(07)60748-3
-
Huang Yun et al., “Research progress of aero-engine blade materials and anti-fatigue grinding technology,” (in Chinese), Journal of Aeronautical Materials, Vol. 41, No. 4, pp. 17–35, Aug. 2021, https://doi.org/10.11868/j.issn.1005-5053.2021.000058
-
C. Zhang, B. Zhao, and Y. Niu, “Design, simulation, and adjustment of the longitudinal-torsional composite integrated ultrasonic variable amplitude system,” Advances in Mechanical Engineering, Vol. 10, No. 10, p. 168781401880473, Oct. 2018, https://doi.org/10.1177/1687814018804739
-
C. L. Zhang, P. F. Feng, and J. F. Zhang, “Optical glass rotating ultrasonic surface milling surface characteristics,” (in Chinese), Journal of Tsinghua University, Vol. 52, pp. 1616–1621, Nov. 2012.
-
S. Y. Zheng, P. F. Feng, and X. P. Xu, “Development trends of rotary ultrasonic machining technology,” Journal Tsinghua University, Vol. 49, pp. 1799–1804, Dec. 2009.
-
J. Mekanikal, O. A. Ceramics, and C. Y. Khoo, “A review on the rotary ultrasonic machining of advanced ceramics,” Journal Mekanikal, Vol. 25, pp. 9–23, 2008.
-
C. Ma, J. H. Zhang, and G. C. Tao, “Wear and friction properties of titanium alloy surface subject to ultrasonic vibration assisted milling,” (in Chinese), Surface Technology, Vol. 46, pp. 115–119, Aug. 2017, https://doi.org/10.16490/j.cnki.issn.1001-3660.2017.08.019
-
X. Liu, X. Hu, J. Zhang, and D. Wu, “Study on the fabrication of micro-textured end face in one-dimensional ultrasonic vibration-assisted turning,” The International Journal of Advanced Manufacturing Technology, Vol. 105, No. 5-6, pp. 2599–2613, Dec. 2019, https://doi.org/10.1007/s00170-019-04535-y
-
A. Erdemir, “Review of engineered tribological interfaces for improved boundary lubrication,” Tribology International, Vol. 38, No. 3, pp. 249–256, Mar. 2005, https://doi.org/10.1016/j.triboint.2004.08.008
-
K.-H. Zum Gahr, R. Wahl, and K. Wauthier, “Experimental study of the effect of microtexturing on oil lubricated ceramic/steel friction pairs,” Wear, Vol. 267, No. 5-8, pp. 1241–1251, Jun. 2009, https://doi.org/10.1016/j.wear.2008.12.108
-
A. Nestler and A. Schubert, “Surface properties in ultrasonic vibration assisted turning of particle reinforced aluminium matrix composites,” Procedia CIRP, Vol. 13, pp. 125–130, 2014, https://doi.org/10.1016/j.procir.2014.04.022
-
R. Börner, S. Winkler, T. Junge, C. Titsch, A. Schubert, and W.-G. Drossel, “Generation of functional surfaces by using a simulation tool for surface prediction and micro structuring of cold-working steel with ultrasonic vibration assisted face milling,” Journal of Materials Processing Technology, Vol. 255, pp. 749–759, May 2018, https://doi.org/10.1016/j.jmatprotec.2018.01.027
-
S. A. Sajjady, H. Nouri Hossein Abadi, S. Amini, and R. Nosouhi, “Analytical and experimental study of topography of surface texture in ultrasonic vibration assisted turning,” Materials and Design, Vol. 93, pp. 311–323, Mar. 2016, https://doi.org/10.1016/j.matdes.2015.12.119
-
X. M. Luan, B. L. Hu, and Z. J. Zhou, “Research on unidirectional ultrasonic vibrations turning 7075-T6 aluminum alloy surface quality and morphology,” (in Chinese), Journal of Hunan University of Science and Technology, Vol. 29, pp. 27–30, Feb. 2014.
-
H. Li and Z. D. Lu, “3D Surface topography modeling and research for ultrasonic grinding,” (in Chinese), Electronic Science and Technology, Vol. 31, pp. 56–60, Mar. 2018.
-
Wang Qiuyan et al., “Research on modeling and simulation of surface microtopography in ultrasonic vibration spiral grinding,” (in Chinese), Journal of Mechanical Engineering, Vol. 53, No. 19, pp. 83–89, 2017, https://doi.org/10.3901/jme.2017.19.083
-
Y. Chang et al., “Experiment study on the influence on friction-factor by ultrasonic vibration,” (in Chinese), Piezoelectrics and Acoustooptics, Vol. 25, pp. 511–513, Jun. 2003.
-
H. Chen and J. Tang, “A model for prediction of surface roughness in ultrasonic-assisted grinding,” The International Journal of Advanced Manufacturing Technology, Vol. 77, No. 1-4, pp. 643–651, Mar. 2015, https://doi.org/10.1007/s00170-014-6482-3
-
A. P. Xu et al., “Workpiece-grid-spaced simulation algorithm for peripherally milled surface topography,” (in Chinese), Journal of XI’AN Jiaotong University, Vol. 35, pp. 502–505, May 2001.
Cited by
About this article

This research was supported by National Natural Science Foundation of China (U1604255), Doctoral research fund project of Henan University of Animal Husbandry and Economy (2020HNUAHEDF005), Key scientific and technological project of Henan Province (212102310574).
