Abstract
In this paper, a numerical model of the shear thickening fluid (STF) is generated and the rheological properties are compared with the experimental data. Power Law model has been used to fit the rheological data for STF. Experimental data is taken from a performed study and a user defined function (UDF) has been written to develop the shear thickening behavior. The purpose of this study is to exactly model the behavior of shear thickening fluids by using UDF, to explain the shear-thickening mechanisms under different shear rates. Different parameters like viscosity, shear stress and velocity of the STF have also been reported.
1. Introduction
Shear thickening fluid (STF) is a non-Newtonian fluid which shows abrupt increase in apparent viscosity as the shear rate reaches a certain value which is known as the critical shear rate (CSR) [1]. This unique behavior of STFs has been recognized very useful in defense applications. When woven fabric (e.g. Kevlar) is impregnated with STF, it provides protection against ballistic threats. In other applications of STF, it is used in sports equipment’s and automobiles [2].
STF is a dense colloidal dispersion which contains nano sized solid particles inside a carrier fluid [3]. Initially when the shear rate is applied on STFs, then the random distribution of particles in the dispersion tries to come in ordered form, because the hydrodynamic forces overcome the repulsive forces acting between the interstitial spaces of particles. This arrangement of particles constitutes the order-disorder theory which was proposed by Hoffmann in 1972 [4]. As the shear rate further increase, the increased hydrodynamic forces tend to squeeze out the fluid between the interstitial spaces, resulting in the formation of hydroclusters. This phenomenon constitutes hydrocluster mechanism which was proposed by Brady and Bossis in 1985 [5]. These clusters are stress bearing and cause the jamming of particles when further shearing forces are applied.
Shear thickening is a reversible phenomenon and is governed by Power law model (Ostwald-de Waele relationship) [6]. A general non-Newtonian fluid is described by the Power-Law Model as per Eqs. (1) and (2):
where, is shear stress (Pa), is shear rate (s-1), is flow consistency index, is flow behavior index, is apparent viscosity (Pa.s).
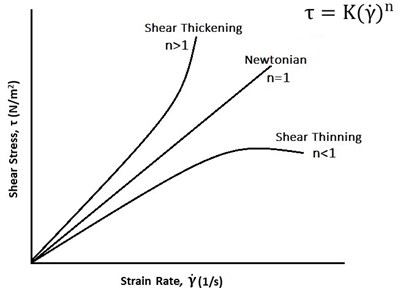
Eq. (1) is the expression of power law model and Eq. (2) is the expression for apparent viscosity. According to Fig. 1, if 1 then fluid will behave like a Newtonian fluid. If 01, fluid will exhibit shear thinning properties. Many dispersions and liquid polymers exhibit shear thinning behavior, when value of ‘’ lies between 0.3-0.7. This depends upon the particle concentration and molecular weight of the carrier fluid. If 1 then the fluid will show the shear thickening effect like cornstarch and water dispersion (Oobleck effect) in 2:1 ratio and 10 wt % fumed silica dispersed in 90 wt % PEG400.
Fig. 1Representation of shear stress (τ) vs strain rate (γ˙) for Newtonian and non-Newtonian fluid
Rheological behavior of non-Newtonian fluid is measured by a device called rheometer. Generally, strain-controlled cone and plate rheometer is used to measure the viscosity of STFs [7]. Cone and plate rheometer consist of a base plate and a cone. Peltier element is in the base plate and a sensor is placed on it. A cone is kept upon the plate with some distance, called the truncation height. Fluid sample is placed between the cone and plate. A torque-controlled motor is used to rotate the cone. When the cone rotates, it applies a shear rate on the fluid. Consequently, the fluid sample is subjected to shearing forces, and the applied torque as well as the shear force are measured by the sensor in the rheometer.
Eq. (3) gives the basic relationship between shear stress (), shear rate () and viscosity [8]:
If the cone angle between cone and plate is and the rotational speed of the cone is (rad/s), then the shear rate () can be determined by Eq. (4). Equivalently, shear stress can be determined by measuresed torque () and the radius of cone () by using Eq. (5):
Fig. 2Cone and plate rheometer [8]
![Cone and plate rheometer [8]](https://static-01.extrica.com/articles/21123/21123-img2.jpg)
2. Materials and method
All the experimental data was taken from a published study which was done by Neelanchali et al. [9].
2.1. Experimental setup
Fumed silica Aerosil A-150 (specific surface area of 150 m2/g and density of 50 g/L) and Poly Propylene Glycol (PPG) 400 was used to synthesize STF. Sample was prepared by using ultrasonic homogenization technique. First, fumed silica was dried at 100 °C for 12 hours in an oven. Then 20 wt % of fumed silica was mixed in PPG 400, in excess amount of ethanol. Sample was dispersed by ultrasonic horn (Ti-horn) at 20 kHz, 1200 W/cm2 and amplitude of 42 %. After homogenization technique, sample was kept in the oven for 2 hours at 80 °C to remove the excess amount of ethanol.
Cone and plate type of rheometer was used to investigate the rheological behavior of STF at 25 °C. Diameter, cone angle and truncation height () of the cone and plate fixture were 50 mm, 0.982° and 0.097 mm respectively.
2.2. Numerical setup
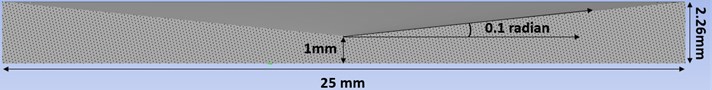
In this section, design, meshing and boundary conditions imposed on the STF are discussed. 3D model of cone and plate fixture has been generated by using ANSYS FLUENT 19.1. Diameter, cone angle and truncation height () of the cone and plate fixture was 25 mm, 0.1 radian and 1 mm, respectively as shown in Fig. 3 [10]. Element size, average aspect ratio, average skewness of the generated mesh was 0.25 mm, 1.8 and 0.23, respectively.
Fig. 3Geometry of cone and plate fixture
2.3. Boundary conditions
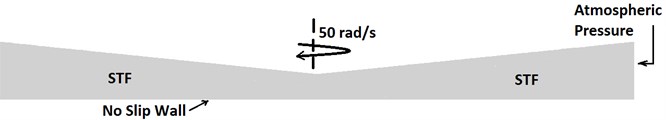
By using cone and plate fixture geometry, a linear mesh was generated in ANSYS FLUENT 19.1. According to Fig. 4, no slip condition was applied to the bottom wall of the cone and plate fixture. Atmospheric pressure boundary condition was given to the outer periphery of the model. Upper wall of the cone was given a rotational velocity ( of 50 rad/s to provide the shear to STF. To fill the STF inside the cone and plate fixture a user define function (UDF) was used. This UDF contained all the chemical as well as physical properties of STF. It was interpreted in ANSYS FLUENT 19.1 setup.
Fig. 4Boundary conditions applied to the STF model
3. Results
In this section, comparison between numerical simulation results and published experimental results has been discussed. Fig. 5 shows the relationship between viscosity and shear rate for simulation as well as experimental results. Shear thickening effect was achieved at a critical shear rate of 39.80 s-1 and 30.95 s-1 in experimental and numerical studies, respectively. By using UDF, the maximum post shear thickening viscosity of STF was measured to be 11.7 Pas, as compared to 12.5 Pas viscosity for experimental data.
Fig. 5Relationship between viscosity (Pa.s) and shear rate (1/s)
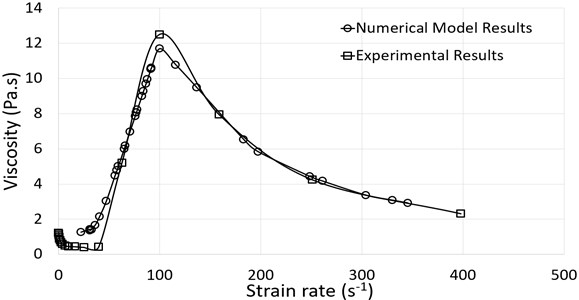
Table 1Error between experimental and numerical viscosities
Experimental viscosity (Pa.s) | Numerical viscosity (Pa.s) | Error % |
1.22 | 1.26072 | 3.34 % |
5.21 | 5.007 | 3.90 % |
12.5 | 11.7 | 6.40 % |
7.94 | 7.94 | 0.00 % |
4.24 | 4.16 | 1.89 % |
Table 1 provides the viscosity values obtained from experimental as well as numerical studies. Percentage error between both the studies varies between 0-6.4 % (max).
Fig. 6 shows the relationship between shear stress and shear rate for simulation and experimental results. From numerical simulation studies it was observed that the maximum stress of 1197.41 Pa was generated in STF at 137 s-1, but as the strain rate further increases to 350 s-1 the stress bearing capacity of STF decreases to 966.4 Pa.
Fig. 6Relationship between shear stress (Pa) and shear rate (1/s)
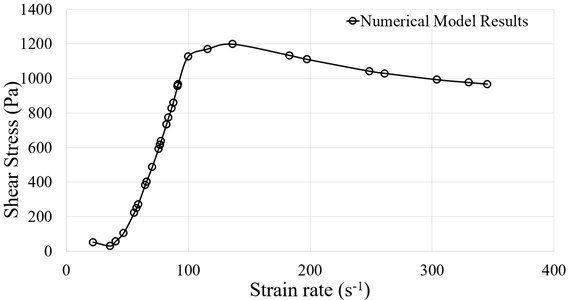
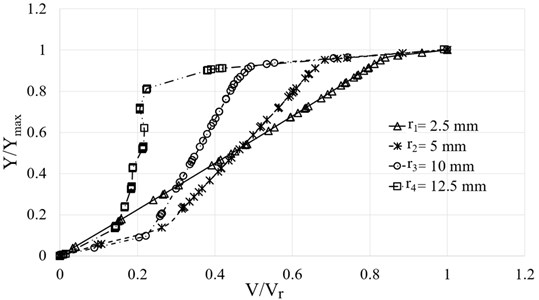
Fig. 7 shows the normalized velocity () variation along normalized vertical distance () at different stations, where and . Here four stations have been taken at different radius of 2.5 mm, 5 mm, 10 mm and 12.5 mm. At these stations, the values of are 0.125 m/s, 0.25 m/s, 0.5 m/s and 0.625 m/s, respectively and values are 1.25 mm, 1.5 mm, 2 mm and 2.25 mm. From this Fig. 7 it can be observed that at first station ( 2.5 mm) normalized velocity () is linear, whereas at other stations normalized velocity does not exhibit linear variation. Also, it is observed that the velocity is almost constant at fourth station. Since the velocity profile is linear at first station, its slope will be constant, so the shear rate can be calculated as:
Now, by using Eq. (4), 54 rad/s. We get rotational speed () approximatly 54 rad/s. Clearly the calculated rotational speed () is very close to the input value which is 50 rad/s.
Fig. 7Normalized velocity (V/Vr) variation along normalized vertical distance (Y/Ymax) at different radius
4. Conclusions
This study is mainly focused upon the numerical simulation of STF, and compared all the simulation results with experimental data. ANSYS FLUENT 19.1 was used to interpret UDF and to simulate shear thickening behavior. The following inferences were drawn from the results:
1) Shear thickening effect was observed at a critical shear rate of 39.80 s-1 and 30.95 s-1 in experimental and numerical studies, respectively.
2) User defined function (UDF) was used to model STF, which is able to achieve the approximated results as compared to experimental data.
3) The maximum post shear thickening viscosity of STF was observed as 11.7 Pa.s from numerical studies, where 12.5 Pa.s viscosity was reported in experimental data.
4) Maximum stress of 1197.41 Pa was found to be induced in STF on account of applied shear forces, as per numerical simulation studies.
References
-
Tarig A., Hassan, Vijay K., Rangari, Jeelani S. Synthesis, processing and characterization of shear thickening fluid (STF) impregnated fabric composites. Materials Science and Engineering: A, Vol. 527, Issue 12, 2010, p. 2892-2899.
-
Asija N., Chouhan H., Bhatnagar N. Synthesis of shear thickening fluids for liquid armour applications. Journal of Manufacturing Sciences, Vol. 6, 1, p. 9-17.
-
Boersma W. H., Laven J., Stein H. N. Shear thickening (dilatancy) in concentrated dispersions. AIChE Journal, Vol. 36, Issue 3, 1990, p. 321-332.
-
Hoffman R. L. Discontinuous and dilatant viscosity behavior in concentrated suspensions. I. Observation of a flow instability. Transactions of the Society of Rheology, Vol. 16, 1972, p. 155-173.
-
Brady J. F., Bossis G. The rheology of concentrated suspensions of spheres in simple shear flow by numerical simulation. Journal of Fluid Mechanics, Vol. 155, 1985, p. 105-129.
-
Chhabra R. P. Non-newtonian fluids: an introduction rheology of complex fluids. SERC School-cum-Symposium on Rheology of Complex Fluids, 2010.
-
Barnes H. A. Shear thickening (“dilatancy”) in suspensions of nonaggregating solid particles dispersed in Newtonian liquids. Journal of Rheology, Vol. 33, Issue 2, 1989, p. 329.
-
Wagner N. J., Lee Y. S. Dynamic properties of shear thickening colloidal suspensions. Rheologica Acta, Vol. 42, Issue 3, 2003, p. 199-208.
-
Asija N., Chouhan H., Bhatnagar N. Study on the low and high strain rate behavior of fumed silica nano silica dispersion. 2nd International Conference on Structural Integrity and Exhibition, 2019.
-
Bennett A., Vlahopoulos N., Jiang W. Modeling of shear thickening fluids for analysis of energy absorption under impulse loading. NDIA Ground Vehicle Systems Engineering and Technology Symposium, 2018.
Cited by
About this article

