Abstract
Some results of measurements of bending deformation concrete span bridge are given. It is shown that for a more detailed estimation of the dynamic answer of the structure and the establishment of the correspondence between the analytical model and behavior of structure, it is necessary to carry out periodic monitoring of tense-strained state of the structure under operating load.
1. Introduction
Engineering structures of the transport industry in durability, reliability, stability, efficiency of service and fixed period must satisfy current modern technical requirements and provide the passage of contemporary loads with set running speed [1-3]. It is provided with the organization and execution of work under their current maintenance and complete overhauling. In recent decades the current contents of engineering structures was aimed mainly at clearing the existing faults and warning occurrence works and further development of new faults and defects were not carried out sufficiently [4]. Besides, continuous operation of engineer construction of railway mains, many of which are serving about 100 years, despite conducting operations has led to a significant deterioration of their physical structures and components, and eventually to a loss of the project performance parameters, i.e. letdown of train loads, chopping speed limit of moving traffic [5-8]. Engineering structures designed by the previously applicable for the period of construction of railway lines of normative documents to other train loads and erosion phenomena. As result of natural phenomena engineering structures were repeatedly subjected to extreme stress [9, 10]. Numerous cases of straining of engineering structures of the transport industry at conditions of increased axle loading and running speeds determine the need to solve problems of timely detection of the nature and causes of strain in structural elements [11]. This is due to the fact that the dilapidation and accident occurring due to the straining processes, cause enormous economic, social and environmental damage, incomparable with the means spent on the protection measures [12, 13].
2. Materials and methods
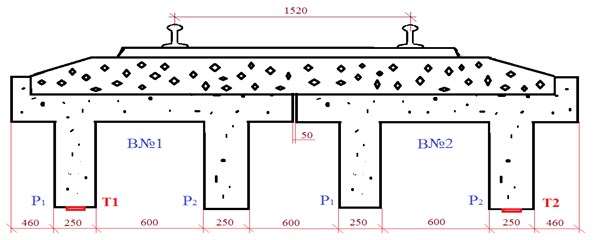
As possibility illustration of mobile complex of features for strain gauge measurements below are given some of the results of measurements of the relative bending deformations of reinforced concrete span of the railway bridge, located on the 118 km of the RM 6 railway Astana-Pavlodar line with the rolling passage, consisting of mobile units of various types (so-called “assembly”). The train consisted of loaded and empty cars, low-sided cars, tanks [1], platforms, hopper boxes in an amount of 74 units. Pulling power is electrics VL-80 and KZ-8A. Span structure consists of two slabs ribbed length of 6 m. Fig. 1 shows a cross-section of the span showing the mounting of resistive strain gages on the structural elements.
Fig. 1Cross section of the span with the measuring instrumentation scheme: BNo. 1 and BNo. 2 T-beam of the span bridge, P1 and P2 T- beam; T1, T2 resistive strain gages
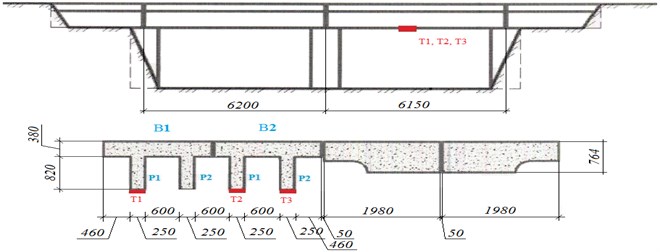
In this paper are given some results of measurements of the relative bending deformations of reinforced concrete span of the railway bridge, located on the 118 km railway RM 6 Astana-Pavlodar railway line under the influence of actually at the given site of train load. The river crossings are characterized by the following parameters: the number and value of the estimated spans –2×5.5 m; the length between the rear abutment (reverse) the walls of –19.74 m; length between the back wall –12.10 m; height –4.35 m; the distance between axis of ways –4.50 m; type of roadbed – on crushed ballast concrete [2]. The layout chart of the strain gauges on the constructions of the test the span bridge is shown in Fig. 2.
Fig. 2The layout chart of measuring instruments on the test structures of the span bridge: B1 and B2 T-beam of the span of the bridge, P1 and P2 center rib of the girder, T1, T2, T3 resistive stain gages
In the guidelines SP 35.13330.2011 Bridges and pipes. The updated edition of SNaR 2.05.03-84*, as we know, there is a limitation on the compliance of the top of the support, which should eliminate the negative effects in the way under the operational load. This restriction has the form:
where the maximum displacement of the top of the support under the operational load, see; is a bridge span, .
If the result of Eq. (1) deduce to dimensionless form:
where 0.005 M-1/2, а and are given in meters, so you can get the following estimate for the period of limitation of support pumping with spans :
where is the span mass; is a equivalent load; 0.1 regulatory factor that determines the magnitude of the braking load in a fraction of the weight of the train [3].
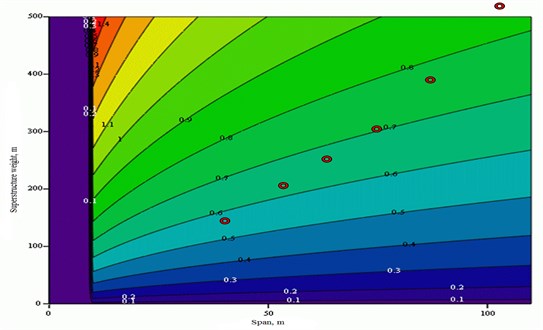
In Fig. 11 is given in isopleths of the dependence of the limiting period of pumping support from the value of the length of span and weight of the span.
In Fig. 11 the actual value of the span are given in points and mass for the characteristic railway bridges. As it can be seen from the figure, the restriction Eq. (3) allows using of vibration isolation, seeking the support of the pitch period pumping support with spans in the range of 0.5-0.9 s. On the one hand it allows about three times reducing the roughness system, which leads to reduction of the seismic loads on the structure. On the other hand, it is impossible to realize in full effect of seismic isolation, which requires the system calibration for a period of 3-4 seconds [5, 6].
In world practice there are many cases where due to improper maintenance and operation of artificial structures, such as bridges, repair of defective repair or with deviations from building regulations, dilapidation and caving have taken place. Sometimes with human victims. The total number of engineering structures of JSC “TC” Kazakhstan Temir Zholy “is 9578 units. Including 3505 bridges, 5352 pipes, 642 other structures (see Table 1).
Table 1Engineering structures on condition of 01.01.13
No. | Name construction | Total quantity, un | Total mileage, km |
1 | Bridges | 3505 | 273,340 |
1.1 | Metal | 211 | |
1.2 | Compound | 19 | |
1.3 | Reinforced concrete | 3208 | |
1.4 | Stone-arched | 67 | |
2 | Pedestrian bridges | 79 | |
2.1 | Metal | 17 | |
2.2 | Reinforced concrete | 62 | |
3 | Pipes | 5352 | |
3.1 | Metal | 143 | |
3.2 | Reinforced concrete | 4568 | |
3.3 | Stone and concrete | 528 | |
3.4 | Compound | 113 | |
4 | Other structures (tunnels, galleries, trays, sustainer walls, etc.) in total | 642 | |
Total | 9578 | ||
In 2013, the research laboratory “Testing ways and constructional structures “(TWaCS)” was established at Kazakh Academy of Transport and Communications named after M. Tynyshpayev. In 2015, the laboratory was accredited by the accreditation system of the Republic of Kazakhstan for compliance with the requirements of ST RK ISO / IEC 17025-2007 “General requirements for the competence of testing and calibration laboratories” (certificate of accreditation KZ.I.02.1656 number of 27 October 2015, registered in the register of accreditation national center accreditation Committee for technical regulation and metrology of the Ministry of investment and development of the Republic of Kazakhstan). The main activities of the laboratory:
• Surveying and testing of bridges, pipe culverts and other artificial structures on the railways and roads, with the estimation of the technical condition and the definition of conditions passing the rolling road, development of recommendations for clearing of breakdown and extending of the fixed period of the safe operation of the facility;
• Training, specialization and experience of specialists in bridge-specialists;
• Field and laboratory studies of soils of foundations existing and planned buildings and structures;
• Vibration based diagnostics of railway roads and artificial structures in transport.
The laboratory “(TWaCS)” is equipped with modern measuring and computing systems consisting of certified and trustee measuring instruments of world leading manufacturers, providing high mobility, range of communication and ease of installation of the measuring equipment. This equipment provides a high degree of fault tolerance and noise immunity of the means of measurement and communication lines, the possibility of expanding the configuration of connected measuring devices (pick up units), the application of the monitoring system, automatic detection and diagnosis of connected devices. With the help of the given equipment can be carried out:
• Measurement of tension and strains in the elements relative spans of bridges under the influence of the rolling stock at the same time in 16 sections with a length of the measuring path up to 500 m;
• Measurement of the dynamic characteristics of bridges under the influence of the rolling stock at the same time in 8 sections with a length of the measuring path up to 250 m;
• Building of charts of flexure and definition of maximum dynamic coefficients of bridge spans under the influence of the rolling stock;
• Definition of certain period (frequency) of own (free) vibrations of bridge spans;
• Definition of amplitude-frequency characteristics of the bridge spans in vertical, horizontal and transverse horizontal longitudinal directions;
• Estimation of the impact of the rolling stock on the approach bridge fill and roadbed.
3. Experimental research
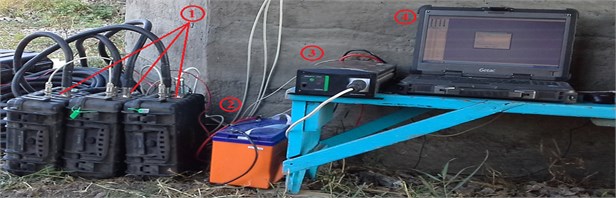
Relative flexural deformation was measured using a cell complex for resistive stain gages measurements with a package of application processing and data visualization software (see Fig. 3).
Fig. 3General view of the mobile complex for strain gage measurement: 1 – measurement module, 2 – storage battery, 3 – sine inverter, 4 – A pilot computer
The emergence and analysis of the conditions under which the dynamic deformation and displacement system “bridge-train” have the most unfavorable in exploitation character, Professor N. G. Bondar considered a high priority task to be studied within the framework of the problem of interaction of bridges and rolling stock [1]. As the load from the rolling stock is concentrated in the axis bogies locations, deflections of the span at each time point will correspond to bending deformation, and it is always possible to find two of its provisions giving the highest and lowest static deflection of the span. From the measured values of bending deformation, knowing the concrete class and calculated modulus of elasticity of the material of construction, according to Hooke's law can make the transition to the true stress in bridge construction. Maximal measured bending deformation of tension region concrete ribbed plate is shown in Table 2.
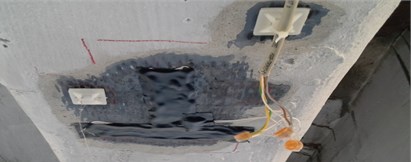
Fig. 4Resistive strain gages FLM-60-11 with a protective coating from the climatic impacts on the bottom plate of ribs. Periodic conducting of measurements of span deformations within 2-3 years will produce a forecast change in its condition in time and to determine the remaining service life for the bearing capacity and carrying load
Maximum deformation at passing of 2-section electrics KZ-8A (39 mm/m) with a speed of 77 km/h in 1, 2 times higher than the maximum deformation of the impact of the locomotive VL-80c (32 mkm/m) at a speed of 66 km/h. The difference between the load on the axle locomotives KZ-8A (25 tf) and VL-80c (24 tf) is 4 %, and the difference between the deformation caused by the impact force data locomotives –20 %. This fact is explained, first of all, with the difference in distances between axles of set of wheels of four-wheel trucks – for electric bogies KZ-8A this distance is equal to 2.6 m, and for bogie VL 80c. 3.0 m. The factor of speed influence of rolling stock in the range of up to 70 km/h can be neglected [9-10]. The analysis of 14 recordings showed that the deformation from the impact of the locomotive VL-80c at passing on the span structure with speeds up to 70 km/h, differ slightly from each other in the weighted average, and almost equal deformations produced during the static test. The greatest deformation was observed at passing of freight trains and the deformation from the effects loaded gondolas in 1.5-1.6 times higher than deformation from the impact of electrics. The calculated values of monitored parameters, such as voltage in the main beams in the middle of the span can be defined as an engineering methods and using specialized calculated software system that implement finite element methods (MIDASCivil, CosmosM).
4. Results and discussion
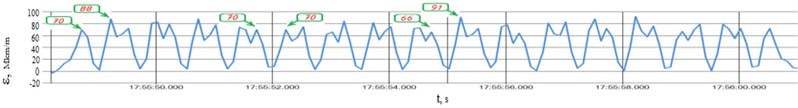
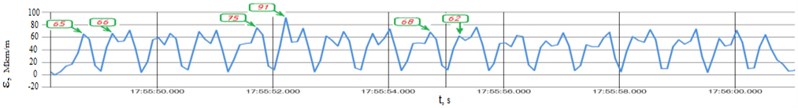
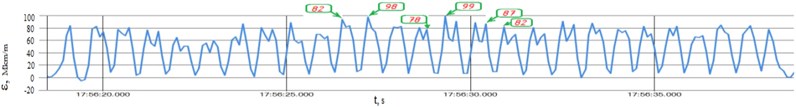
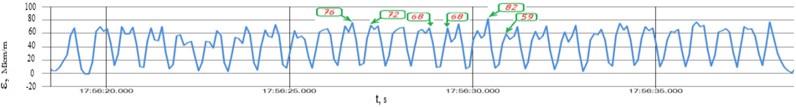
Fig. 5 shows complete recording of flexural deformation diagrams at passing “assembly” and in Fig. 6, Fig. 9, respectively, fragments of the same composition, marked with Roman numerals.
Fig. 5Diagram of bending deformations at passing assembly of freight train (2-section electrics VL-80c + KZ-8A, low sided cars, tank, platform, etc.): a) on the first centre rib of girder No. 1, b) on the second centre rib of girder No. 2
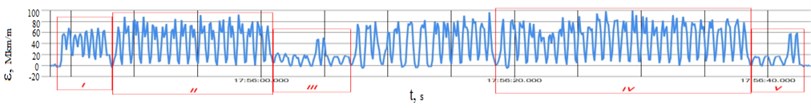
a)
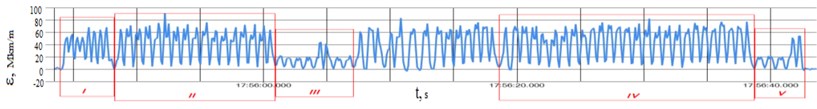
b)
Fig. 5 shows that the deformation of the impact loaded low sided cars (Fragment IV) to 1.5-1.6 times the deformation from the impact of locomotive (fragment I). This fact is explained, first of all, we differ bases locomotive carts and wagons and, as a consequence of the influence of different loads on the structure [11].
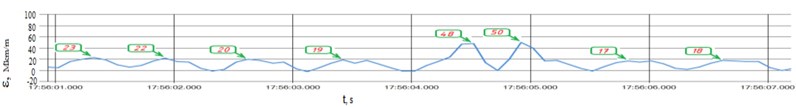
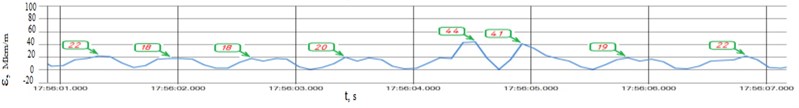
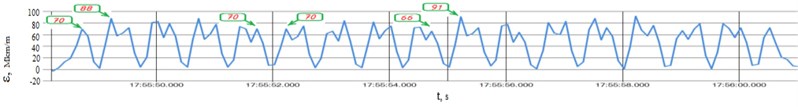
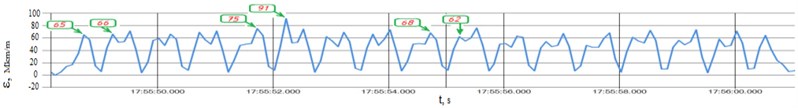
Fig. 6Diagram of bending deformations at passing of freight train (Fragment I – 2-section electrics VL-80c + KZ-8A): a) on the first centre rib of girder No. 1, b) on the second centre rib of girder No. 2
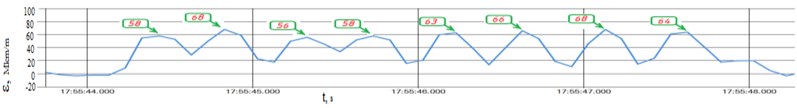
a)
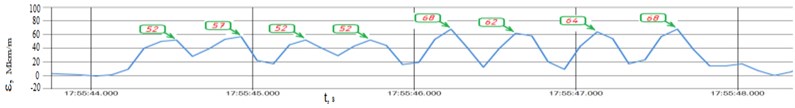
b)
Fig. 7Diagram of bending deformations at passing of freight train (Fragment II – loaded gondola car): a) on the first centre rib of girder No. 1, b) on the second centre rib of girder No. 2
a)
b)
Fig. 8Diagram of bending deformations at passing of freight train (Fragment III – tank and platform): a) on the first centre rib of girder No. 1, b) on the second centre rib of girder No. 2
a)
b)
The difference between the load on the axle locomotives KZ-8A (25 tf) and VL-80c (24 tf) is 4 %, and the difference between the deformation caused by the impact force data locomotive reaches 16-20 % (Fig. 6-fragment I in Fig. 6. This fact is also explained with the difference of distances between the axles of wheel pairs (base) four wheel track for electric bogie KZ-8A this distance is equal to 2.6 m, and for bogie BL 80c-3.0 m.
Fig. 9Diagram of bending deformations at passing of freight train (Fragment IV – loaded gondola cars in the middle of the train): a) on the first centre rib of girder No. 1, b) on the second centre rib of girder No. 2
a)
b)
Fig. 10Diagram of bending deformations at passing of freight train (A fragment V – empty gondola + last loaded): a) on the first centre rib of girder No. 1, b) on the second centre rib of girder No. 2
a)
b)
Table 2Results of measurements of deformation from effects of circulating rolling stock.
No. | Rolling load | Measured maximal bending deformation, mkm/m |
1 | 2-section electrics VL-80c | 32 |
2 | 2-section electric KZ-8A | 39 |
3 | 2-section electrics VL-80c + freight train (loaded gondola) | 42 |
4 | 2-section electric locomotive VL-80c + collecting freight train (gondola cars, tank, platform) | 46 |
5 | Electrics KZ-4AS + 23 railroad car (Talgo) | 29 |
6 | Electric KZ-4AS + 5 railroad cars | 33 |
7 | Electric train (5 railroad cars) | 34 |
8 | Rail car DHKU | 21 |
9 | Costruction train (2-section electrics VL-80c + 3 + roadway machines+railroad car) | 40 |
10 | 2-section electrics VL-80c + freight train (loaded gondola) | 67 |
11 | 2-section electrics VL-80c + collecting freight train (gondola cars, tank, platform) | 60 |
The advantage of using finite element models is the ability to simulate various faults in construction, adapting the calculation results to the actual conditions. The deviation of the true stress from the calculated values can be judged on the degree of structural damage to the span of the bridge.
In order to determine the change in the stress-strain state of the structure from the impact of climatic factors (alternate freezing and thawing) and operating rolling stock, there are means of protection installed on the construction of strain gages against external environmental effects in the laboratory (see Fig. 11).
Fig. 11The dependence of the limit period of pumping support from the length of span and weight of the span
5. Conclusions
For the most effective estimation of the dynamic response of the structure and the establishment of the correspondence between analytical model and the actual construction work, it is necessary to implement periodic monitoring of the stress-strain state of structures under operating loads. In addition, for each group of similar structures is recommended to compose a special program of diagnosis with the use of automated measuring systems.
Conducting periodic monitoring in the long term will allow:
1) To provide the safety of railway transport infrastructure in accordance with the requirements of technical regulations of the Customs Union TRCU 001/2011, 002/2011 and 003/2011;
2) To substantiate the possibility of increasing the speed of movement of rolling stock and load up to 27 t/axis on the busiest lines;
3) Increase the operating time and reduce the costs of current maintenance of way and constructional works;
4) Take the optimal constructive solutions by projecting and reconstruction of the way and constructional works.
References
-
Bondar N. G., Yu Kozmin G., Roitburd Z. G., Tarasenko V. P., Yakovlev G. N., Bondar N. G. Interaction of railway bridges with rolling stock. Transport, 1984, p. 272-284.
-
Parducci A. Application of seismic isolation and passive energy dissipation to Italian bridges, Isolation, energy dissipation and control of vibrations of structures. Proceedings of the International Post-SMiRT Conference Seminar Capri, Napoli, 1993, p. 57-69.
-
Skiner R. I., Robinon W. H., Mcverry G. H. An Introduction to Seismic Isolation. John Wiley and Sons, New Zealand, 1993, p. 353-362.
-
Zaslavsky Y., Shapira A., Kenigsberg M. Earthquake site response study for designed bridges in Israel. Proceedings of the 12th European Conference on Earthquake Engineering, 2002, p. 50-59.
-
Musayev J., Zhauyt A. Analysis of disturbing influence of traffic load on soil body. Advances in Materials Science and Engineering, 2015, https://doi.org/10.1155/2015/318289.
-
Kelly J. M. Earthquake Resistant Design with Rubber. Springer, 1997, p. 243-250.
-
Musayev J., Zhauyt A. Studying of soil surface subsidence upon long length underground pipelines penetration. International Journal for Science, Technics and Innovations for the Industry MTM, Vol. 9, 2015, p. 37-42.
-
Jonson Epstein G. R. H. R. Short duration analytic earthquake. Proceedings of the ASCE, Vol. 102, 1976, p. 993-1001.
-
Gomez R., Munoz D., Escobar J. A., Garcia M., Calderon A. Seismic evaluation of a truss bridge with energy isolation devices. Proceedings of 12th European Conference on Earthquake Engineering, 2002, p. 69-75.
-
Iemura Hirokazu, Iwata Shuji, Murata Kiyomitsu, Inaguma Hiroshi Seismic isolation of railway structures in Japan and strong earthquake response simulator test. Proceedings of 12th European Conference on Earthquake Engineering, 2002, p. 563-569.
-
Zhgutova T. V., Khaibin V. To the problems of usage two spans for damping seismic derivation of bridge arms, antiseismic construction. Structure Safety, Vol. 2, 2011, p. 64-68.
-
Zhgutova T. V. The results of the study of seismic isolation of railway bridges, natural and technology related risks. Structure Safety, Vol. 4, 2014, p. 19-22.
-
Kvashnin Ya M., Zhangabylova A. M., Zamukhovsky A. V. Influence of the type of fasteners to the dynamic work of the road. Transport World, Vol. 3, 2015, p. 72-76.
About this article

