Abstract
In order to evaluate the reliability of the main shaft unit of a friction hoisting system, strain measurement is a significant method. In this paper, a test rig of a friction hoisting system was built, which could applied periodically changing load on its main shaft unit; The mechanical analysis under the test load was conducted and the boundary limits were obtained; A three dimensional model of the main shaft unit was built in Pro-E and its finite element analysis was performed in ANSYS; With the analytical result, measuring points for strain rosettes were initially selected; Vibration modal shapes of the main shaft unit were analyzed, based on which Modal Assurance Criterion (MAC) was utilized in the Particle Swarm Optimization (PSO) algorithm to make the final decision of the number and positions of the measuring points; A wireless measurement system was developed to acquire strain signals from the optimized measuring positions; The test result verified the efficiency of the methods employed in this paper and revealed how strain of the main shaft unit changes during running process.
1. Introduction
Multi-rope friction hoists are widely used in coal mines. It’s of great significance to ensure that they work in a continuous and reliable condition. Hence, a lot of research on the examination of the performance of these hoists have been carried out. Topics like brake performance, hoisting load, vibration of bearing and gears attract a great deal of research enthusiasm [1]. Relatively speaking, not so much study has been put on the stress or strain of the mail shaft unit, which includes drum, shaft and wheel spoke. However, with the development of computer science and the emergence of powerful analytical software, relevant research has been growing fast.
The main shaft unit is a crucial component for a friction hoist to transfer power and bear load. Its dynamical behavior is related to the healthy status of a hoist. As an indirect way, vibration analysis is usually used to investigate shaft bend, imbalance, component loosing, and bearing defect. When it comes to the stress or potential problems related to strength or rigidity, the direct way, strain measurement works better. Strain of the main shaft unit is caused by the torque acted upon the joint between shaft and motor as well as the pressure from steel wire ropes. Change of hoisting load can be easily tracked based on the analysis on the strain of main shaft unit.
There have been some fruitful research on the strain or stress of main shaft unit: Jing Li [2] performed a stress analysis under different operating conditions which include steady hoisting, left drum start, left drum stop, right drum start and right drum stop, and simulated the stress-strain field numerically for the first three conditions. Ying Wang [3] and Junhong You [4] utilized ANSYS to analyze the deformation regularity, deflection change and stress concentration, and verified the position of the maximum stress, regularity of deflection change and regularity of stress wave. Li [5] constructed a finite element model for a cast head sheave and analyzed the stress distribution of a wheel spoke and flange. Wolny [6] investigated stress distribution of cylindrical shell and wheel spoke and analyzed the most dangerous stress points.
Among current relevant research, theoretical analysis and finite element simulation take up a large proportion. Because of many influence factors, obvious deviation still exists between the simulation result and the practice. Furthermore, lack of optimization for strain measuring points makes it difficult to achieve the best testing effect with limited measurement resources.
On the basis of current research achievement and aiming at their inadequacy, this paper involves stress and strain simulation, measurement point optimization, and construction of an actual measurement system, which will largely benefit the reliability of the main shaft unit.
2. Test rig
In order not to affect regular coal production, a test rig shown as Fig. 1was constructed, which was an equivalent transformation from actual hoisting systems. Its components include hydraulic brake station, main shaft unit, brake, steel wire ropes, sheave frame, sheave groups, balance cylinders, operating desk, adjusting screws and ground bolt.
Fig. 1Design of test rig: 1 – operation desk, 2 – sydraulic brake station, 3 – main shaft unit, 4 –brake, 5 – Foundation bolt, 6 – steel wire ropes, 7 – sheave frame, 8 – sheave groups, 9 – balance cylinder, 10 – adjusting screw
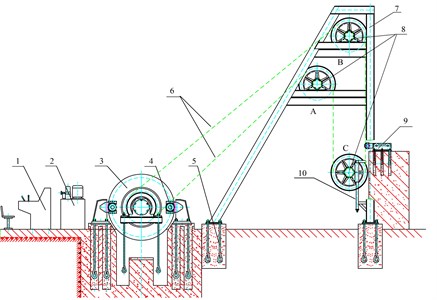
Fig. 2Structure of main shaft unit of the test rig: 1 – main shaft, 2 – hollow cover, 3 – bearing block, 4 – self-aligning roller bearing, 5 – friction drum, 6 – friction liner, 7 – lock block, 8 – brake disc
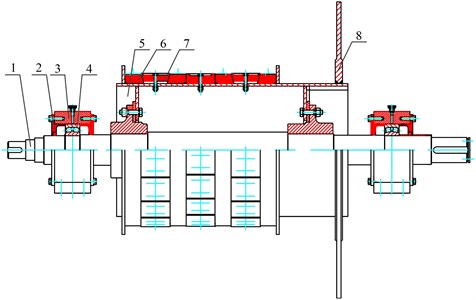
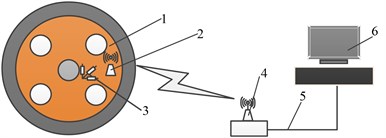
The main shaft unit is the research object of this paper. It’s mainly made up of a main shaft, supporting bearings, a friction drum and friction liners. The detailed structure of the main shaft unit is shown as Fig. 2. Because the main shaft unit is a rotating assembly, collection of its strain signals is inconvenient as usual and cannot be conducted through traditional ways. Generally, collector ring and wireless communication are typical ways to deal with this issue. Collector ring is more traditional than wireless communication. It has some defects. For example, the accuracy is sometimes severely affected by the virtual strain caused by collector ring or breakpoints between copper ring and wire. Hence, according to the principle of measurement accuracy, reliable installation, convenient dismounting and no destruction to original structure and performance, wireless communication was finally utilized to acquire the stress signals of friction drum and main shaft unit. Fig. 3 shows the principle of the wireless signal acquiring system developed in this paper. Strain rosettes were pasted at relevant positions inside the friction drum and on the main shaft to realize stress measurement [7-9]. Strain signals were transmitted by the wireless signal collector, then received by the wireless receiver, and finally reached the industrial PC through network cables.
Fig. 3Strain testing system of main shaft device: 1 – main shaft unit, 2 – wireless signal collector, 3 – strain rosette, 4 – wireless receiver, 5 – network cable, 6 – industrial PC
Quantity and positions of the strain rosettes determine both the cost and the effect of strain measurement, so there is great necessity and significance in optimization of the quantity and positions of measuring points. An ideal optimization should achieve the balance between measurement cost and effect. Proper arrangement of measuring points facilitates the detection of impact of each modal shape on stress of the main shaft unit, and in the meantime, current measurement resource such as signal sampling channels should be fully utilized.
3. Optimization of strain measuring points
3.1. Optimizing scheme
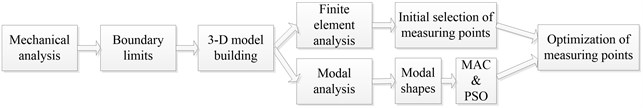
How to use the limited measurement resource to achieve an ideal measurement as accurate as possible? It’s necessary to make an optimization of strain measuring points. According to different measurement demands, current frequently used optimizing methods include ordination, nonlinear programming, random cluster and reckoning. Based on the actual conditions of the main shaft unit, the following scheme shown as Fig. 4 was adopted [10]: a mechanical model was first constructed with analytical method to get the boundary limits, then a three dimensional model built in Pro-E was imported into ANSYS to perform a stress simulation for the initial selection of measuring points. Modal shapes were obtained with modal analysis, and finally with the max nondiagonal element as the fitness value, an optimizing algorithm based on MAC and PSO was designed.
Fig. 4Optimization flowchart of measuring points
3.2. Mechanical analysis
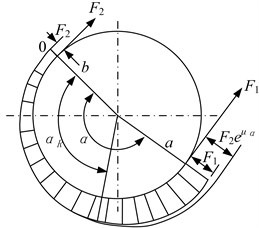
The test rig uses a floor standing friction drum. The segment of ropes that winds round the drum has two ends, one is tight and the other one is loose. As shown in Fig. 5, tensions at the two ends are and . The rope arc round the drum is divided into static arc and slip arc. The central angle of slip arc is , and the rest part is static arc whose central angle is -. The friction force transferred by the drum is:
where is the friction coefficient between the ropes and the drum, and is the Napierian base.
In static arc, the drum is under both a tangential and a radial force while there is only radical force in slip arc. The tangential and radial force at central angle on the drum is:
where is the dimeter of the drum, and is the contact width between drum and liners.
Fig. 5Tension analysis of friction drum
Main parameters of the test rig are listed in Table 1.
Table 1Main parameters of main shaft
Diameter of the drum (mm) | 800 | Max tension of ropes (kN) | 15 |
Diameter of head sheave (mm) | 800 | Max hoisting velocity (m/s) | 1.65 |
Surrounding angle (°) | 180 | Diameter of rope (mm) | 12 |
Quantity of ropes | 4 | Space between ropes (mm) | 250 |
Friction coefficient of the liner | 0.25 | Width of liner (mm) | 94 |
When the tension at tight end is increased to the maximum value which is 15 kN here, all the surrounding arc becomes slip arc, and the tension at loose end is 6.8 kN. With Eq. (2) and Eq. (3), the tangential and radial force on the drum can be calculated:
3.3. Finite element analysis
With the above boundary load, finite element analysis on the main shaft unit was performed [11, 12]. The main shaft is actually an assembly of many parts, but regarded as a solid during the finite element analysis. The first step of this analysis was to build a three dimensional model in Pro-E, which was saved in the file format of “parasolid” and then imported into ANSYS.
The next step was model meshing. The quantity of mesh quantity affects both precision and efficiency of simulation. Algebraic generation method was adopt in this paper. More detailed meshing was performed where needed, such as the places near screwed holes. In this case, the total numbers of the units and nodes were 67275 and 271923, respectively.
When the load was applied on the model of the main shaft unit, its stress contour was obtained, as shown in Fig. 6. From this contour, it can be found that the max stress point is near the joint between the bearing support and the motor. The maximum stress is 91.41 MPa, much lower than the yield limit of the material 45 Mn, 375 MPa.
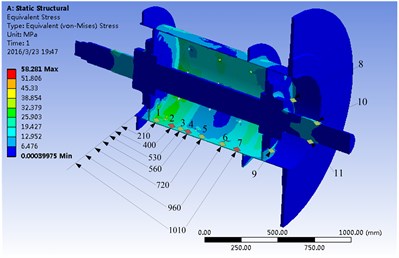
Then primary selection of measuring points could be made, on which pasting convenience should be taken into account. Inner wall, wheel spoke and the shaft segment near the brake disk were chosen as measurement positions, and the exact measuring points initially selected are shown as Fig. 7.
Fig. 6Stress contour of the main shaft unit
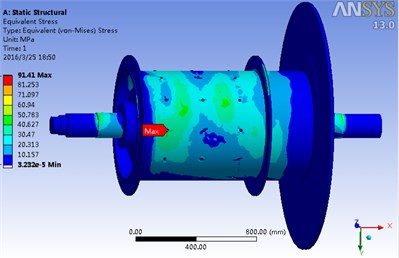
Fig. 7Primary selected measuring points of the main shaft unit
3.4. Optimization of measuring points
Optimization criterion affects the result significantly. Effective Independent Evaluation Criterion (EI) and Modal Assurance Criterion (MAC) [13-15] are frequently adopted. In consideration of searching efficiency, MAC was employed in this paper.
Ideal modal shapes are linearly independent one another, but various noise decreases their orthogonality obviously. Fortunately, when proper quantity and position of test points are achieved, spatial angle between modal shapes can be kept large enough. Array of MAC reflects the spatial angle and is a significant index for the evaluation of the correlation among modal vectors. An element of MAC array is calculated by:
where and are the modal vectors of order and . Elements of MAC array are between 0 and 1. The bigger an element is, the smaller the spatial angle is, and the element of value 0 means no correlation while 1 means complete correlation. Furthermore, the smaller the nondiagonal elements are, the more appropriate the placement of measuring points is.
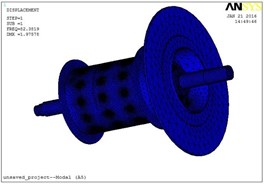
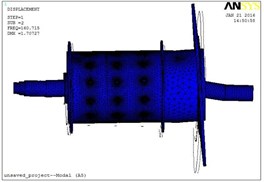
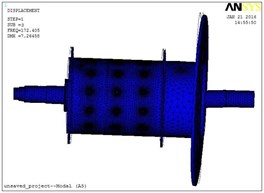
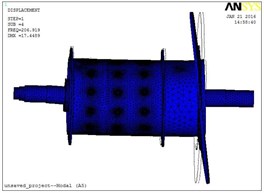
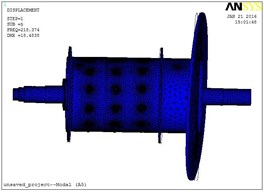
A modal analysis [17-19]of the finite model of the main shaft unit was made with fixed constrains applied on the places of two bearing and the solving order set as 8. The first 8 natural frequencies and shapes are listed in Table 2 and shown as Fig. 8.
Table 2First 8 natural frequencies and modes of the main shaft unit
Order | Frequency (Hz) | Modal shape | Order | Frequency (Hz) | Modal shape |
1 | 82.382 | Axial twist | 5 | 218.37 | Horizontal swing |
2 | 160.72 | Horizontal swing | 6 | 381.54 | Horizontal swing |
3 | 172.40 | Vertical swing | 7 | 415.53 | Horizontal swing |
4 | 206.92 | Vertical swing | 8 | 596.52 | In-out swing |
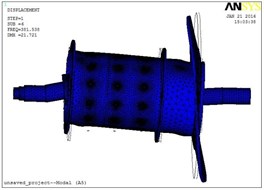
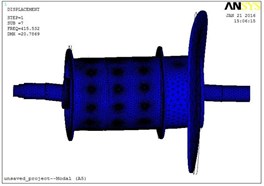
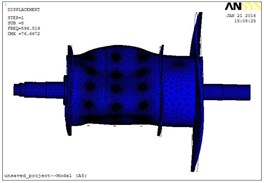
Fig. 8Modal shapes of the first 8 orders: a) modal shape of order 1, b) modal shape of order 2, c) modal shape of order 3, d) modal shape of order 4, e) modal shape of order 5, f) modal shape of order 6, g) modal shape of order 7, h) modal shape of order 8
a)
b)
c)
d)
e)
f)
g)
h)
As listed in Table 2, natural frequency of the first order is 78.27 Hz, its modal shape is axial twist; The second natural frequency is 84.431 Hz, with a modal shape of horizontal swing; The third 137 Hz, vertical swing; the forth 142.16 Hz, vertical swing. For the following order, besides modal shapes listed in Table 2, some other modal shapes still exist. As shown in Fig. 8, the modal shape of the eighth order is an in-out swing which looks like shrinkage and expansion of the drum. According to this simulation result, total displacement modes of the initially selected test points are listed in Table 3.
Particle Swarm Optimization Algorithm (PSO) [20-23] was adopted in this optimization. PSO is an optimization method based on population search, which generates an optimal group from the original group iteratively. During this iterative process, quality of each new group should be evaluated. In this case, the max nondiagonal element of MAC array was taken as the fitness function. Smaller value of it means a better selection of test points. Other parameters of PSO algorithm are listed in Table 4.
Table 3The total displacement modes of the first 8 orders of the main shaft unit
Point | node | Order 1 | Order 2 | Order 3 | Order 4 | Order 5 | Order 6 | Order 7 | Order 8 |
1 | 31940 | 0.73439 | 0.32729 | 1.5775 | 2.7681 | 3.2046 | 12.458 | 14.332 | 5.0548 |
2 | 27686 | 0.74983 | 0.43857 | 1.6431 | 2.6166 | 3.4020 | 10.344 | 12.225 | 18.169 |
3 | 31524 | 0.75870 | 0.47936 | 2.0219 | 3.0296 | 3.8115 | 9.6790 | 11.280 | 31.561 |
4 | 24175 | 0.78236 | 0.59605 | 2.2730 | 3.0824 | 4.0255 | 7.8273 | 9.5641 | 45.881 |
5 | 31112 | 0.79270 | 0.64811 | 2.5935 | 3.1522 | 4.2552 | 5.3127 | 6.9241 | 42.316 |
6 | 20599 | 0.81233 | 0.73478 | 2.8316 | 3.0108 | 3.9726 | 4.5318 | 5.3775 | 34.613 |
7 | 25736 | 0.74003 | 0.38603 | 1.5796 | 2.6556 | 2.7942 | 11.272 | 11.471 | 1.528 |
8 | 33581 | 0.70657 | 0.85140 | 3.3179 | 2.4766 | 3.1995 | 3.4086 | 3.9959 | 1.5698 |
9 | 33614 | 0.71539 | 0.87200 | 3.2071 | 1.9619 | 3.8306 | 2.6603 | 4.7686 | 2.4925 |
10 | 42309 | 0.10936 | 0.47163 | 1.8838 | 0.84462 | 1.0674 | 2.4477 | 3.5743 | 0.84205 |
11 | 47892 | 0.07846 | 0.29146 | 1.4917 | 0.41090 | 0.88916 | 1.8792 | 2.7359 | 0.76842 |
Table 4Parameters of PSO algorithm
Swarm scale | Swarm range | Velocity range | Swarm dimensionality | Acceleration constant | Inertia weight | Iteration number |
20 | [1, 165] | [–0.5, 0.5] | 8 | 2 | 0.927 | 40 |
Final optimization result was listed in Table 5.
Table 5Test point optimization
Number of points | Fitness value | Point combination | Number of points | Fitness value | Point combination |
2 | 0.171 | 6, 9 | 7 | 0.1559 | 1, 6, 7, 8, 9, 10, 11 |
3 | 0.154 | 6, 9, 10 | 8 | 0.2096 | 1, 5, 6, 7, 8, 9, 10, 11 |
4 | 0.151 | 6, 9, 10, 11 | 9 | 0.2828 | 1, 2, 5, 6, 7, 8, 9, 10, 11 |
5 | 0.151 | 1, 6, 9, 10, 11 | 10 | 0.3642 | 1, 2, 4, 5, 6, 7, 8, 9, 10, 11 |
6 | 0.1518 | 1, 6, 8, 9, 10, 11 | 11 | 0.4409 | 1-11 |
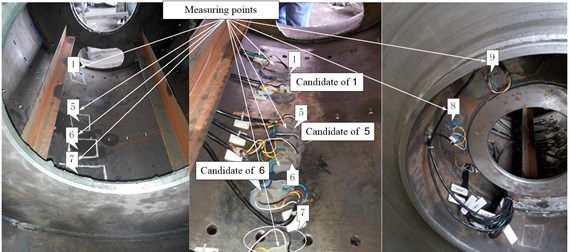
When the fitness value is smaller than 0.25, modes are easily identified, and the point combination is better. As shown in Table 5, for number of points less than 9, the fitness value is smaller than 0.25, and the value for number 9 is 0.2828, which is fairly close to 0.25. In consideration of the available resource of the test channels, points 1, 5, 6, 7, 8, 9, 10 and 11 were chosen as the final measurement positions, among which the first six positions are marked in Fig. 9.
Fig. 9Optimized positions for strain rosettes
4. Result
After strain rosettes were pasted, the wireless measurement system was built, and signals of strain were acquired. For the strain of the ninth point, strain signal was shown as Fig. 10, which contain strain of circumferencial direction and the direction of 45°. This signal was generated during a process which contained the start, running and stop operation of the test rig. It can be found that circumferencial strain of the wheel spoke fluctuates periodically within a range from –50 με to 100 με, which is not very intense; and at the stop moment, an obvious impact happens. For the other measuring positions, there are similar phenomenon.
Fig. 10Strain of the ninth measuring point
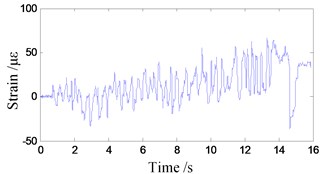
a) Circumferencial strain
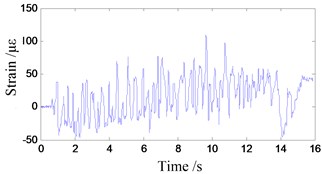
b) Strain along direction 45°
5. Conclusions
Strain change of the main shaft unit during running is a key parameter to evaluate the performance of a friction hoisting system. In this paper, a test rig was built, with which a wireless measurement system was constructed to investigate the strain change. In order to make a right decision of the measuring points, mechanical analysis of the drum which is the main part of a main shaft unit was achieved, and the boundary limit was obtained. After a three dimensional model was built in Pro-E, finite element analysis of the main shaft unit was conducted in ANSYS. According to the analytical result, measuring points were initially selected. Vibration modal shapes of the main shaft unit were analyzed, based on which MAC was utilized in the Particle Swarm Optimization (PSO) algorithm to make the final decision of the number and positions of the measuring points. Through the above investigation, the following conclusion can be made:
1) The wireless strain measurement system works efficiently to acquire strain signals from the main shaft unit of a friction hoisting system, which would be a scientific basis for design improvement or adjustment of hoisting load.
2) When the MAC criterion based on vibration modal shapes is utilized, PSO algorithm is capable of conducting an ideal optimization for the number and position of measuring points.
3) Strain of the main shaft assembly of a friction hoist fluctuates periodically during running process and has always an impact at the stop moment.
References
-
Khan M., Krige G. Evaluation of the structural integrity of aging mine shafts. Engineering Structures, Vol. 24, 2002, p. 901-907.
-
Li J. Experimental Research and Dynamical Simulation of Friction Hoist. Doctoral Thesis, Henan University of Science and Technology, 2014.
-
Wang Y., Zhu Z., Chen G., Li W., Wang Z. Sheave wheel stress wireless monitoring system research of mine hoist. 2nd IEEE International Conference on Advanced Computer Control, Shenyang, China, 2010, p. 535-539.
-
You J. Study on the Frition Drum of a Mine Hoist Based on ANSYS. Doctoral Thesis, Xi’an University of Science and Technology, 2006.
-
Li Y., Zhu Z., Wang Y., Wang X. Simulation of stress field of hoist sheave wheel and experimental validation. 3rd IEEE International Conference on Computer Science and Information Technology, Chengdu, China, 2010, p. 1-4.
-
Wolny S., Badura S. Stress analysis in structural components of the koepe pulley in hoisting installations. Engineering Transactions, Vol. 60, 2012, p. 155-170.
-
Bao X., Demerchant M., Brown A., Bremner T. Tensile and compressive strain measurement in the lab and field with the distributed brillouin scattering sensor. Journal of Lightwave Technology, Vol. 19, Issue 11, 2001, p. 1698-1704.
-
Wang D., Wang H., Liang Z., Tang S., Li Y. Study of eliminating calculation errors in large-strain measurement with strain gauges. Applied Mechanics and Materials, Vol. 138, Issue 139, 2012, p. 548-552.
-
Moore A., Lucas M., Tyrer J. Electronic speckle pattern interferometer for two-dimensional strain measurement. Measurement Science and Technology, Vol. 7, Issue 12, 1996, p. 1740-1747.
-
Chan T., Guo L., Li Z. Finite element modeling for fatigue stress analysis of large suspension bridges. Journal of Sound and Vibration, Vol. 261, Issue 3, 2003, p. 443-464.
-
Wang Y., Zhou Z., Gao H. Analysis on the stress and deformation of deep excavation simulated by multiplying ANSYS and ABAQUS. Advanced Materials Research, Vol. 317, Issue 319, 2011, p. 1729-1732.
-
Gao D., Zhang J. Finite element analysis of shear behaviors for steel fiber reinforced concrete corbels by ANSYS. International Conference on Computer Modeling and Simulation, Vol. 4, 2010, p. 303-307.
-
Yuan A., Dai H., Sun D. Optimal sensor placement of cable-stayed bridge using mixed algorithm based on effective independence and modal assurance criterion methods. Journal of Vibration, Measurement and Diagnosis, Vol. 29, Issue 1, 2009, p. 55-59.
-
He C., Xing J., Li J., Yang Q., Wang R., Zhang X. A new optimal sensor placement strategy based on modified modal assurance criterion and improved adaptive genetic algorithm for structural health monitoring. Mathematical Problems in Engineering, Vol. 2015, 2015, p. 1-10.
-
Heylen W., Janter T. Applications of the modal assurance criterion in dynamic model updating. American Society of Mechanical Engineers, Design Engineering Division (Publication) DE, Vol. 18, Issue 4, 1989, p. 289-294.
-
Ting T., Chen T., Twomoy W. Correlating mode shapes based on modal assurance criterion. Finite Elements in Analysis and Design, Vol. 14, Issue 4, 1993, p. 353-360.
-
Xu C., Jia S., Tu J., Du G. Experimental study on damage identification of pipeline based on operational strain modal shape. Journal of Southwest Jiaotong University, Vol. 48, Issue 6, 2013, p. 1031-1037.
-
Ren W. X., Jaishi B. Modal difference for vibration mode shape expansion. International Journal of Structural Stability and Dynamics, Vol. 9, Issue 4, 2009, p. 765-775.
-
Wang L., Chen H., He X. Study on modal shape of the vibration of an axially moving cantilever beam with tip mass. Advanced Materials Research, Vol. 211, Issue 212, 2011, p. 200-204.
-
Liu Y., Zhao Q., Niu B. Adaptive multi-objective particle swarm optimizer based on epsilon dominance. Control and Decision, Vol. 26, Issue 1, 2011, p. 89-95.
-
Wu C., Wu Yh, Ma C., Wang C. Optimization design of gear rrain based on particle swarm optimization algorithm. Applied Mechanics and Materials, Vol. 373, Issue 375, 2013, p. 1072-1075.
-
Gao S., Zhang Z., Cao C. Multiplicate particle swarm optimization algorithm. Journal of Computers, Vol. 5, Issue 1, 2010, p. 150-157.
-
Jia S., Yang C., Tian Y., Liu C., Lan Y. Particle swarm optimization algorithm with chaotic mapping model. Open Cybernetics and Systemics Journal, Vol. 8, 2014, p. 1252-1256.
-
Maruyoshi K., Saijo O. Added mass depending on vibration modal shape in floating artificial base. Proceedings of the International Conference on Offshore Mechanics and Arctic Engineering – OMAE, Vol. 3, 2004, p. 319-324.
-
Hou S., Li Q., Long S., Yang X., Li W. Design optimization of regular hexagonal thin-walled columns with crashworthiness criteria. Finite Elements in Analysis and Design, Vol. 43, 2007, p. 555-565.
-
Ding Y., Shi B., Zhang D. Data processing in BOTDR distributed strain measurement based on pattern recognition. Optik, Vol. 121, Issue 24, 2010, p. 2234-2239.
Cited by
About this article

This work was supported by National Natural Science Foundation of China (Grant No. 51675520), the Fundamental Research Funds for the Central Universities (Grant No. 2014QNB19) and A Project Funded by the Priority Academic Program Development of Jiangsu Higher Education Institutions. Doctor Yansong Ma provided much help on the construction of the wireless strain measurement system, which has contributed a lot to this paper. Sincere appreciation is extended to him, and also to the reviewers of this paper for their helpful comments.
Chi Ma who is the organizer of this whole research and analyzed the dynamical behavior of the main shaft assembly; Lulu Zhang’s job was to collect reference materials of this topic and did the fundamental theoretical study; Congwang Bao designed and set up the test rig; Yuqiang Jiang processed the collected signals and the experimental data; Xingming Xiao, as the advisor of this research team, gave significant guidance during the research.
