Abstract
A rotor-stator rubbing position identification method based on casing velocity signal is proposed. Considering that velocity is an ideal parameter to reflect vibration, and its effective value is a standard to the measuring of vibration fault diagnosis in the world, firstly, the rotor experiment rig of aero-engine was used to simulate rubbing faults in different rubbing positions, and casing vibration acceleration signal was collected and changed to velocity signal through integral and polynomial least square fitting method. Secondly, low-frequency normalized energy characteristics of velocity signal and normalized mean-square value characteristics of acceleration signal were extracted; finally, normalized characteristic parameters including energy and mean-square value were input to nearest neighbor classifier and support vector machine(SVM) to identify the different rubbing positions. The results show that low-frequency energy characteristics of velocity signal can effectively identify the rotor-stator rubbing positions of aero-engine, and reach to 93 % of recognition rate based on nearest neighbor classification method and 98 % based on SVM, while mean-square value characteristics of acceleration signal recognition rate can only reach 81 % based on nearest neighbor algorithm and 85 % based on SVM.
1. Introduction
Rubbing is a kind of common and strong nonlinear fault of the aero-engine, which can not only seriously affect equipment service life, but also may easily cause tremendous economic loss and casualties [1]. Now, a great many of scholars at home and abroad have conducted a wide and deep research on rubbing faults and obtained favorable effect. But these researches mainly concentrate on judgment of equipment occurrence rubbing fault, whereas the research on rubbing position identification is less. There are representative researches about rubbing position identification, such as: Deng Ai-dong [2] et al., proposing a sub-gradient projection method to identify rubbing position based on energy attenuation model according to acoustic emission (AE) feature. Chu Fu-lei [3] et al., combined AE, wavelet packet and cross-correlation to detect rubbing location through comparing correlation coefficient. He Tian [4] et al., established near-field beam forming based on plate-wave theory, and realized the rotor-stator rubbing location. In order to reduce noise effect, Wang Q. [5] et al., decomposed AE signal to different frequency-sbands and combined cross-correlation function via implementing rubbing faults location. Chu F. [6] et al., judged the rubbing location based on a multi-disk rotor system through dynamic stiffness. Hanqk [7] et al., combined nonlinear output frequency response function and hybrid model of rotor system to identify rubbing position. Lu Wen-xiu [8] et al., constructed a finite element model of the rubbing rotor system, and used genetic algorithms optimization solution to develop the rubbing location. Yuan Shengfa [9] et al., took different shaft rubbing positions as different faults, and improved sphere support vector machine to identify different rotor-stator rubbing position. Sun Yunlin [10] et al., took stator vibration signal as vibration source, combined angle signal to locate rubbing position according to separated stator high frequency inherent vibration that envelops signal. Mingyue Yu [11] et al., utilized casing strain signal to identify rubbing position of aero-engine.
Velocity is an ideal parameter to reflect vibration for most equipment, and its effective value is a standard to the measuring of vibration faults diagnosis across the globe. But velocity sensor has larger volume, and can only be installed on fixed position through the specific installing seat in aero-engine vibration state monitoring, which causes the limitation of velocity sensor’s application to some extent. Acceleration sensor volume is smaller with light weight, and can be conveniently installed in different casing positions. But acceleration signal mean-square value does not have a definite physical meaning, and acceleration signal is more sensitive for high-frequency signal while common aero-engine real-time monitoring frequency is low, which is disadvantageous to fully take advantage of acceleration sensor. Generally, integral method is used to transform the acceleration signal to velocity signal in practice, where conversion will produce certain error and trend terms [12]. Method of least square by using polynomials can eliminate baseline shift of liner conditions and high order polynomial trend terms, which is the most common method to eliminate trend terms in engineering practice [12, 13]. Based on above analysis, firstly, the rotor experiment rig of aero-engine is used to simulate rubbing faults in different rubbing positions of turbine casing, and the casing vibration acceleration signal is collected; secondly, the acceleration signal is changed to velocity signal through integral method and the trend terms are eliminated through polynomial least square fitting method at the same time; thirdly, low-frequency normalized energy characteristics of velocity signal and norm-square value characteristics of acceleration signal are extracted and analyzed; finally, normalized characteristics parameters including energy and mean-square value are input into nearest neighbor classifier and SVM to identify the different rubbing positions, and the identification results are compared and analyzed.
2. Rubbing experiment
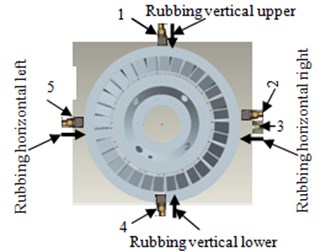
In this paper, all experiment data comes from the aero-engine rotor experiment rig, which is designed by the Shenyang Aero-engine Design Institute. The experiment rig core-engine is simplified to be 0-2-0 support structure, and the compressor is simplified to be single disk structure. In aero-engine, rubbing is mainly caused by rotor unbalance, casing deformation and bearing different cardiac etc. Rotor is hard to rebound by rubbing force as rotor is weighted while casing is usually light because thin case structure is applied, which leads to the rubbing types of aero-engine are mainly shown partial rubbing, while partial rubbing position has some differences due to casing deformation difference, direction difference of bearing different cardiac. Considering that rubbing position may be distributed on casing whole circumference, the paper sets 4 uniform distribution rubbing points: vertical upper, vertical lower, horizontal left and horizontal right of turbine casing. Different extents of single rubbing experiments could be embodied by adjusting rubbing screw against rubbing ring. The installation position of acceleration sensors always includes vertical upper, vertical lower, horizontal left and horizontal right of turbine casing. The displacement sensor is installed on the horizontal right of turbine casing, and next to acceleration sensor which is installed on horizontal right of turbine casing. All the rubbing experiments involved in the paper are based on the acceleration signal collected by the acceleration sensors Model 4508 which is provided by Demark Brüel&Kjær, and the rotating speed measured by SE series eddy current displacement sensors which is provided by instrument factory Southeast University. Data collector Model is USB9234 provided by National Instruments. The experiment is conducted under the condition of room temperature and rubbing intensity is medium. Experimental data is randomly selected from May 23th, 2014, and the rotational speed is about 1500 r/min. Diagrams of the rubbing experiments and sensors installed position are shown in Figs. 1-5. Fig. 1 is a diagram of aero-engine rotor experiment rig and acceleration sensors installed on vertical upper and horizontal right of turbine casing. Fig. 2 shows horizontal right acceleration and displacement sensors local amplification respectively. Fig. 3 shows acceleration sensors installed on horizontal left and vertical upper of turbine casing. Fig. 4 is a single-point rubbing experiment diagram. Fig. 5 shows rubbing and sensors installed position schematic diagram.
Fig. 1Rotor experiment rig of aero-engine and sensor installed position diagram
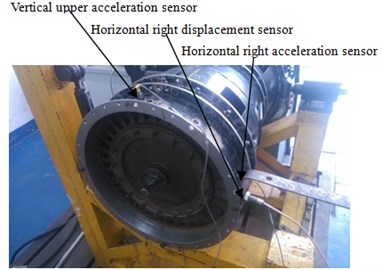
Fig. 2Installed horizontal right of turbine casing displacement sensor and acceleration sensor local amplification
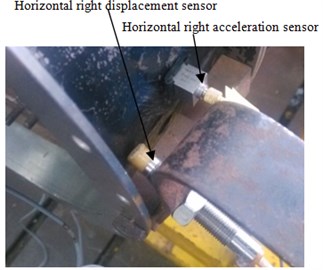
Fig. 3Sensor installed position diagram-acceleration sensor installed on vertical lower and horizontal left
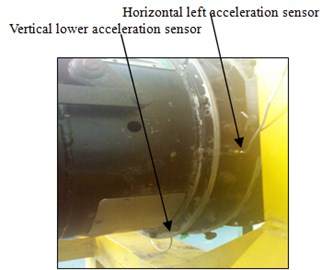
Fig. 4Turbine casing rubbing experiment: 1 – rubbing spark, 2 – adjusting rubbing screw against rubbing ring
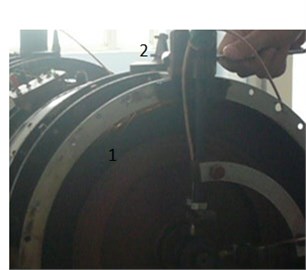
Fig. 5Sensors installed positions and rubbing position diagram: 1, 2, 4, 5 – vertical upper, horizontal right, vertical lower and horizontal left acceleration measurement point, 3 – horizontal right displacement measurement point
3. Displacement signal compared and analyzed between acceleration signal changed obtained and real measure obtained
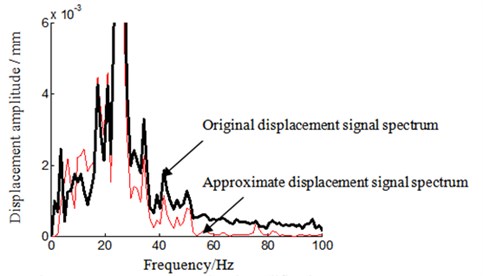
In order to verify the correctness of method of acceleration signal which is changed to displacement signal and velocity signal, in rubbing experiment of May 23th, 2014, the acceleration sensor and displacement sensor are installed near position on horizontal right of turbine casing at the same time (show on Fig. 1, Fig. 2 and Fig. 5), and vibration acceleration signal and displacement signal are collected at the same time. The integral and polynomial least square fitting method is introduced to complete change from acceleration signal to velocity signal and displacement signal. Displacement signal that acceleration signal changed obtained is need process are as follows: (1) acceleration signal is changed to velocity signal through integral method; (2) the polynomial least square fitting method is used to eliminate trend terms of velocity signal; (3) eliminated trend terms velocity signal is changed to displacement signal by integral method; (4) Finally, polynomial least square fitting method is used to eliminate trend terms of displacement signal. It can be found that polynomial-fitting orders selected between order 5 to 9 is more ideal to eliminate trend terms through multiple comparison and analysis for experimental data, and order 9 is selected as an example to analyze as it is more consistent in amplitude with real-measure obtained displacement signal (show on Fig. 7) in this paper. Time-domain and frequency-domain of displacement signal are analyzed and compared between acceleration signal changed obtained and real-measure obtained. The results are shown in Figs. 6-10. Fig. 6 and Fig. 7 respectively represent time-domain signal and its local amplification of displacement signal. Abscissa represents time in seconds, and ordinate represents displacement amplitude in millimeter in Figs. 6-7. Figs. 8-10 respectively represents frequency-domain signal and its local amplification of displacement signal. “○” represents displacement signal obtained through acceleration signal with the sensor installed on the horizontal right of turbine casing, and “–” represents real-time displacement signal by the displacement sensor which is installed on horizontal right of turbine casing in Figs. 8-10. Abscissa represents frequency and unit is Hz, and ordinate represents displacement amplitude and unit is millimeter in Figs. 8-10.
Fig. 6Time domain signal
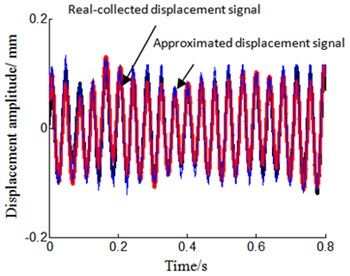
Fig. 7Time domain signal local amplification
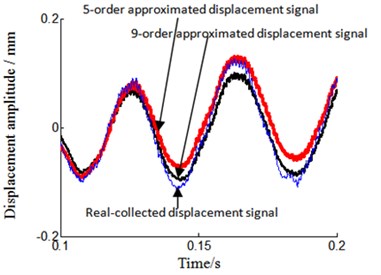
Fig. 8Frequency spectrum
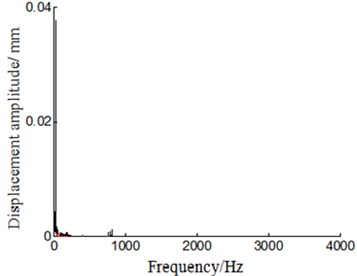
Fig. 9Frequency spectrum local amplification
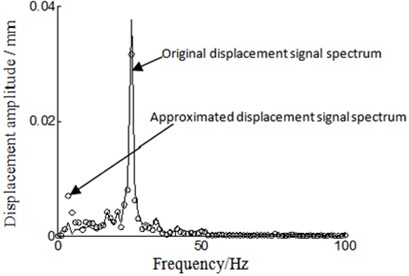
By analyzing the time-domain and frequency-domain of displacement signal from Figs. 6-10, we can find that there are some differences between displacement signal obtained through integral and polynomial least square fitting method and real-collected method. Main manifestation is that acceleration-signal-transform-obtained displacement signal amplitude is smaller and smoother than real-measure-collected one. While analyzing the reason, the real-measured displacement point is not fully in accordance with acceleration signal measurement point, which leads to the inconsistent amplitude, and noise signal is reduced during the process of integral and polynomial least square fitting, which leads to the smoother signal. For all that, the trend and amplitude of displacement signal is approaching what are represented in Figs. 6-7. By analyzing Figs. 8-10, we can also observe that displacement signal frequency spectrum is similar between acceleration-signal-transformed and real-measured. This has verified that integral and polynomial least square fitting method could implement and transform from acceleration signal to velocity signal and displacement signal for the rotor experiment rig of aero-engine.
Fig. 10Frequency spectrum local amplification 2
4. Rubbing characteristics extracted and position identification based on casing velocity signal
4.1. Rubbing characteristics are analyzed on different rubbing positions based on casing vibration signal
The rubbing characteristic is extracted and analyzed based on casing vibration acceleration signal and velocity signal which is obtained through integral and polynomial least square fitting method. Frequency characteristics are analyzed from 0 Hz to 200 Hz (including 0 Hz and 200 Hz), considering that aero-engine real-time monitoring frequency common is in low frequency. We still take the experimental data of May 23th, 2014 as an example to analyze (every selected sensor samples number is 100 in the condition of difference rubbing position), and concrete implement process are listed as following:
1) Data collected: vibration acceleration signal is collected and samples from installed on turbine casing difference position sensors in the conditions of different position rubbing experiment.
2) Signal transformation: acceleration signal is changed to velocity signal by using integral and polynomial least square fitting method, and the polynomial fitting orders is 9.
3) Low-frequency rubbing characteristic is extracted: The FFT transformation is operated between acceleration signal and velocity signal, and low-frequency mean-square values of acceleration signal and energy characteristic of velocity signal from 0 Hz to 200 Hz are extracted.
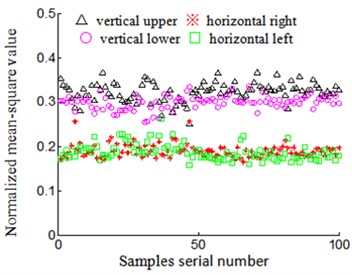
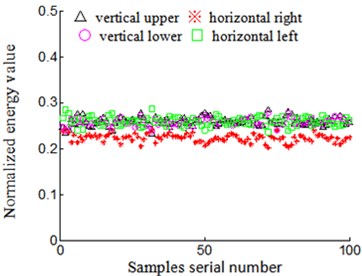
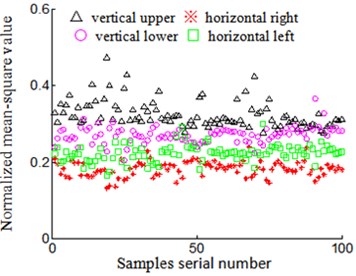
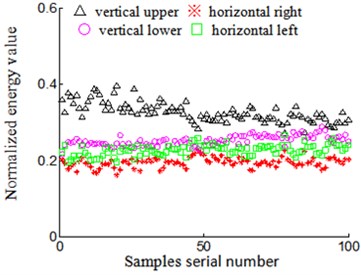
4) Rubbing characteristics normalized: low frequency rubbing characteristics extracted include mean-square value characteristics of acceleration signal and energy characteristics of velocity signal which are respectively divided by the sum of four-position sensors of low frequency mean-square value characteristics and energy characteristics, in order to implement normalized rubbing characteristic. The results shown in Figs. 11-14. “△”, “※”, “○”, “□” respectively represent low frequency normalized rubbing characteristic vectors including mean-square value characteristics of acceleration signal and energy characteristics of velocity signal, according to acceleration sensors installed on vertical upper, horizontal right, vertical lower and horizontal left of turbine casing in the stations of 4-difference-positions rubbing experiment in Figs. 11-14. Fig. 11 and Fig. 12 respectively represents rubbing position on vertical upper and horizontal right of turbine casing, Fig. 13 and Fig. 14 respectively represents rubbing position on vertical lower and horizontal left of turbine casing. Abscissa represents serial number of samples, and ordinate represents normalized low-frequency rubbing characteristic vector of every samples in Figs. 11-14. Figs. 11(a)-14(a) shows normalized mean-square value characteristics of acceleration signal, and Figs. 11(b)-14(b) represents normalized energy characteristics of velocity signal.
Fig. 11Rubbing positions on turbine case vertical upper
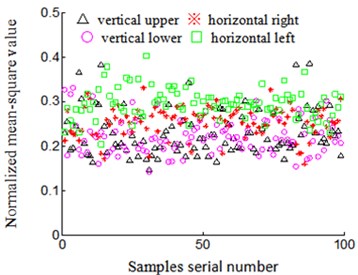
a) Accelerate signal normalized mean-square value
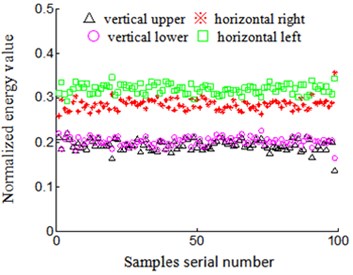
b) Velocity signal normalized energy value
Fig. 12Rubbing positions on turbine case horizontal right
a) Accelerate signal normalized mean-square value
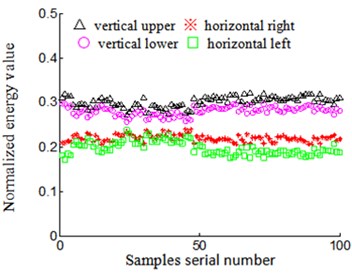
b) Velocity signal normalized energy value
Velocity signal low-frequency normalized energy characteristics are compared with the characteristics of acceleration signal low-frequency normalized mean-square value between Figs. 11(a)-14(a) and Figs. 11(b)-14(b). The main characteristics are listed as following:
(1) Same rubbing position: normalized characteristic vector central tendency of velocity signal is better than acceleration signal to be installed on same position sensor, while difference is bigger of velocity signal among sensors which are installed on different positions. Randomly taking rubbing position in vertical upper of turbine casing as an example to analyze:
1) Sensors installed on the same position Normalized low-frequency mean-square value of acceleration signal is shown in Fig. 11(a), the characteristic vector discrete is larger when it is installed on the same position sensor, for example, normalized characteristic vector of acceleration signal collected by acceleration sensor that is installed on vertical upper of turbine casing (denoted by “△” in Fig. 11(a)), the characteristics value is distributed between 0.1 and 0.4, and the discretion is bigger. Based on acceleration signal that is changed to velocity signal from sensors that are installed on same position Fig. 11(b), central tendency of the normalized low-frequency energy characteristic vector is better, and the characteristics discretion is near 0.2 (denoted by “△” in Fig. 11(b), and central tendency is excellent.
2) Sensors installed on different positions normalized characteristic vector of acceleration signal is collected by acceleration sensor that is installed on vertical upper and horizontal left of turbine casing (respectively denoted by “△” and “□” in Fig. 11(a)), the characteristics value is respectively distributed between 0.1-0.4 and 0.2-0.4, which leads to part overlapping of characteristic vector between each other among sensors of different installed positions and it is disadvantageous for rubbing position identification. Normalized characteristic vector of velocity signal transformational is obtained by acceleration sensor which is installed on vertical upper and horizontal left of turbine casing (respectively denoted by “△” and “□” in Fig. 11(b)), the distribution of the characteristics value is close to 0.2 and 0.3 respectively, which has less part overlapping of the characteristic vector between each other among installed on different positions sensors, and it is favorable for rubbing position identification.
Fig. 13Rubbing positions on turbine case vertical below
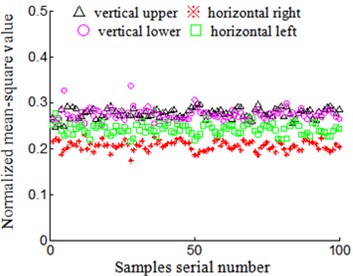
a) Accelerate signal normalized mean-square value
b) Velocity signal normalized energy value
Fig. 14Rubbing positions on turbine case horizontal left
a) Accelerate signal normalized mean-square value
b) Velocity signal normalized energy value
Characteristic vector of acceleration signal and velocity signal in other positions of casing possesses the same characteristics in the condition of the same rubbing position.
(2) Different rubbing positions: diversity of normalized characteristic vector is bigger of velocity signal when sensor is installed on same position in the condition of different rubbing positions. Randomly take rubbing position in vertical upper (Fig. 11) and horizontal right (Fig. 12) of turbine casing as examples to analyze:
1) Low-frequency normalized characteristic vector of acceleration signal. Signal characteristic vector that is collected while it is installed on vertical upper of acceleration sensor is distributed between 0.1 and 0.4 (denoted by “△” in Fig. 11(a)) in the condition of rubbing position that is on vertical upper of turbine casing, and signal characteristic vector that is collected when it is installed on vertical upper of acceleration sensor is distributed between 0.2 and 0.4 (denoted by “△” in Fig. 12(a)) in the condition of rubbing position that is on horizontal right of turbine casing. We can find that the rubbing characteristic has many overlapping for the same installed position sensor in the condition of different rubbing positions, and this feature is disadvantageous for the identification of rubbing position. Signal collected through acceleration sensor which is installed on another position has the same characteristics. For example, rubbing position on vertical upper of turbine casing, signal characteristic vector that is collected when it is installed on horizontal left of acceleration sensor is distributed between 0.2 and 0.4 (denoted by “□” in Fig. 11(a)), and rubbing position on horizontal right of turbine casing, signal characteristic vector that is collected when it is installed on horizontal left of acceleration sensor is distributed close to 0.2 (denoted by “□” in Fig. 12(a)), it is also exit overlapping.
2) Low-frequency normalized characteristic vector of velocity signal. Signal characteristics of velocity signal, according to acceleration signal that is obtained when it is installed on vertical upper of acceleration sensor, is distributed close to 0.2 (express on “△” in Fig. 11(b)) in the condition of rubbing position that is on vertical upper of turbine casing, while signal characteristics of velocity signal, according to acceleration signal that is obtained when it is installed on vertical upper of acceleration sensor is distributed close to 0.3 (denoted by “△” Fig. 12(b)) in the condition of rubbing position that is on horizontal right of turbine casing. Namely, the diversity of velocity signal low-frequency normalized energy characteristic is bigger for the sensor that is installed on the same position when rubbing position is different. This feature is favorable for the identification of rubbing position. The characteristics of velocity signal obtained based on acceleration sensor which is installed on another position has the same characteristics. For example, rubbing position on vertical upper of turbine casing (Fig. 11(b)), velocity signal characteristics, according to acceleration sensor that is installed on horizontal left, collected and changed is distributed close to 0.3 (denoted by “□” in Fig. 11(b)), and rubbing position on horizontal right of turbine casing (Fig. 12(b)), velocity signal characteristics, according to acceleration sensor that is installed on horizontal left, is distributed close to 0.2 (denoted by “□” in Fig. 12(b)). That is, when rubbing position is different, the diversity of velocity signal low-frequency normalized energy characteristics is larger for the sensor that is installed on the same position.
Based on above analysis, we can predict that, low-frequency normalized energy characteristics of velocity signal is more ideal than acceleration signal low frequency normalized mean-square value characteristics to identify rotor-stator rubbing position. In order to verify accuracy and effectiveness of the analysis, the method of rotor-stator rubbing position identification is studied based on acceleration signal and velocity signal. Simultaneously, in order to analyze dependence and sensitivity of extracted characteristic value to different classification algorithm, the nearest neighbor classification algorithm and SVM is used to identify different rubbing positions.
4.2. A rotor-stator rubbing position identification method based on casing velocity signal
We also take the experimental data from 23th May 2014 as an example to analyze, and the aero-engine rotor rig and rubbing experiment is described in section 2 in the paper. Every sensor selected as samples numbers is 100 in the station of two rubbing experiments and different rubbing position (two experiments, including 3200 group data, formatted 800 characteristic vectors, its samples numbers is 800). The casing vibration acceleration signal is collected and changed to velocity signal through integral and polynomial least square fitting method. Then, FFT transformation is implemented for acceleration signal and velocity signal. Low frequency normalized energy characteristics of velocity signal and normalized mean-square value characteristics of acceleration signal are extracted; finally, the normalized characteristic parameter including energy and mean-square value is input into nearest neighbor classifier and SVM in order to identify the different rubbing positions and compare dependence and sensitivity of extracted characteristics with different classification algorithm.
The Euclidean distance is used to measure the distance between samples for nearest neighbor classification algorithm, and the Gaussian nuclear function is selected for SVM nuclear function, and cross validation method that is widely used is selected to optimize parameter of radical basis function nuclear function.
The concrete implementation processes of rubbing position identification based on nearest neighbor classification algorithm and SVM are listed as following:
1) Rubbing characteristic vector of normalized mean-square value and energy is class-marked;
2) Class-marked characteristic vectors, including mean-square value and energy, are respectively mixed and Bisection randomly approximately, and one part is standard sample, another is testing sample. The testing samples are input to nearest neighbor classifier to identify the different rubbing positions, and Euclidean distance is used to measure the distance between samples according to input standard samples. The samples are divided by 10 times consecutively and randomly, taking recognition rate mean-value of 10 times testing as mean recognition rate. The result is shown in Table 1 and Table 2. Table 1 is testing recognition rate according to acceleration signal low-frequency mean-square value characteristics based on nearest neighbor classification algorithm, and Table 2 is testing recognition rate according to velocity signal low-frequency energy characteristics based on nearest neighbor classification algorithm.
3) Class-marked characteristic vectors, including mean-square value and energy, are respectively mixed and trisected approximately, and one part is training samples, one is testing samples, and another part is unknown samples. The training samples and testing samples are input to support vector machine to identify the different rubbing positions, and 10 cross validation method is selected to optimize parameter of Gaussian nuclear function according to input training samples. The testing is completed for training samples, testing samples and unknown samples according to optimized parameter. The test is conducted 10 times consecutively and randomly, taking recognition rate mean-value of 10 times testing as mean recognition rate, the result is shown in Table 3 and Table 4. Table 3 is 10 times testing recognition rate according to acceleration signal low-frequency mean-square value characteristics based on SVM, and table 4 is 10 times testing recognition rate according to velocity signal low-frequency energy characteristics based on SVM.
From Tables 1-4, the following conclusion can be drawn:
Mean recognition rate of velocity signal of testing samples is above 93 % by nearest neighbor classification algorithm and above 98 % for training samples, testing samples and unknown samples based on SVM, while the mean recognition rate of acceleration signal respective is only about 81 % and 86 % based on nearest neighbor classification algorithm and SVM. That is, the velocity signal energy characteristics are obviously better than acceleration signal mean-square value characteristics to the result of rubbing position identification, and the mean recognition rate is improved by more than 10 %. Meanwhile, we can find that the SVM recognition ratio is higher than nearest neighbor classification algorithm, while analyzing the reason, 10-cross validation method is selected to optimize parameter of Gaussian nuclear function according to input train based on support vector machine, which leads to higher recognition ratio. In fact, the recognition rate is contiguous. Namely, extracted characteristic is insensitive to different classification algorithms, and embodied good consistency to same rubbing position and good diversity to different rubbing position.
Table 110 times testing recognition rate based on nearest neighbor classification algorithm for acceleration signal
Experiment number | Train samples numbers | Unknown samples numbers | Unknown samples recognition rate (%) |
1 | 387 | 413 | 82.1 |
2 | 388 | 412 | 82.3 |
3 | 386 | 414 | 79.9 |
4 | 379 | 421 | 83.1 |
5 | 401 | 399 | 81.8 |
6 | 398 | 402 | 82.3 |
7 | 392 | 408 | 79.6 |
8 | 404 | 396 | 82.5 |
9 | 394 | 406 | 80.1 |
10 | 402 | 398 | 82.3 |
Mean recognition rate | – | – | 81.6 |
Table 210 times testing recognition rate based on nearest neighbor classification algorithm for velocity signal
Experiment number | Train samples numbers | Unknown samples numbers | Unknown samples recognition rate (%) |
1 | 387 | 413 | 93.6 |
2 | 388 | 412 | 93.6 |
3 | 386 | 414 | 92.9 |
4 | 379 | 421 | 92.2 |
5 | 401 | 399 | 93.6 |
6 | 398 | 402 | 93.3 |
7 | 392 | 408 | 92.3 |
8 | 404 | 396 | 94.3 |
9 | 394 | 406 | 93.4 |
10 | 402 | 398 | 93.6 |
Mean recognition rate | – | – | 93.3 |
Table 310 times testing recognition rate based on SVM for acceleration signal
Experiment number | Train samples numbers | Testing sample numbers | Unknown samples numbers | Gamma | Regularization parameter C | Train samples recognition rate (%) | Testing samples recognition rate (%) | Unknown samples recognition rate (%) |
1 | 257 | 275 | 268 | 256 | 4 | 84.62 | 84.11 | 84.20 |
2 | 266 | 260 | 274 | 64 | 4 | 88.10 | 85.92 | 89.47 |
3 | 259 | 263 | 278 | 256 | 16 | 86.33 | 86.05 | 86.47 |
4 | 269 | 259 | 272 | 64 | 16 | 89.26 | 84.87 | 88.81 |
5 | 273 | 264 | 263 | 64 | 4 | 85.31 | 89.47 | 87.31 |
6 | 264 | 275 | 261 | 256 | 1 | 89.55 | 83.58 | 86.47 |
7 | 245 | 283 | 272 | 256 | 4 | 85.93 | 84.68 | 85.25 |
8 | 267 | 251 | 282 | 256 | 256 | 88.98 | 83.69 | 87.22 |
9 | 252 | 279 | 269 | 256 | 1 | 87.88 | 88.89 | 87.97 |
10 | 268 | 270 | 262 | 256 | 256 | 84.06 | 88.46 | 85.82 |
Mean recognition rate | – | – | – | – | – | 87.00 | 85.97 | 86.90 |
Table 410 times testing recognition rate based on SVM for velocity signal
Experiment number | Train samples numbers | Testing sample numbers | Unknown samples numbers | Gamma | Regularization parameter C | Train samples recognition rate (%) | Testing samples recognition rate (%) | Unknown samples recognition rate (%) |
1 | 249 | 280 | 271 | 256 | 1 | 100 | 97.48 | 99.25 |
2 | 235 | 276 | 289 | 256 | 4 | 99.26 | 100 | 99.25 |
3 | 262 | 273 | 265 | 64 | 16 | 99.3 | 100 | 98.51 |
4 | 252 | 260 | 288 | 256 | 1 | 100 | 98.53 | 99.25 |
5 | 258 | 269 | 273 | 256 | 0.25 | 100 | 97.33 | 98.24 |
6 | 260 | 277 | 263 | 64 | 16 | 100 | 100 | 98.51 |
7 | 263 | 283 | 254 | 256 | 4 | 100 | 97.6 | 99.25 |
8 | 267 | 259 | 274 | 256 | 1 | 99.27 | 98.47 | 99.25 |
9 | 261 | 280 | 259 | 256 | 4 | 99.29 | 99.21 | 99.25 |
10 | 258 | 265 | 277 | 64 | 16 | 99.28 | 99.22 | 98.50 |
Mean recognition rate | – | – | – | – | – | 99.64 | 98.79 | 98.93 |
5. Conclusions
Velocity is a perfect parameter to reflect vibration for most equipment, and its effective value is a standard to the measuring of vibration faults diagnosis across the globe. Based on this, the method of identifying a rotor-stator rubbing position on the basis of casing velocity signal is proposed. The rotor experiment rig of aero-engine is used to simulate rubbing faults in the condition of 4-different-positions rubbing experiment of turbine casing and the casing vibration acceleration signal is collected and changed to velocity signal through integral and polynomial least square fitting method. The FFT transformation and low frequency normalized energy characteristics of velocity signal and normalized mean-square value characteristics of acceleration signal are extracted and analyzed. Finally, normalized characteristics parameters, including energy and mean-square values, are input to nearest neighbor classifier and support vector machine to identify the different rubbing positions and analyzed sensitivity of extracted characteristics to different classification algorithms, the identification results are compared and analyzed at the same time. The results show following features of low-frequency energy characteristics of velocity signal:
1) Same rubbing position: central tendency is better for normalized characteristic vector from sensor which is installed on the same position, while difference is larger for sensors that are installed on different positions of velocity signal.
2) Different rubbing positions: diversity is bigger for normalized characteristic vector from sensor which is installed on same position of velocity signal.
3) The mean recognition rate of velocity signal is above 93 % based on nearest neighbor classifier and above 98 % for training samples, testing samples and unknown samples based on SVM, and the identification result is obviously better than acceleration signal mean-square value characteristics to rubbing position identification result.
4) 10-cross validation method is selected to optimize parameter of Gaussian nuclear function according to input train based on support vector machine, which leads to higher recognition ratio than nearest neighbor classifier. In fact, the recognition rate is contiguous. Namely, extracted characteristic is insensitive to different classification algorithms.
The method should require further study in terms of the following aspects:
1) Real velocity signal comparison: Limited by experiment conditions, the comparison is only conducted among displacement signal.
2) The proposed research method in this paper should be inspected in the actual project. The proposed method was inspected just by simulated data of the aero-engine rotor experiment rig. As the real aero-engine structure is far more complex than rotor experiment rig, as well as a great deal of external noises and the existence of vibrations in real flight, actual project inspection is required to determine the efficiency of extracting casing characteristics.
References
-
Duan Chen-dong, He Zheng-jia A fault feature extraction method using the lifting wavelet transform and its applications. Journal of Vibration and Shock, Vol. 26, Issue 2, 2007, p. 10-14.
-
Deng Ai-dong, Bao Yong-qiang, Zhao Li Positioning of acoustic emission source by using sub-gradient projection based on energy attenuation model. Journal of Mechanical Engineering, Vol. 46, Issue 9, 2010, p. 66-72.
-
Chu Fu-lei, Wang Qing-yu, Lu Wen-xiu Detective of the rub location in a rotor system with AE sensors and wavelet analysis. Journal of Mechanical Engineering, Vol. 38, Issue 3, 2002, p. 139-143.
-
He Tian, Liu Yao-guang, Chen Ya-nong, et al. Method for Locating rub fault of rotor-stator based on acoustic emission beam forming. Journal of Aerospace Power, Vol. 26, Issue 10, 2011, p. 2207-2213.
-
Wang Q., Chu F. Experimental determination of the rubbing location by means of acoustic emission and wavelet transform. Journal of Sound and Vibration, Vol. 248, Issue 1, 2001, p. 91-103.
-
Chu F., Lu W. Determination of the rubbing location in a multi-disk rotor system by means of dynamic stiffness identification. Journal of Sound and Vibration, Vol. 248, Issue 2, 2001, p. 235-246.
-
Han Q. K., Yu T., Li H., et al. Hybrid model based identification of local rubbing fault in rotor systems. Key Engineering Materials, Vol. 293, Issue 294, 2005, p. 355-364.
-
Lu Wen-xiu, Chu Fu-lei, Guo Dan Rubbing location identification based on genetic algorithms. Journal of Tsinghua University (Science and Technology), Vol. 45, Issue 2, 2005, p. 208-211.
-
Yuan Sheng-fa, Chu Fu-lei The application on Shaft Rubbing positions identification based on sphere support vector machine. Journal of Vibration and Shock, Vol. 28, Issue 8, 2009, p. 70-77.
-
Sun Yun-lin, Hang Yong-xiang, Chang Han-bao Method of rotor rub-impact faults diagnosis based on stator vibration signal. Journal of Mechanical Engineering, Vol. 22, Issue 4, 2009, p. 391-394.
-
Yu Mingyue, Chen Go, Liu Yongquan, et al. Aero-engine rotor-stator rubbing position identification based on casing strain signals. Acta Aeronautica et Astronautica Sinica, Vol. 34, Issue 6, 2015, p. 1474-1484.
-
Gu Mingshen, Lv Zhenhua Identification of a mechanism’s vibration velocity and displacement based on the acceleration measurement. Mechanical Science and Technology for Aerospace Engineering, Vol. 30, Issue 4, 2011, p. 522-526.
-
He Peng-ju, Feng Liang Study on the real-time elimination method of random noise and trend terms in acceleration signal. Electronic Design Engineering, Vol. 21, Issue 14, 2013, p. 18-22.
Cited by
About this article

