Abstract
Three simulation experiments are designed to evaluate and compare the performance of three common independent component analysis implementation algorithms – FastICA, JADE, and extended-Infomax. Experiment results show that the above three algorithms can’t separate the mixtures of super-Gaussian and sub-Gaussian precisely, and FastICA fails in recovering weak source signals from mixed signals. In this case an independent component analysis algorithm, which applies genetic algorithm to minimize the difference between joint probability and product of marginal probabilities of separated signals, is proposed. The computation procedure, especially the fitness evaluation when signals are in discrete form, is discussed in detail. The validity of the proposed algorithm is proved by simulation tests. Moreover, the results indicate that the proposed algorithm outperforms the above three common algorithms significantly. Finally the proposed algorithm is applied to separate the mixture of rolling bearing sound signal and electromotor signal, and the results are satisfied.
1. Introduction
Blind source separation (BSS) [1] is one of the research focuses of signal processing area, its purpose is to recover source signals from mixed signals, without any prior knowledge (or with very little information) about the source signals. There are two main methods for BSS: principal component analysis (PCA) [2] and independent component analysis (ICA) [3]. PCA is based on the second-order statistics. Its main purpose is to eliminate the correlation between signals, so it is mainly used to compress the dimension of data. ICA considers the higher-order statistics of data, output signals of ICA are mutually independent. Owing to this property, ICA has been widely used in many areas such as audio processing [4], image processing [5] and vibration signal processing [6].
Algorithms for ICA include FastICA [7], JADE [8], Infomax [9] and many others. FastICA is an iterative algorithm maximizing non-Gaussianity as a measure of statistical independence. As FastICA algorithm has the advantage of quick convergence and free from setting iteration step length, it has become the most popular algorithm for ICA. But the update formula of FastICA includes activation functions that depend on the distribution of source signals, which is unknown for practical problems. Infomax algorithm proposed by Bell and Sejnowski is another widely used ICA implementation algorithm. This algorithm has the same drawback as FastICA – activation function selection problem. This disadvantage led to the appearance of an extension version – extended-Infomax algorithm [10], which is able blindly to separate mixed signals with sub- and super-Gaussian source distributions, and has been proved to outperform traditional Infomax algorithm. In 1999 another widely used ICA algorithm, JADE algorithm, appeared. It’s a fourth order technique, involving the diagonalization of cumulant matrices. Lots of literatures proved the success of these algorithms in solving BSS problems. Note that these are mostly normal BSS problems, i. e. there are only super-Gaussian sources or only sub-Gaussian sources existing, each source has similar percentage in the mixed signals. However in realistic practice there might be some unusual BSS problems appearing. For example, when diagnosing early failure of machine, as the fault phenomenon is faint, the observed signals are the mixtures of weak fault signals and strong noise signals. In order to detect early faults, we have to recover weak fault signal from mixed signals. Moreover sometimes we have to separate the mixed signals of super-Gaussians and sub-Gaussians. These are some unusual BSS problems and few papers discussed the abilities of ICA algorithms dealing with these problems.
This paper is organized as follows. Principle of ICA is introduced in Section 2. Some simulation experiments are designed to evaluate and compare the performances of three common ICA algorithms (FastICA, JADE and extended-Infomax) in separating mixtures of sub-Gaussians and super-Gaussians which cover different percentage of mixtures in Section 3. Furthermore, a novel ICA algorithm, which utilizes genetic algorithm to minimize the difference between joint probability and product of marginal probabilities of separated signals, is introduced in detail. In Section 5 the validity of the proposed ICA algorithm is tested and its performance is compared with those of above three algorithms. Section 6 gives an engineering application of our algorithm, and Section 7 concludes the text.
2. Principle of LSVM
Assume that there exist unknown source signals , which are mutually independent, and observed signals , which are the linear mixtures of source signals, that is:
where denotes the mixing matrix. The problem is to find a separating matrix to retrieve the source signals from without knowing the mixing vector . That is, let , so that is an estimate of . The optimality criterion for is that the components of are mutually independent.
3. Performance of common ICA algorithms
In order to compare the performances of three common ICA algorithms mentioned above, three experiments are designed with different test targets. The first experiment examines the performance in separating mixtures of sub-Gaussians and super Gaussians, the second one is a separation task of weak sources mixed with strong sources, and the final one simulates a BSS problem of strong super-Gaussian mixed with weak sub-Gaussian. The criteria used to evaluate the performances of ICA algorithms include observing and comparing the waveforms of source signals and separated ones intuitively, and a quantitative indicator which is the signal noise ratio of separated outputs [11]. is denoted as following:
where is the -th source signal, is the corresponding separated signal. The larger the value, the better the separation effect.
3.1. Sub-Gaussians mixed with super-Gaussians
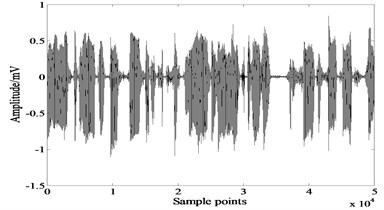
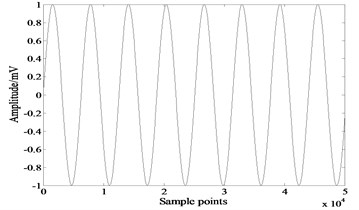
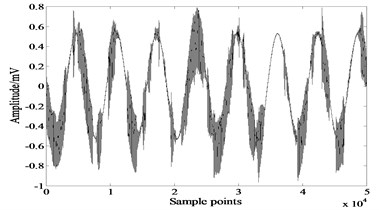
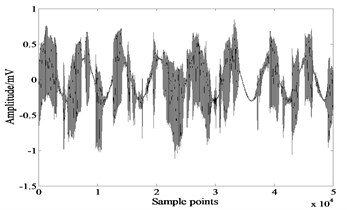
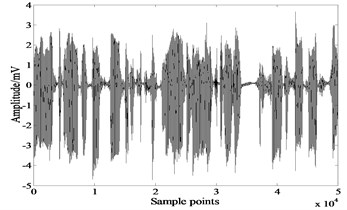
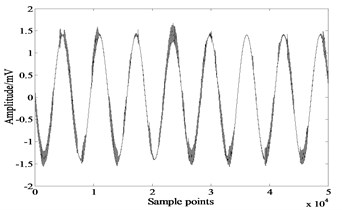
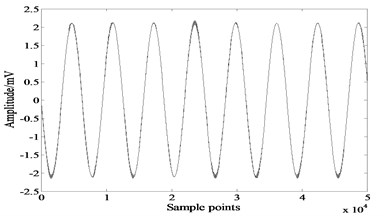
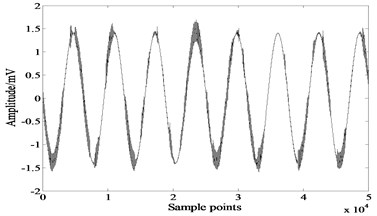
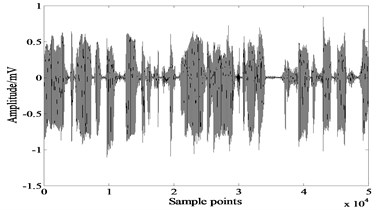
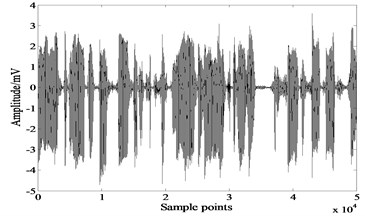
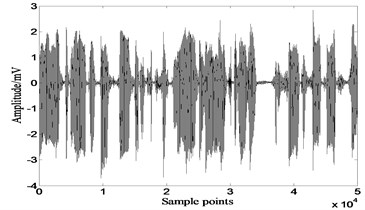
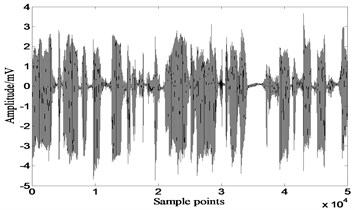
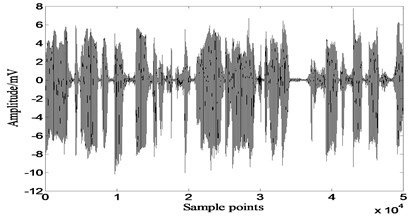
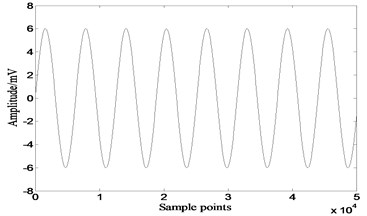
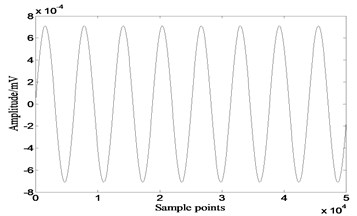
Fig. 1 is the simulating source signals. The first signal is a voice signal and the second one is a sine wave. Kurtosis values of these signals are 1.1750 and –0.3770 respectively, so it’s a separation problem of sub-Gaussian mixed with super-Gaussian. The mixing matrix . Fig. 2 shows the mixed signals.
Fig. 1Source signals
a)
b)
Fig. 2Mixed signals
a)
b)
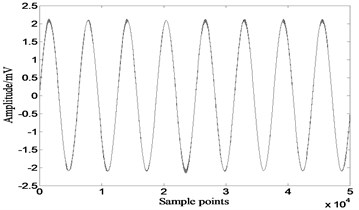
According to the distribution of source signals, we choose as the activation function of FastICA. Fig. 3-5 show signals recovered by FastICA, extended-Infomax and JADE. Table 1 gives of each algorithm, the bolded numbers are the highest values of .
Table 1Signal noise ratio of separated outputs (y1 corresponds to voice signal, y2 corresponds to sine signal)
Algorithm | FastICA | Extended-Infomax | JADE |
81.8523 | 87.6789 | 80.2098 | |
48.8070 | 83.8255 | 47.0163 |
Fig. 3Signals recovered by FastICA
a)
b)
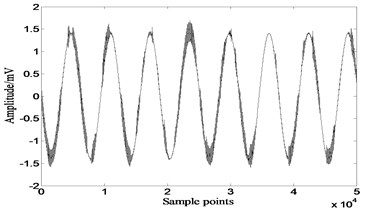
Fig. 4Separated signals by extended-Infomax
a)
b)
Fig. 5Results of JADE
a)

b)
The comparison reveals that extended-Infomax algorithm outperforms the other two algorithms, followed by FastICA, and the least effective one is JADE. However even for the best performed algorithm extended-Infomax, there are differences in the waveforms of separated signals and source signals, the separation result is unsatisfied.
3.2. Weak sources mixed with strong sources
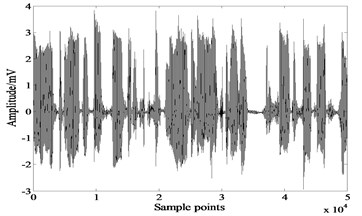
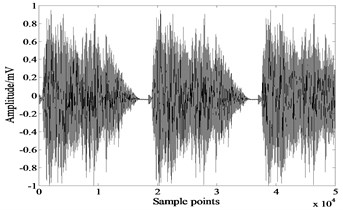
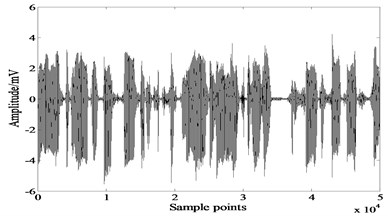
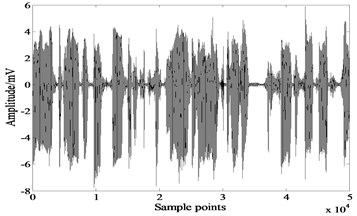
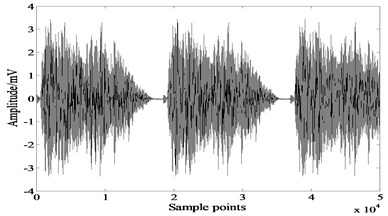
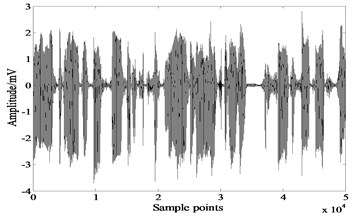
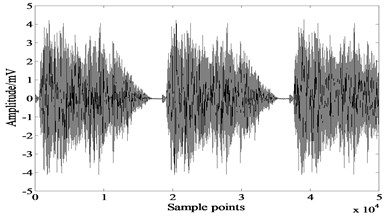
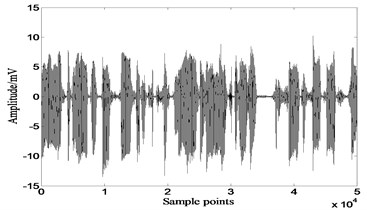
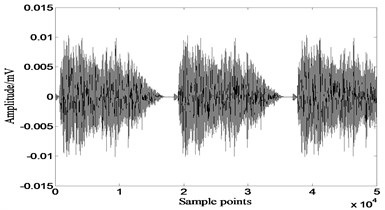
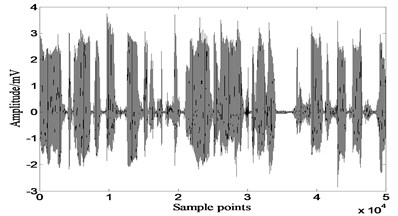
In this experiment two sound signals shown in Fig. 6 are taken as source signals. Kurtosis values of these signals are 1.1750 and 5.9013 respectively. The mixing matrix . Fig. 7 shows the mixed signals. Due to the great differences of the coefficients in mixing matrix , both mixed signals are similar to the first source signal. We consider this as a separation task of weak source and strong source.
Results of extended-Infomax and JADE are shown in Fig. 8 and Fig. 9. FastICA considers the two mixed signals as one and totally fails in recovering source signals. The of each algorithm are listed in Table 2.
Figures indicate that both JADE and extended-Infomax algorithms recover the source signals successfully, results of Table 2 reveal that JADE performs slightly better than extended-Infomax.
Fig. 6Source signals
a)
b)
Fig. 7Mixed signals
a)
b)
Fig. 8Results of extended-Infomax
a)
b)
Fig. 9Results of JADE
a)
b)
Table 2RSN(yi) of three algorithms (y1 corresponds to the first source signal, y2 corresponds to the second one)
Algorithm | FastICA | Extended-Infomax | JADE |
– | 137.8288 | 146.4628 | |
– | 136.0017 | 139.9788 |
3.3. Strong super-Gaussian mixed with weak sub-Gaussian
In this experiment we use the same source signals as those in section 3.1 and the same mixing matrix as that in section 3.2, simulating the BSS problem of strong super-Gaussian mixed with weak sub-Gaussian. Signals recovered by JADE and extended-Infomax algorithms are shown in Fig. 10 and Fig. 11, the of each algorithm are listed in Table 3. FastICA algorithm still fails completely in this experiment.
Table 3RSN(yi) of three algorithms (y1 corresponds to the voice signal, y2 corresponds to sine signal)
Algorithm | FastICA | Extended-Infomax | JADE |
– | 101.7624 | 80.1420 | |
– | 79.9405 | 46.9442 |
Figures show that results of extended-Infomax and JADE are all unsatisfied, separated signals are still lightly mixed. Results of Table 3 demonstrate that the performance of extended-Infomax is superior to JADE.
Conclusions can be drawn from these experiments:
(1) All of three ICA algorithms mentioned above can’t solve the BSS problem when super-Gaussian sources coexist with sub-Gaussian sources.
(2) FastICA fails in recovering weak source signals from mixed signals. This property makes FastICA not suit for weak signal detection problem, e. g. early fault diagnosis.
(3) The comprehensive performance of extended-Infomax is the best in these algorithms and FastICA performs worst. Actually, researches prove that the performance of FastICA is influenced by the selection of non-linear activation functions [12], thus efficiency of FastICA for practical problems is uncertain.
Fig. 10Results of extended-Infomax
a)
b)
Fig. 11Results of JADE
a)
b)
4. Genetic algorithm optimized ICA algorithm
The essence of ICA is to build a separating matrix to maximize the independence of output signals. As it’s difficult to get the gradient information of most independent criterions, conventional gradient descent method is inappropriate to deal with this optimization problem, whereas genetic algorithm is a good choice.
4.1. Optimization model
In probability theory, if variables satisfy the following equation, we consider them to be statistically independent:
where is the joint probability of these variables and is the marginal probability of variable . So the difference between joint probability and product of marginal probabilities of variables is taken as a measure of statistical independence and then the optimization model is built as following:
4.2. Optimization algorithm and optimization process
As it’s difficult to give the derivative function of Eq. (4), a genetic algorithm optimized ICA algorithm is established in this study.
Three major steps in executing genetic algorithm to find the optimum matrix are as following:
(I) Initialization.
As exists, changing values in equal proportions, orders, or signs of row vectors in separating matrix wouldn’t influence the dependence of separated signals, the range of possible solutions is narrowed in .
Note that if waveforms of mixed signals are similar to each other (just like the example in section 3.2), implying a BSS problem with strong sources and weak sources, there is a great difference in the values of , we should increase the length of chromosome to search in a finer grid.
Determine the population size and generate the initial individuals randomly.
(II) Iteratively perform the following sub-steps on the population until the termination criterion is satisfied. The maximum number of generation to be run is determined beforehand.
(1) Create new individuals by crossover and mutation operation.
(2) Assign a fitness value to each individual in the population using the fitness measure.
The calculation of objective function defined as Eq. (4) requires estimating the joint probability and marginal probabilities of each variable. Common probability estimation methods include histogram, Rosenblatt method, Parzen kernel estimation and nearest neighbor estimation method, etc., [13] and histogram is the most basic one. It’s a rough assessment of the distribution of a given variable with the characteristic of easy calculation. Other methods have relatively higher estimation precision but take much more computing time. Actually the precision of distribution estimation has little influence on the fitness as it values the relative, not absolute, independence of separated signals. Considering all the factors histogram is the final choice of distribution estimation.
Assume there are 2 source signals, that is . Let , and , denote the separated signals in discrete form, the objective function computation process is as following:
a) Assign a positive number to the variable which is referred as the bin width of histogram, then the value range of signal and is divided into and disjoint categories (known as bins) separately, and the whole value range is divided into categories. There is an empirical equation for the bin width [13]:
b) Count the number of discrete observations that falls into each bin, denoted by , , .
c) The frequency of observations in each bin is used to estimate the joint probability of signals and , that is:
The marginal probability distribution of signals and is calculated as following:
d) Put the above results into Eq. (4) to get the objective function value. Smaller objective function value indicates a better individual.
Note that high estimation accuracy of histogram requires long discrete signals. Fortunately most signals are long enough for histogram, if not, Bootstrap [14] is a proper approach to increase the length of signal.
(3) Select better individuals to form a new population. In order to avoid premature, ranking selection is adopted.
(III) When evolution finished, the best individual of the final population is then the optimum .
5. Performance of proposed algorithm
Same simulation signals as those in section 3 are used to test the performance of proposed algorithm which is denoted by GA-ICA to simplify description.
5.1. Sub-Gaussians mixed with super-Gaussians
Basic parameters used in genetic algorithm are listed in Table 4. The separated signals are shown in Fig. 12, 160.1629, 186.3932. Apparently performance of GA-ICA is far superior to other three ICA algorithms, of GA-ICA is 82.7 % higher than the best value of other three algorithms, and has an increase of 122.4 % over the best value of other three algorithms.
Fig. 12Results of GA-ICA
a)
b)
Table 4Basic parameters of genetic algorithm
Parameter name | Value | Parameter name | Value |
Scale of population | 60 | Crossover probability | 0.9 |
Mutation probability | 0.01 | Maximum generation | 100 |
Chromosome length | 40 |
This experiment proves the validity of GA-ICA in dealing with sub-Gaussians mixed with super-Gaussians BSS problem.
Fig. 13Results of GA-ICA
a)
b)
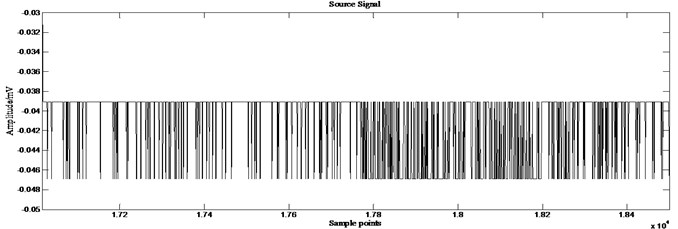
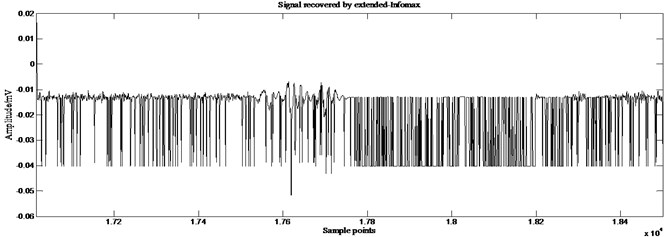
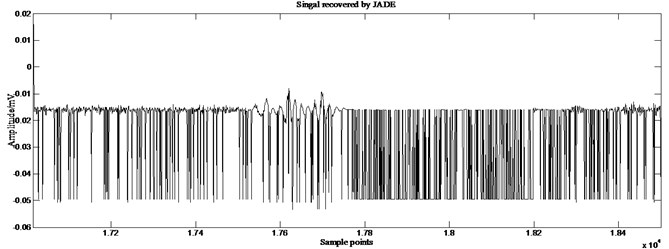
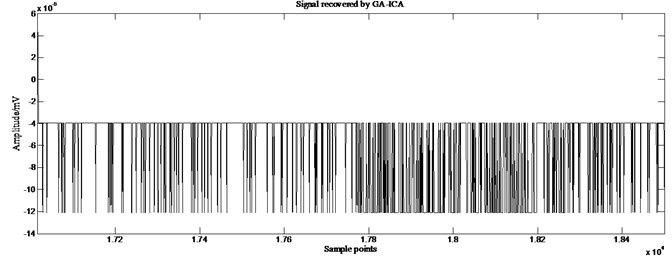
Fig. 14Partial enlarged details of source signal 2 and those recovered by different ICA algorithms
a)
b)
c)
d)
5.2. Weak sources mixed with strong sources
Most basic parameters of genetic algorithm used in this section are the same with those in section 5.1, except chromosome length. Just as mentioned above, this is a BSS problem with weak source and strong source, chromosome length is increased to 60.
Fig. 13 shows the results of GA-ICA. 212.6588, 45.2 % higher than the best value of other algorithms, 571.8645, an increase of 308.5 % over the other algorithms. Fig. 14 are the partial enlarged details (sample points: 17016-18500) of source signal 2 which simulates a weak source and those recovered by different ICA algorithms. Comparison reveals that there are some distortions existing in the signals recovered by extended-Infomax and JADE, while GA-ICA recovers source signals without any distortion, thus proves the outperformance of GA-ICA furtherly.
This example demonstrates that GA-ICA performs far more excellently in detecting weak useful signals (just like the signal in this example) from strong background signals (simulated by the signal ) than other three algorithms do. This property makes GA-ICA especially suitable for dealing with early fault diagnosis problem.
5.3. Strong super-Gaussian mixed with weak sub-Gaussian
Most basic parameters of genetic algorithm remain unchanged, chromosome length is 120. Separation results of GA-ICA are shown in Fig. 15. 202.4397, 195.3203, which increase 98.9 % and 144.3 % over the best value of other three algorithms respectively. The qualities of signals recovered by GA-ICA are much better than those of other three algorithms.
Fig. 15Results of GA-ICA
a)
b)
Three simulation experiments reveal that GA-ICA outperforms three common ICA algorithms significantly and is universal for any BSS problem.
6. Engineering application
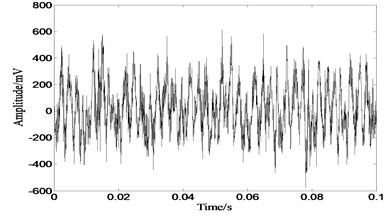
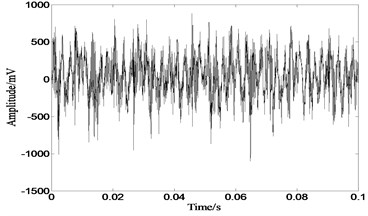
The proposed ICA algorithm is applied to deal with sound signals sampled from a rolling bearing test rig. Sound sources include a NSK 6308 rolling bearing, which is with a fatigue spall fault but the damage source is unkown, and an electric motor, which is in normal condition. Two sound level meters are placed between the motor and the rolling bearing with a distance of 25 cm to pick up the sound signals. The observed signals with sample frequancy 40 kHz are shown in Fig. 16.
As the velocity of sound is 340 m/s and the distance between two sound level meters is 25 cm, the time delay of two source signals is less than 1 ms. We consider the observed signals as the linear mixtures of the motor signal and the rolling bearing signal, i. e. a linear BSS problem.
Results of our algorithm are shown in Fig. 17. When surface damage failure occurred, the collisions of rolling bearing components are amplified, and then periodic pulses appear in the sound signal produced by the rolling bearing. The sound signal produced by a normal motor may contain mostly low-frequency components. Apparently the first separated signal is the recovery of the signal produced by motor and the second one corresponds to the signal produced by faulty rolling bearing.
Fig. 16Sound signals picked up by sound level meters
a)
b)
Fig. 17Sound signals recovered by the proposed ICA algorithm
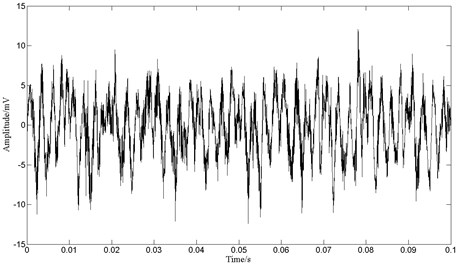
The geometric parameters of the NSK 6308 rolling bearing are: the number of balls 8, the bearing ball diameter 15 mm, the pitch diameter 65 mm, the contact angle between the ball and the race 0º and the rotational frequency of the shaft with rolling bearing mounted is 52.3 Hz. Then characteristic frequencies with fault on the inner race, outer race, or bearing balls are 257.6 Hz, 161.2 Hz and 107.2 Hz respectively. The period time of pulses in the signal of rolling bearing is 0.0062 s (see Fig. 17), which corresponds to the frequency of 161.2 Hz. It reveals that the fatigue spall damage occurs on the outer race. Inspecting bearing components carefully, a metal flaking, about 7 mm2 large and 0.2 mm depth, is found in the middle of the outer race, indicating the correctness of our analysis and the effectiveness of the proposed algorithm.
7. Conclusions
A novel ICA algorithm is proposed in this paper. This algorithm applies genetic algorithm to minimize the difference between joint probability and products of marginal probabilities of separated signals. Three simulation experiments are designed to evaluate and compare the performance of FastICA, JADE, extended-Infomax and GA-ICA. Comparison reveals that for super-Gaussian mixed with sub-Gaussian problem only GA-ICA recovers the source signals precisely, there are some distortions existing in the signals recovered by the other three ICA algorithms; for strong source mixed with weak source problem, GA-ICA, extended-Infomax and JADE recover the source signals successfully, GA-ICA performs best, of GA-ICA has an increase of 45.2 % and 308.5 % over the best value of other algorithms respectively, while FastICA fails in this problem; for strong super-Gaussian mixed with weak sub-Gaussian problem, only GA-ICA recovers the source signals precisely, FastICA still fails. So the conclusion is drawn that GA-ICA outperforms three common ICA algorithms significantly and is a universal technique for any BSS problem. Finally the proposed ICA algorithm is applied to deal with sound signals sampled from a rolling bearing test rig. Analysis of the separated signal reveals the damage source of rolling bearing, indicating the effectiveness of the proposed algorithm.
References
-
Jutten C., Herault J. Blind separation of sources, Part 1: An adaptive algorithm based on neuromimetic architecture. Signal Processing, Vol. 24, Issue 1, 1991, p. 1-10.
-
Common P. Independent component analysis, a new concept. Signal Processing, Vol. 36, Issue 3, 1994, p. 287-314.
-
Oja E. Principal components, minor components, and linear neural networks. Neural Networks, Vol. 5, Issue 6, 1992, p. 927-935.
-
Mark D. Plumbley, Samer A., et al. Sparse representations of polyphonic music. Signal Processing, Vol. 86, 2006, p. 417-431.
-
Wenjie Dun, Zhichun Mu, Hailong Zhao. Multi-modal recognition of face and ear images based on two types of independent component analysis. Journal of Computational Information Systems, Vol. 5, 2008, p. 1997-1983.
-
Haiqing Qin, Kejun Xu, Jianping Ou. Analysis of aero engine vibration signal based on blind source separation technology. Journal of Beijing University of Aeronautics and Astronautics, Vol. 11, 2010, p. 1307-1310.
-
Hyvarien A. Fast and roubust fixed-point algorithms for independent component analysis. IEEE Transactions on Neural Networks, Vol. 10, Issue 3, 1999, p. 626-634.
-
J. F. Cardoso. High-order contrasts for independent component analysis. Neural Computation, Vol. 11, Issue 1, 1999, p. 157-192.
-
Bell A. J., Senjnowsk T. J. An information-maximization approach to blind separation and blind deconvolution. Neural Computation, Vol. 7, Issue 6, 1995, p. 1129-1159.
-
T. Lee, M. Girolami, T. Sejnowski. Independent component analysis using an extended-Infomax algorithm for mixed sub-Gaussian and super-Gaussian sources. Neural Computation, Vol. 11, Issue 2, 1999, p. 417-441.
-
A. G. Westner. Object Based Audio Capture: Separating Acoustically Mixed Sounds. Master’s Thesis, MIT, 1999.
-
Liangmin Li. New blind source separation method based on genetic algorithm. Journal of Xi’an Jiaotong University, Vol. 39, Issue 7, 2005, p. 740-743.
-
Chen Xiru, Chai Genxiang. Non-Parametric Statistics. Shanghai, East China Normal University Press, 1993, p. 247-255.
-
Zoubir A. M., Iskander D. R. Bootstrap methods and applications: a tutorial for the signal processing practitioner. IEEE Signal Processing Magazine, Vol. 24, Issue 4, 2007, p. 10-19.
About this article
This work was supported by National Natural Science Foundation of China (No. 51075323), Special Fund for Basic Scientific Research of Central Colleges (No. CHD2011JC025).
