Abstract
Squeak and Rattle (S&R) of automotive door panels seriously affect consumers' perception of vehicle quality. In order to accurately analyze the S&R problem, BP software was used to build an S&R analysis finite element model of the interior assembly of the door interior, taking into account the pre-compression between the interior door panel and the sheet metal during installation. The excitation transmitted from the body to the door through the hinge is tested, and the modal transient analysis of the model is carried out by BP software. Combined with the S&R noise risk assessment standard, the analysis results were evaluated, and the S&R points were determined. Through the bench test, it is verified that the test risk points are consistent with the analysis results, indicating the accuracy of the S&R simulation analysis. Based on the modal contribution, the S&R risk points are optimized and analyzed. Through optimization analysis, the abnormal noise risk is reduced. The results show that in the digital model design stage, the door panel S&R risk analysis based on BP software can be carried out for abnormal noise risk prediction and optimization analysis, that greatly saves development time and reduces development costs.
1. Introduction
According to the mechanism of the occurrence of automobile interior noise, it is divided into Squeak and Rattle. The automobile interior noise can be roughly attributed to structural design, assembly error, dimensional tolerance, compatibility of contact materials, performance fatigue degradation, etc. [1].
Jiang and Qiu [2] started from three aspects: the source, propagation path, and reception point of interior noise, combined with engineering experience to optimize and analyze the issue of interior noise. However, the workload of testing is significant and the project cycle time is long. Peng et al. [3] strengthened design control during the conceptual and detailed design stages, effectively reducing the risk of abnormal noise through conventional analysis methods such as mode, stiffness, and vibration sensitivity. However, the all above analysis methods are indirect controls. After summarizing conventional noise analysis methods, Li et al. [4] applied the SNRD method to analyzing the interior noise of the entire vehicle, which provided an important basis for avoiding the risk of noise in the forward development stage. Li et al. [5] applied the SNRD abnormal noise analysis method to studying the influence of material parameters and fatigue attenuation on abnormal noise performance. However, the impact of interference between the interior panel and sheet metal installation was not considered in the analysis and research involving the interior assembly of the opening and closing parts, so there are certain errors based on the simplified analysis.
This article uses BP software to build a finite element model of the interior assembly of a certain car model's tailgate. For the installation position where the interior panel and sheet metal interfere, the local static stiffness of the contact position is obtained through static analysis in advance. The analysis results are used as stiffness constraints between the interior and sheet metal, and excitation is applied at the connection position between the door trim assembly and the body for forced response analysis. Based on the risk assessmentfrom the analysis results, the risk points obtained are consistent with the risk points of abnormal noise testing. For locations with S&R risk, optimization is conducted based on modal contribution analysis [6] to reduce the risk of abnormal noise.
2. The establishment and verification of the door interior assembly analysis model
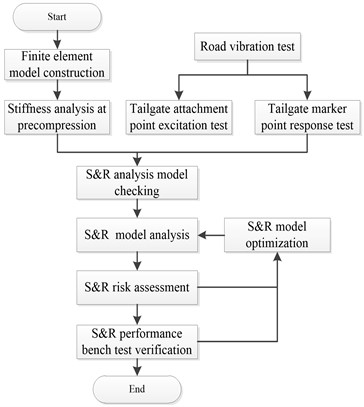
The abnormal noise analysis process is shown in Fig. 1. Use BP software to perform forced response analysis on the tailgate assembly, optimize the risk points of abnormal noise based on modal contribution analysis, and verify the credibility of the optimization analysis.
Fig. 1Flow chart of abnormal noise analysis
2.1. Finite element model construction
This article takes the tailgate of a certain car model as an example to analyze the abnormal noise. The modeling of sheet metal parts is mature [7], It is necessary to divide the mesh thickness reasonably, while ensuring that the quality error between the finite element model and all structural components provided in the weight table is controlled within 5 %; If a structural component is replaced by a quality unit, the assigned quality unit should be consistent with the actual centroid position of the structural component. To ensure the contribution analysis of medium to high-order modal frequencies, local modeling needs to be refined.
The finite element mesh of interior and sheet metal is created using Ansa or Hypermesh software, and both are shell meshes. The basic size of the interior mesh is 5 mm, and the basic size of the sheet metal mesh is 8 mm. Among them, the CTRIA3 mesh type is used for triangular meshes, and the CQUAD4 mesh type is used for quadrilateral meshes. The proportion of triangular meshes does not exceed 7 % of the overall number of meshes.
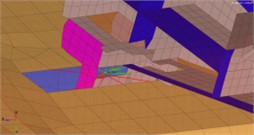
Connect the tailgate sheet metal and interior model in the BP software interface. The bolts are simulated using RBE2 connections, spot welding is simulated using SPOT elements, and welds are simulated using SEAM elements, the buckle is simulated using the RBE2-CBUSH-RBE2 connection method, as shown in Fig. 2, and the CBUSH element attributes are assigned based on the specific buckle stiffness.
Fig. 2Connection diagram of buckle and bolt
2.2. Analysis of the stiffness of the pre-compressed position of the tailgate interior
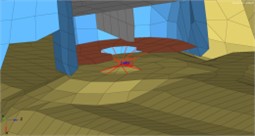
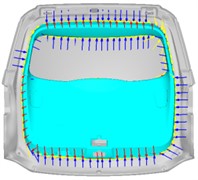
As shown in Fig. 3(a), it is necessary to conduct a static stiffness analysis of the interior panel of the tailgate in the contact area with the tailgate sheet metal [8], as shown in Fig. 3(b). Through finite element static analysis, the static stiffness values of the surrounding area in the , , and directions in the local coordinate system are obtained.
Fig. 3Installation position and Static stiffness of pre-compression
a)
b)
2.3. Tailgate abnormal noise analysis model building
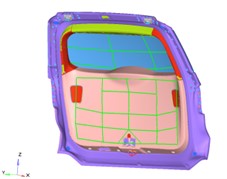
Building a tailgate abnormal noise analysis model using BP software. Based on the DTS file, a monitoring point for S&R is established between adjacent structural components through the RBE3-CBUSH-RBE3 method [9], For the squeak monitoring points, the CBUSH normal stiffness value is taken as 1000 N/mm, and 0 is taken in other directions; For the Rattle monitoring points, the CBUSH normal stiffness values are all taken as 0; For locations with interference installation, the stiffness attribute of the CBUSH element at the connection location is assigned based on the results obtained from the static stiffness analysis mentioned earlier.
2.4. Tailgate model verification
Fig. 4(a) shows the free mode test on the tailgate assembly. As shown in Fig. 4(b), the free mode simulation analysis is carried out on the tailgate assembly model. The results are shown in Table 1, which indicate that the error between the simulation results and test results of each corresponding order is less than 5 %, meaning that the finite element model of the tailgate meets the subsequent simulation needs.
Fig. 4Tailgate assembly modal test and model
a)
b)
Table 1Tailgate modal testing and analysis results
Order Result | Test result | Analysis result | Error (%) |
First-order torsion | 29.1 Hz | 30.2 Hz | 3.8 |
First-order bending | 49.8 Hz | 49.4 Hz | 0.8 |
Interior first-order mode | 29.6 Hz | 30.2Hz | 2.0 |
Interior second-order mode | 35.8 Hz | 36.0 Hz | 0.6 |
Interior third-order mode | 50.2 Hz | 49.4 Hz | 1.6 |
2.5. Analysis of S&R conditions of tailgate
This article applies time-domain excitation loads to the hinge and door lock positions where the door contacts the vehicle body based on BP software, conducts modal frequency response analysis, and conducts probability statistics on the results of the noise analysis. This article uses the acceleration obtained from the test as the excitation.
3. Risk analysis and experimental verification
3.1. Analysis of simulation results
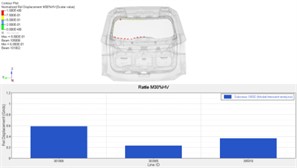
Utilize BP software to statistically analyze the abnormal noise of the tailgate. The risk statistics of abnormal knocking sounds are carried out by the way of normal distribution. The results with a result value greater than 10 % shall be regarded as high risk, the results with a result value between 1 % and 10 % shall be regarded as medium risk, and the results with a result value less than 1 % shall be regarded as low risk. The risk results are shown in Fig. 5, and the statistical results are shown in Table 2.
Table 2Statistical results of risk of S&R on Tailgate
Number | Line ID | GAP (mm) | Tolerance (mm) | Relative displacement (mm) | Risk |
1 | 101005 | 2.5 | ±1.0 | 1.68E-01 | 0.00 % |
2 | 103014 | 0.3 | ±0.3 | 1.49E-02 | 0.22 % |
3 | 105002 | 0.3 | ±0.3 | 9.48E-04 | 0.14 % |
4 | 107011 | 0.3 | ±0.3 | 1.29E-02 | 0.20 % |
5 | 109012 | 0.3 | ±0.3 | 1.21E-02 | 0.20 % |
6 | 111002 | 0.5 | ±0.3 | 1.25E-01 | 0.01 % |
7 | 113002 | 3 | ±1.0 | 4.49E-05 | 0.00 % |
8 | 115037 | 3 | ±1.0 | 6.93E-05 | 0.00 % |
9 | 117022 | 3 | ±1.5 | 2.09E-01 | 0.00 % |
10 | 119006 | 0.5 | ±0.3 | 5.66E-03 | 0.00 % |
11 | 121010 | 0.5 | ±0.3 | 8.62E-02 | 0.00 % |
12 | 123030 | 5 | ±2.0 | 2.01E-04 | 0.00 % |
Fig. 5Analysis results of S&R on a tailgate
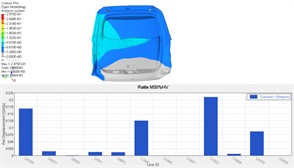
Fig. 6Analysis results of S&R on a tailgate
For the state of interference installation, the calculated relative displacement value greater than the difference between the gap and the lower tolerance is considered high risk, and less than the difference between the gap and the lower tolerance is considered low risk. The interference installation noise test is compared with the data for statistical analysis. The risk location is shown in Fig. 6, and the statistical results are shown in Table 3.
Table 3Statistical results of risk of S&R on Tailgate
Number | Line ID | GAP (mm) | Upper tolerance (mm) | Lower tolerance (mm) | Relative displacement (mm) |
1 | 301008 | 0 | 0 | –0.5 | 0.585 |
2 | 303005 | 0 | 0 | –0.5 | 0.229 |
3 | 305010 | 0 | 0 | –0.5 | 0.365 |
3.2. Experimental verification
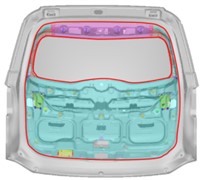
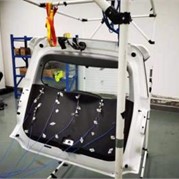
A noise and vibration test was conducted on the VERTICAL PITCH&ROLL+4D device, as shown in Fig. 7. The same test excitation was applied as the simulation, and the microphone was moved in a pre-divided area to test the sound at different points. There was a noticeable knocking noise in the upper left area of the tailgate interior panel, and the time-domain spectrum of the test results is shown in Fig. 8.
Fig. 7Abnormal noise and vibration test
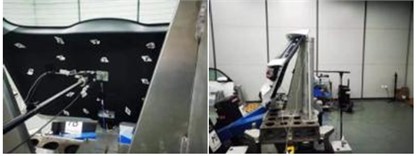
Fig. 8Test results of abnormal noise
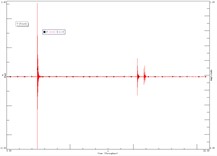
Comparing the test with simulation results, it was verified that there is the same risk of abnormal knocking noise in the upper left area of the door interior panel, indicating the consistency between the test and simulation results. The risk of abnormal noise can be reduced by optimizing the simulation model.
4. Analysis and optimization
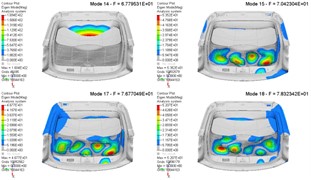
Using the post processing module of BP software, modal contribution analysis was conducted on the risk point Eline301008, as shown in Fig. 9. The modal orders with the highest contribution to the risk position were 14th, 15th, 17th, and 18th orders. The modal cloud diagram is shown in Fig. 10. The corresponding areas have weak support stiffness due to insufficient stiffness in the upper middle area of the tailgate interior panel. Structural optimization is required for this area [10].
Fig. 9Modal contribution analysis of risk points
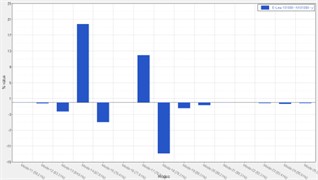
Fig. 10BP modal analysis results
Due to weak support in local areas, a buckle connection was added in the middle of the rear door interior panel, as shown in Fig. 11, and simulation analysis was conducted according to the original working conditions. The analysis results are shown in Fig. 12, and Table 4 shows that the relative displacement at Eline301008 decreased from 0.585 mm to 0.435 mm. The risk level has changed to low risk.
Fig. 11Optimization plan for a tailgate
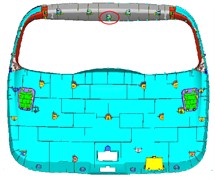
Fig. 12Optimization analysis results of S&R
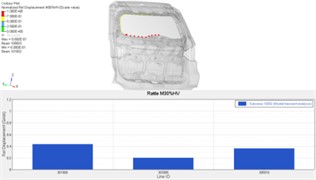
Table 4Results of optimization analysis of S&R
Number | Line ID | GAP (mm) | Upper tolerance (mm) | Lower tolerance (mm) | Relative Disp (mm) | Optimized results (mm) |
1 | 301008 | 0 | 0 | –0.5 | 0.585 | 0.435 |
2 | 303005 | 0 | 0 | –0.5 | 0.229 | 0.201 |
3 | 305010 | 0 | 0 | –0.5 | 0.365 | 0.359 |
5. Conclusions
The paper builds a high-precision tailgate interior trim assembly model, which can obtain the local stiffness of the interior trim panel with the pre-interference position through statics analysis. An interior trim abnormal noise analysis model is built in BP software to analyze the abnormal noise condition, which takes the local stiffness of the interference position into account. Through experimental verification, the simulation analysis results have the same risk location as the experimental results, indicating the applicability of the entire abnormal noise modeling process and the abnormal noise analysis process and risk result evaluation of BP software. Based on the location of the risk occurrence, combined with modal contribution analysis, structural optimization is carried out in BP software to analyze the modal order and position with the greatest contribution to the risk point. By optimizing the corresponding position of the structure, the abnormal noise risk changes from high risk to low risk, demonstrating the effectiveness of the optimization method. The paper achieves the forward development and control of the abnormal noise performance of the tailgate interior assembly through the entire process of modeling, analysis, and optimization, which can effectively save time and cost for later calibration, and build important references and guidance for the development of abnormal noise in the entire vehicle.
References
-
X. J. Ren, Liu and C. Shen, “Research of detection method of automobile interior parts squeak and rattle,” Shanghai Auto, Vol. 297, No. 5, pp. 7–10, 2015. https://doi.org/10.3969/j.issn.1007-4554.2015.05.02
-
X. Jiang and D. P. Qiu, “Improvement of the acoustic performance of vehicle plastic interior parts,” Automotive Engineer, Vol. 252, No. 4, pp. 31–34, 2018, https://doi.org/10.3969/j.issn.1674-6546.2018.04.008
-
Y. Peng, D. Q. Li, and H. Zhang, “Research on abnormal noise control of automobile interior parts,” Automobile Applied Technology, Vol. 46, No. 20, pp. 71–76, 2021.
-
Q. Li, X. D. Gu, G. B. Chang, S. Y. Li, and Y. Yu, “Simulation and optimization of vehicle interior abnormal sound based on SnRD,” Sci-Tech and Development of Enterprise, No. 8, pp. 51–53, 2021, https://doi.org/10.3969/j.issn.1674-0688.2021.08.017
-
Y. C. Li, J. C. Liu, X. D. Gu, Y. L. Wang, and G. B. Chang, “The application of MSA in the S&R simulation of vehicle interior,” Auto Time, No. 2, pp. 7–11, 2021, https://doi.org/10.3969/j.issn.1672-9668.2021.02.002
-
M. Wamsler, “The role of actual modal-contributions versus frequency to optimize the structure,” Engineering with Computers, Vol. 25, No. 2, pp. 131–138, Mar. 2009, https://doi.org/10.1007/s00366-008-0100-7
-
T. Y. Li, Y. R. Zhang, J. Gan, and B. Qiu, “Vehicle acoustic package optimization under engine noise excitation based on NSGA-Ⅱ algorithm,” Machinery Design and Manufacture, No. 5, pp. 72–76, 2021, https://doi.org/10.3969/j.issn.1001-3997.2021.05.017
-
Y. Sha, C. Lu, W. Pan, and S. Chen, “Stability and infinite static stiffness of hydrostatic lead screw compensated with a single-action membrane restrictor,” Nonlinear Dynamics, Vol. 111, No. 11, pp. 9971–9988, Jun. 2023, https://doi.org/10.1007/s11071-023-08379-w
-
T. Li, P. Li, D. Jiang, and B. Qiu, “Squeak and rattle analysis of automotive interiors considering contact nonlinearity,” SAE International Journal of Vehicle Dynamics, Stability, and NVH, Vol. 7, No. 2, pp. 209–220, Apr. 2023, https://doi.org/10.4271/10-07-02-0013
-
M. Bayani, K. Lindkvist, M. Tang, L. Lindkvist, C. Wickman, and R. Söderberg, “Geometric robustness and dynamic response management by structural topometry optimisation to reduce the risk for squeak and rattle,” Design Science, Vol. 8, p. e17, 2022, https://doi.org/10.1017/dsj.2021.26
About this article

The authors have not disclosed any funding.
The datasets generated during and/or analyzed during the current study are available from the corresponding author on reasonable request.
The authors declare that they have no conflict of interest.
