Abstract
Even though we accept that the known history of energy use started with the first fire lit by man, we can see its scientific definition in the vis-viva equation. The phenomenon of energy has been explained by the theories produced as a result of the observations of kinetic events, instead of imitating them from nature. All algorithms developed by human beings to obtain energy work against nature and may cause disruption of the ecological balance. However, non-human alive beings living in the integrity of nature can produce energy in harmony with nature. This study aims to draw attention to this energy conversion process, which we will define as cold energy.

1. Introduction
In physics, the law of conservation of energy states that the total energy in an isolated system does not change and its quantity is said to remain constant over time. Energy can neither be destroyed nor created, but the form of the energy can change. The problems encountered in the concept of energy are energy conservation, losses, and the need for external energy to benefit more from the existing energy.
The light emitted by a bioluminescent organism is produced by the energy released from chemical reactions occurring inside or emitted by the organism. Bioluminescence, the light produced by plants or animals, is much more common in the ocean than on land. In fact, it is estimated that 90 percent of animals living below 500 meters’ depth in the pelagic zone of the ocean are bioluminescent. Common bioluminescent animals in the pelagic zone include fish, squid, shrimp, and jellyfish [1-3].
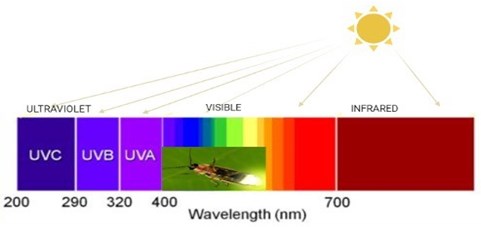
The optical “cousin” of bioluminescence is the fluorescent phenomenon. In fluorescent compounds, energy from one color (i.e. wavelength) of light is converted to another color. Fluorescence is often associated with bioluminescence (Fig. 1).
Although bioluminescence was noticed much earlier, it was first described by Robert Boyle as the emission of light by the living creatures. This light comes in an eye-catching blue-green color. While sea creatures are prone to blue glow, the glow seen in land creatures has a wider color scale (such as yellow, orange, blue, green). The blue-green light emitted by some creatures living in the deep seas and fireflies is formed by the oxidation of luciferin in the presence of the luciferase enzyme. As a result of this oxidation, living things can make radiation [4].
During the bioluminescence event, all chemical energy is converted to light energy, that is, the efficiency is 100 % and there is no heat loss.
Biological radiation event occurs between 400-460 nm wavelengths. Thus, colors such as blue, green, orange, etc., appear. In addition, depending on the wavelength in the water and the type of the luciferin, the radiation in the seas is more blue. Luminous creatures can use these features in nature in ways such as lighting, hunting, camouflage and communication. Anglerfish, vampire squid and some octopus’ species use this glow to scare the predator or attract their prey.
Fig. 1Wavelength sizes and color (created in BioRender.com)
2. Bioluminescence
In the last decades, the use of light emission theory in biological analysis and experiments has increased rapidly [5] and emitted light was followed as a detection strategy. This showed that the type of light emitted varies. Luminescence is the emission of light that is the result of a chemical reaction and is not due to heat generation or a thermal change [6]. This type of light is clearly differing from the light of incandescent bulb, which produces heat and incandescent bulbs heat up during use. Luminescence can be divided into two types:
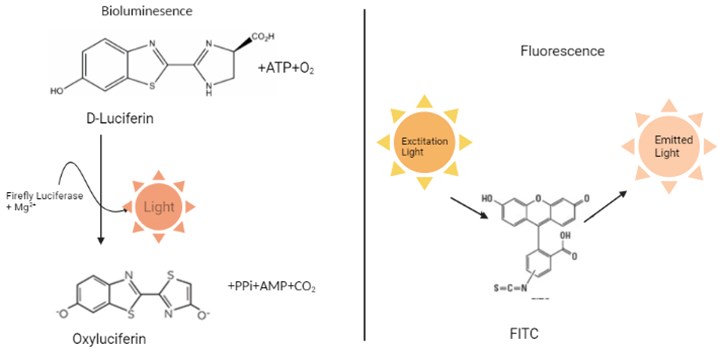
– Light emitted from a biological source: we call it bioluminescence. Again, we see Chemiluminescence, which is light emitted from a non-biological source due to a chemical reaction. Fluorescence, which is the product of a fluorophore, a molecule that emits light at a different wavelength, is another type of emitted light commonly used in biological research that absorbs energy from a light source.
– Although they are seen as close concepts, each contains a difference. Bioluminescence is produced by an enzymatic reaction, which is different from fluorescence, which absorbs excitation energy from a light source (Fig. 2). Both bioluminescence and fluorescence are widely used in scientific applications. However, bioluminescent reporters have a much more sensitive detection capacity and a wider dynamic range compared to fluorescent reporters due to their enzymatic nature [7].
Fig. 2Bioluminescence and Fluorescence process (created in BioRender.com)
3. Bioluminescent reaction
Luciferases likely evolved at many stages throughout evolution, producing enzymes that differed in expression pattern, substrate specificity, cofactor requirement, and enzyme kinetics. As a result of these evolutionary changes, some organisms, such as bacteria and fungi, can emit light continuously, while other organisms emit bioluminescent flashes of varying duration and intensity. For example, luminescence from a dinoflagellate may last 0.1 seconds, while luminescence from jellyfish may last dozens of seconds. The variation in the bioluminescent output of different luciferase enzymes allowed the scientists to classify them according to their output kinetics to accommodate different experimental designs. Luciferase enzymes with flash kinetics have maximum sensitivity due to their high signal intensity, although they degrade rapidly in emitted light. Conversely, enzymes with irradiation kinetics are less sensitive but emit light stably for at least 60 minutes [7].
Luminescence methods, such as time-resolved fluorescence, are used in steady-state techniques and BL kinetic study. For example, it has been applied to understand the mechanism of action of fluorescent dyes, organic oxidizers, organic and inorganic heavy atomic compounds, and metallic salts. There are five most common mechanisms of toxicity produced by exogenous molecules in living organisms:
a) changing the population and energy transfer of electron-excited states;
b) altering the efficiency of the mono-tertiary transformation in the presence of the external heavy atom;
c) variation of the rates of coupled reactions;
d) interactions with enzymes and variation of enzymatic activity;
e) non-specific effects of electron acceptors [8].
3.1. Bioluminescent experimental applications
Bacterial luciferase immobilized systems are used in many fields such as research and clinical laboratories. It can be used to analyze many chemicals and enzymes in the environment.
The properties of the luminescent reagent become stable when the enzymes and cells are immobilized on the solid. Thus, the sensitivity, specificity and stability of light generating systems can be exploited by immobilizing these structures. With this method, many chemical analyzes can be analyzed at low cost. Increasing its sensitivity can be achieved in a micro-environment with high concentrations. In this approach, it functions as a micro-nano sensor [9].
3.2. In vivo imaging
In vivo imaging has the ability to monitor molecular events in live animals such as Mus musculus (Mouse), Rattus norvegicus (Rat), Cavia pocellus (Guinea Pig). Therefore, it is a non-invasive method that is rapidly gaining acceptance in biomedical research. In animal models of disease, cells, pathogens, proteins or other molecules are labeled with bioluminescent luciferases. Its visualization is possible by localized or systemic addition of the substrate. Due to its low wavelength, light can pass through the tissue. The level of penetration depends on the wavelength of the emitted light and the bioluminescence emitted from inside the experimental animal can be detected by a sensitive detection system. However, luciferases that emit light at wavelengths greater than 600 nm have the highest sensitivity for in vivo imaging applications [10].
Luciferase reporters also provide information on the locations and distributions of cells of interest in in vivo monitoring setups on small animals. Especially in stem cell transplantations, bioluminescence reporter genes are used in long-term follow-up of stem cells given to animals. Recently, with the transfer of the gene encoding the luciferase enzyme, transgenic animals (light producing transgenic animals, LPTA or light producing transgenic, LPT) have been started to be produced and these test animals are used in the investigation of cancers, metabolic diseases and infections. Mouse and zebrafish are the most common transgenic animals transformed in this way. Especially in mice, bioluminescence reporter genes placed under the promoters of genes encoding some germline important proteins facilitate in vivo monitoring of the functions of the proteins encoded by the relevant genes [11-14]. Photorhabdus luminescence (Xenorhabdus luminescence) bacterial species is important as a bioluminescent prokaryotic species. In its genome, this bacterium carries the genes encoding the luciferase enzyme called lux and the genes that enable the formation of the aldehyde substrate of this enzyme as an operon (lux operon, luxCDABE). In this operon, luxA and luxB genes encode subunits of the luciferase enzyme, while luxC, luxD and luxE genes encode elements of the multienzyme complex that provides the aldehyde substrate of lux luciferase from fatty acid [13, 15-16]. Today, skin, bone tissue, digestive tract, urinary tract, lung, tooth, middle ear infections are created experimentally on animals with many viruses, bacteria, parasites and yeast species modified with lux CDABE operon or other bioluminescence reporter genes. Thus, the course processes of these infections and their responses to treatment protocols can be followed. With these studies, it is aimed to better understand the development processes of infections and to develop more advanced strategies in the fight against these infections. It is also possible to monitor the expression levels of pathogenic bacterial genes [12-13, 15].
In monitoring setups created for bioluminescence imaging, in the first step, expression vectors that will express the luciferase gene together with the targeted gene are created. As vectors, liposomes, viruses that have lost their ability to infect, adenoviral expression vectors, lentiviral vectors whose expressions can be subsequently induced and mostly used for therapeutic purposes, lamellar vesicles formed from lipopolamine and plasmid DNA are widely used [17-18].
Fig. 3Schematic representation of the in vivo BLU technique applied to small animals: a) In vivo administration of the Luciferin-expressing vector, b) In vivo administration of the bitoluminance substrate, c) reception and processing of data received by imaging
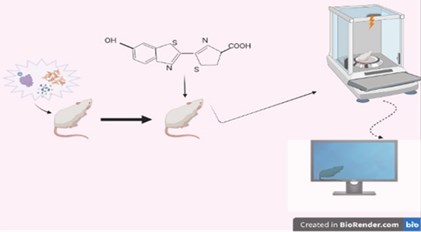
Bioluminescence and fluorescent radiation can be monitored together with the technique called BRET (Fig. 3). It is especially used for in-vivo monitoring of protein interactions that occur in signal production. The protein present in the signal channel is marked with a bioluminescence. It is also marked fluorescently by the protein that comes after it or interacts with it [19].
3.3. Bioluminescent bacteria
By producing bioluminescent bacteria (BLB) on a living organism, their effects can be easily recorded. A bioluminescence (BL) inhibition assay is generally evaluated for its speed and cost advantages and is the first method of choice in applications. The BLB test protocol can be simply applied specifically to liquid samples or extracts. This also allows chemical analyzes to be performed at low cost. The operation of the bioluminescence sensor occurs when the stimulus is present. Although it is difficult for the tests to consist of turbid or colored samples, it allows kinetic analyzes to be analyzed without extraction. With the modifications of this feature, it can be made easier to analyze in solid phase tests. Researchers have shown that assays based on Vibrio Fischeri Bioluminescence are more useful when compared to analyzes involving a wide range of chemicals such as nitrification inhibition, respirometry, and other bacterial tests such as ATP. These analyzes provide relevant results in the toxicity bioanalysis of organisms such as algae, crustaceans and fish, which are mostly in the sea [20-21].
Luminous bacteria can be seen in air, water and land creatures. They are free-living or parasitic [22]. These creatures have been observed by sailors over time and can be monitored with today's satellite technology. These images are the lights that are formed in the form of light filtering or glow extending along the horizon [23]. Bioluminescence is the characteristic of living things seen in 666 of 113 living species. Most of the studies examining these creatures have been on fireflies [24].
3.4. Imaging and tomography
The basis of current nuclear medicine applications is based on a similar mechanism. In order to view the pathophysiological process in living things, it is based on the principle of detecting the annihilation photons emitted from the radiopharmaceutical substance given externally by means of special detectors and creating an image. Current nuclear medicine imaging methods:
– Scintigraphy evaluations; Diagnostic examinations using special radiopharmaceuticals for certain organs. Bone scintigraphy, parathyroid gland, adrenal gland scintigraphy displays with this method.
– A single-photon emission computerized tomography (SPECT) and Positron Emission tomography (PET): These are methods that allow evaluating the functions of organs at the cell level. It is mostly used in the fields of oncology, cardiology and neurology in daily practice. In neurology cases, it is encountered in the diagnosis and follow-up of neurological masses and in the diagnosis and follow-up of neurodegenerative diseases. In craniological applications, it is used in the investigation of coronary artery diseases, in the diagnosis of myocardial infarction and in the evaluation of cardiac functions afterward. For this purpose, glucose, amino acid, hormone molecules and metabolic precursors containing radioactively labeled isotopes (eg Carbon-11 (¹¹C), Fluorine-18 (¹⁸F), Gallium-68 (⁶⁸Ga) etc.) and releasing positrons are used. It is a method of obtaining images by detecting and processing the annihilation photons with 511 keV energy, which are released by the interaction of the positron released from these externally given positron emitting radiopharmaceuticals with the electrons in the body, using NaI(TI) (Sodium Iodide Thallium) crystals. SUV (standardized uptake value) values are used when evaluating the image.
SPECT creates an image with the principle of single photon emission radiating in one direction, while PET creates images with the principle of double-sided photon emission occurring at the same time.
Hybrid imaging (SPECT/PET-CT, SPECT/PET-MR); SPECT or PET imaging, which is used to view the pathophysiological process, allows both anatomical and functional imaging to be combined by obtaining images simultaneously or at different times with CT (computerized tomography) or MRI (Magnetic resonance imaging) in which anatomical information is evaluated, and superposing the obtained images. provides.
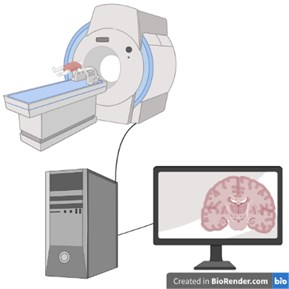
Computerized Tomography: The tomography device consists of a table on which the patient will lie in a circular mechanism called a gantry and a computer system that converts the obtained data into images. In this imaging method, a cross-sectional image of the examined region is obtained with the transmission feature by using X-rays, similar to direct radiography. There is an annular X-ray tube in the gantry and detectors to detect the post-transmission X-ray. During the examination, the rays coming out of the X-ray tube pass through the examined area. Afterwards, the x-ray attenuation value of each point obtained by the photoelectric effect and Compton scattering is measured by the detectors. This value differs between tissues. By taking advantage of this difference, the measured values are processed with analog-to-digital converters and converted into digital data and an image is obtained (Fig. 4).
All these processes are repeated for each section, and in this way, the examined region is displayed cross-sectional.
Natural radiations that occur in the bodies of living things or the radiations that occur due to excitation with light are very important in terms of biological monitoring. First, in 2002, Bhaumik et al. established a bioluminescence monitoring device for mice using the enzyme-substrate system [25].
Fig. 4Computerized Tomography (CT) schematic image (created in BioRender.com)
3.5. Bioluminescent creatures
Various kinds of luciferase enzymes have been discovered to date. The firefly luciferase enzyme is the catalyst for a reaction that glows green in the presence of oxygen and ATP, and its substrate is the D-luciferin compound. D-luciferin is converted into oxyluciferin compound, which makes the main radiation, as a result of a series of reactions. Many forms of luciferase have half-lives limited to a few hours. This leads to the use of these enzymes as reporters in in vivo monitoring setups. These enzymes are particularly useful tools for monitoring the circadian rhythms of living things [12]. Firefly luciferase is an enzyme that catalyzes the oxidation of firefly luciferin, a reaction that results in light emission [26].
Modern theory of the general and specific effects of the microenvironment on emission spectra has been used to explain spectral differences for both natural and mutant forms of insect luciferase, as well as for bioluminescent emitting oxyluciferin in model systems [27].
In previous studies, light levels and enzymes of fireflies were analyzed and their reactions were examined [28-29].
Table 1The peculiarities of the main Luciferase enzymes [12, 25, 30-37]
Name of the bioluminescent enzyme | Species name | Protein size (kDa) | Substrate | Max. emission wavelength (nm) | Color | |
Firefly Luciferase (FLuc) | Photinus Pyralis | 62 | D-Luciferin | 562 | Y | G |
Renilla Luciferase (RLuc) | Renilla Reniformis | 36 | Coelentera zine | 480-482 | B | G |
Gaussia Luciferase (GLuc) | Gaussia Princeps | 19,9 | Coelentera zine | 480-600 nm | B | G |
Bacterial Luciferase (Lux) | Photorhabdus Luminescens | 37-40 | – | 490 | B | G |
Vargula Luciferase (VLuc) | Vargula Hilgendorfi | 62 | Vargulin | 460 | B | V |
Merridia Luciferase | Metridia Longa | 24 | Coelentera zine | 480 | B | G |
NanoLuc (NL) Luciferase | Optophorus Gracilirostris | 19 | Furimazine | 480 | B | B |
Cypridina Luciferase (Cnl.) | Cypridina Noctiluca | –61,5 | Cyprinidid Luciferin | ~460 | B | B |
Y – yellow, B – blue, G – green, V – violet. | ||||||
4. Method
4.1. Sensor design
Proteins that react chemically or physically to light, emit light as a result of the reactions they are exposed to, or reflect the light falling on them in different wavelengths and colors are called “photoactive proteins”. Photoactive proteins can be divided into three groups.
Those in the first group are photoreceptors that cause the living thing they live in to react depending on light exposure. In the second group, there are fluorescent proteins. Molecular fluorescent molecules that reflect the wavelength of the light they are exposed to, and therefore change their color, are called fluorescent radiation. There are various fluorescent dyes that give fluorescent properties to the molecules to which they are attached, and proteins with natural fluorescent properties in living things. In the 1960s, Osamu Shimomura et al. conducted research with the shiny jellyfish Aequorea victoria. And they discovered a protein they called “Aequorin”. Even in the absence of oxygen, this protein reacted with calcium to emit blue light. Green fluorescent protein (GFP), another protein in jellyfish, sometimes absorbs this blue light and emits green light in response. In the third group, enzymes that produce bioluminescent radiation can be mentioned. Luciferin falls into this class.
Bioluminescence, which is the conversion of chemical energy to light in living organisms, depends on two main components, an enzyme, luciferase, and its substrate, luciferin. In insects, the luciferase enzyme has been extensively studied and important enzymological, sequence and structural data are now available.
Firefly luciferase is classified as Photinus-luciferin. Its substrate is firefly luciferin. The reaction requires ATP, oxygen and a metallic cation. It has been seen in the light of crystallographic studies that; The protein has two compact regions, a large N-terminal region and a small C-terminal region, which are joined by a flexible linker peptide that creates a large cleft between the two domains (Fig. 4). Here the C-terminal is delivered tripeptide Serine-Lysine-Leucine responsible for peroxisome targeting. It is assumed that both regions contain amino acid residues on the surface. Mostly amino acid residues can be seen at the N-terminus and only one at the C-terminus. These residues are very important for bioluminescent activity. It produces light that carries only the N-site of the luciferase, which corresponds to 0.03 % of the volume.
Fig. 5N and C terminal, where amino acid residues important for bioluminescent activity are concentrated
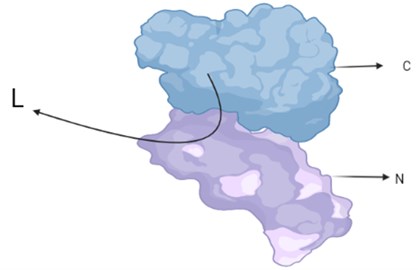
Photinus pyralis luciferase has no substrate in the gap-filling screen. The image shows the large N-terminal domain (N) connected by a short loop (L) to which the small C-terminal domain (C) is attached. The slit between the two domains is visible in the side view (Fig. 5).
The typical emission spectrum for luciferase is in the yellow-green region (550-570 nm), with a peak at 562 nm in basic media (pH ∼ 7.5-7.8) [38].
However, luciferase is a pH sensitive enzyme and acid medium (pH ∼ 5-6) can shift the emission to red (at 620 nm maximum) as well as higher temperatures and heavy metal cations [39]. Conformational changes affecting the active site microenvironment are believed to be responsible for differential color emission [40]. In Luciola cruciata mutant luciferase are remnants of the catalytic state of an “on” expression, which can result in energy loss from the mid-excited state, causing the emission of red light, instead of high-energy yellow-green light [40]
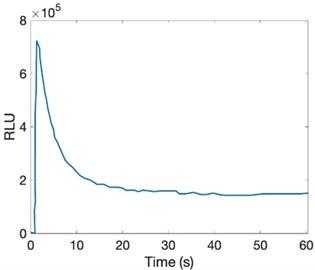
With an increase in light emission intensity in vitro, it decays to low levels within a few seconds under the flash model, even under well-defined conditions. This decay is 5 % different from its initial level. The present substrate, this profile, is due to the formation of inhibitory products during the reaction [41-42].
The in vitro profile of light production by luciferase with high substrate concentrations is D -LH 2 and ATP-Mg 2+ in the µM range. It reaches its maximum velocity in light output, and after its increase, a significant decrease in emission intensity is observed [43-44].
Fig. 6Variation with intensity of light emission in vitro
5. Measurement of light
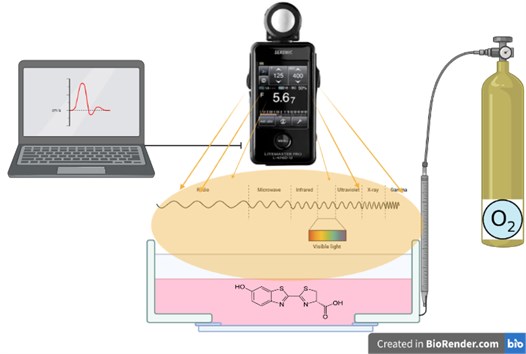
The use of enzymes as sensors requires an interdisciplinary study. In this study, the design of the bioluminance sensor as a measurement system is discussed. It is in an equal container, which contains the enzyme and is freed from the effects of the external environment. Oxygen is contained in the environment at certain intervals and amounts.
It reacts with the oxygen introduced into the system and generates radiation. Light waves are read with a lux-meter. Signals and data are processed with the software and the measurement is performed (Fig. 7).
Fig. 7Evaluation of radiation in bioluminance enzyme
6. Conclusions
In line with academic studies, it can be seen that the Luciferin enzyme can be used as a sensor in ecology. Although bioluminescence is used in tests based on genetically modified bacteria, as well as in studies in biosensor format, it is seen that air values are used in the detection of enzymatic degradation in related studies [45, 46]. In soil-related measurements, studies have been carried out for the detection of General toxicity [47], Bioremediation [48] Inorganic pollutants [49, 50] Organic pollutants [51]. In the protection of water waste and water quality; General toxicity [52-54], Inorganic [55-57] and organic [21, 58, 59] pollutants are observed when used in genotoxicity [60] and seawater measurement [61, 62]. Enzymes play an important role in most biological processes – the transcription and translation of genetic information and signaling, as well as controlling energy transduction. They have a remarkable capacity to accelerate biochemical reactions by many orders of magnitude relative to their uncatalyzed counterparts. In vitro analyzes of these enzymes can be performed and modeled. These studies are recognizable by kinetic and electrical simulations. When these enzymes react with elements such as oxygen or calcium, they can become biosensors that provide quantitative data by measuring the energy they release.
References
-
J. E. Kim, S. Kalimuthu, and B.-C. Ahn, “In vivo cell tracking with bioluminescence imaging,” Nuclear Medicine and Molecular Imaging, Vol. 49, No. 1, pp. 3–10, Mar. 2015, https://doi.org/10.1007/s13139-014-0309-x
-
T. Logsdon, Orbital Mechanics: Theory and Application. John Wiley & Sons, 1997.
-
J. J. Lissauer and I. de Pater, Fundamental Planetary Science: Physics, Chemistry and Habitability. NewYork: Cambridge University Press, 2019, https://doi.org/10.1017/9781108304061
-
F. Tamara. “Exploring Underwater Oases.” 2002, https://oceanexplorer.noaa.gov/explorations/02sab/background/biolum.
-
E. Tunç, “Biyolüminesans ışıma ve biyolüminesans görüntüleme tekniklerinin moleküler biyoloji araştırmaları bakımından önemi,” Cukurova Medical Journal, Vol. 44, No. 4, pp. 1473–1483, Dec. 2019, https://doi.org/10.17826/cumj.535811
-
K. David, The History of Cell Respiration and Cytochrome. Cambridge, 1966.
-
R. S. Negrin and C. H. Contag, “In vivo imaging using bioluminescence: a tool for probing graft-versus-host disease,” Nature Reviews Immunology, Vol. 6, No. 6, pp. 484–490, Jun. 2006, https://doi.org/10.1038/nri1879
-
N. S. Kudryasheva, “Bioluminescence and exogenous compounds: physico-chemical basis for bioluminescent assay,” Journal of Photochemistry and Photobiology B: Biology, Vol. 83, No. 1, pp. 7–86, Apr. 2006, https://doi.org/10.1016/j.jphotobiol.2005.10.003
-
P. R. Coulet, L. J. Blum, In: D. L. Wise, and L. B. Wingard, “Biosensors with Fiber Optics”, 1991.
-
“Thermo Fisher Scientific”, https://www.thermofisher.com/tr/en/home.html
-
M. Yu and Y. Liu, “A QM/MM study on the initiation reaction of firefly bioluminescence-enzymatic oxidation of luciferin,” Molecules, Vol. 26, No. 14, p. 4222, Jul. 2021, https://doi.org/10.3390/molecules26144222
-
L. Mezzanotte, M. van ‘T. Root, H. Karatas, E. A. Goun, and C. W. G. M. Löwik, “In vivo molecular bioluminescence imaging: new tools and applications,” Trends in Biotechnology, Vol. 35, No. 7, pp. 640–652, Jul. 2017, https://doi.org/10.1016/j.tibtech.2017.03.012
-
N. Suff and S. N. Waddington, “The power of bioluminescence imaging in understanding host-pathogen interactions,” Methods, Vol. 127, pp. 69–78, Aug. 2017, https://doi.org/10.1016/j.ymeth.2017.07.001
-
P. Naumov, Y. Ozawa, K. Ohkubo, and S. Fukuzumi, “Structure and spectroscopy of oxyluciferin, the light emitter of the firefly bioluminescence,” Journal of the American Chemical Society, Vol. 131, No. 32, pp. 11590–11605, Aug. 2009, https://doi.org/10.1021/ja904309q
-
P. Avci, M. Karimi, M. Sadasivam, W. C. Antunes-Melo, E. Carrasco, and M. R. Hamblin, “In-vivo monitoring of infectious diseases in living animals using bioluminescence imaging,” Virulence, Vol. 9, No. 1, pp. 28–63, Dec. 2018, https://doi.org/10.1080/21505594.2017.1371897
-
Roberts and Mark A. J., “Recombinant DNA technology and DNA sequencing,” Essays in Biochemistry, Vol. 63, No. 4, pp. 457–468, Oct. 2019, https://doi.org/10.1042/ebc20180039
-
Y. Furuhata, A. Sakai, T. Murakami, A. Nagasaki, and Y. Kato, “Bioluminescent imaging of Arabidopsis thaliana using an enhanced Nano-lantern luminescence reporter system,” PLOS ONE, Vol. 15, No. 1, p. e0227477, Jan. 2020, https://doi.org/10.1371/journal.pone.0227477
-
G. Yang et al., “Development of endothelial-specific single inducible lentiviral vectors for genetic engineering of endothelial progenitor cells,” Scientific Reports, Vol. 5, No. 1, pp. 1–14, Dec. 2015, https://doi.org/10.1038/srep17166
-
C. El Khamlichi, F. Reverchon-Assadi, N. Hervouet-Coste, L. Blot, E. Reiter, and S. Morisset-Lopez, “Bioluminescence resonance energy transfer as a method to study protein-protein interactions: application to G protein coupled receptor biology,” Molecules, Vol. 24, No. 3, p. 537, Feb. 2019, https://doi.org/10.3390/molecules24030537
-
S. Parvez, C. Venkataraman, and S. Mukherji, “A review on advantages of implementing luminescence inhibition test (Vibrio fischeri) for acute toxicity prediction of chemicals,” Environment International, Vol. 32, No. 2, pp. 265–268, Feb. 2006, https://doi.org/10.1016/j.envint.2005.08.022
-
S. Girotti, E. N. Ferri, M. G. Fumo, and E. Maiolini, “Monitoring of environmental pollutants by bioluminescent bacteria,” Analytica Chimica Acta, Vol. 608, No. 1, pp. 2–29, Feb. 2008, https://doi.org/10.1016/j.aca.2007.12.008
-
A. J. Kaeding et al., “Phylogenetic Diversity and cosymbiosis in the bioluminescent symbioses of “Photobacterium mandapamensis”,” Applied and Environmental Microbiology, Vol. 73, No. 10, pp. 3173–3182, May 2007, https://doi.org/10.1128/aem.02212-06
-
S. D. Miller, S. H. D. Haddock, C. D. Elvidge, and T. F. Lee, “Detection of a bioluminescent milky sea from space,” Proceedings of the National Academy of Sciences, Vol. 102, No. 40, pp. 14181–14184, Oct. 2005, https://doi.org/10.1073/pnas.0507253102
-
D. Lapota, C. Galt, J. R. Losee, H. D. Huddell, J. K. Orzech, and K. H. Nealson, “Observations and measurements of planktonic bioluminescence in and around a milky sea,” Journal of Experimental Marine Biology and Ecology, Vol. 119, No. 1, pp. 55–81, Jul. 1988, https://doi.org/10.1016/0022-0981(88)90152-9
-
N. Liu et al., “In vivo optical molecular imaging of inflammation and immunity,” Journal of Molecular Medicine, Vol. 99, No. 10, pp. 1385–1398, Oct. 2021, https://doi.org/10.1007/s00109-021-02115-w
-
M. Okanojo et al., “Attomol-level ATP bioluminometer for detecting single bacterium,” Luminescence, Vol. 32, No. 5, pp. 751–756, Aug. 2017, https://doi.org/10.1002/bio.3246
-
N. N. Ugarova and L. Y. Brovko, “Protein structure and bioluminescent spectra for firefly bioluminescence,” Luminescence, Vol. 17, No. 5, pp. 321–330, Sep. 2002, https://doi.org/10.1002/bio.688
-
T. Muthukumaran, N. V. Krishnamurthy, N. Sivaprasad, and T. Sudhaharan, “Isolation and characterization of luciferase from Indian firefly, Luciola praeusta,” Luminescence, Vol. 29, No. 1, pp. 20–28, Feb. 2014, https://doi.org/10.1002/bio.2470
-
T. Minekawa, H. Ohkuma, K. Abe, H. Maekawa, and H. Arakawa, “Spectral characteristics of the fluorescence in scale worms (Polychatea, Polynoidae),” Luminescence, Vol. 26, p. 167, 2011.
-
B. A. Tannous, D.-E. Kim, J. L. Fernandez, R. Weissleder, and X. O. Breakefield, “Codon-optimized Gaussia luciferase cDNA for mammalian gene expression in culture and in vivo,” Molecular Therapy, Vol. 11, No. 3, pp. 435–443, Mar. 2005, https://doi.org/10.1016/j.ymthe.2004.10.016
-
B. R. Branchini et al., “An enhanced chimeric firefly luciferase-inspired enzyme for ATP detection and bioluminescence reporter and imaging applications,” Analytical Biochemistry, Vol. 484, pp. 148–153, Sep. 2015, https://doi.org/10.1016/j.ab.2015.05.020
-
C. E. Badr, “Bioluminescence imaging: basics and practical limitations,” Methods in Molecular Biology, pp. 1–18, 2014, https://doi.org/10.1007/978-1-62703-718-1_1
-
J. Lee, F. Müller, and A. J. W. G. Visser, “The sensitized bioluminescence mechanism of bacterial luciferase,” Photochemistry and Photobiology, Vol. 95, No. 3, pp. 679–704, May 2019, https://doi.org/10.1111/php.13063
-
M. Bessho-Uehara and Y. Oba, “Identification and characterization of the Luc2-type luciferase in the Japanese firefly, Luciola parvula, involved in a dim luminescence in immobile stages,” Luminescence, Vol. 32, No. 6, pp. 924–931, Sep. 2017, https://doi.org/10.1002/bio.3273
-
Stacer Ac et al., “NanoLuc reporter for dual luciferase imaging in living animals,” Molecular Imaging, Vol. 12, No. 7, pp. 1–13, Oct. 2013.
-
Y. Nakajima, K. Kobayashi, K. Yamagishi, T. Enomoto, and Y. Ohmiya, “cDNA cloning and characterization of a secreted luciferase from the luminous Japanese ostracod, Cypridina noctiluca,” Bioscience, Biotechnology, and Biochemistry, Vol. 68, No. 3, pp. 565–570, Jan. 2004, https://doi.org/10.1271/bbb.68.565
-
R. Gupta, S. Patterson, S. Ripp, M. Simpson, and G. Sayler, “Expression of the photorhabdus luminescens lux genes (luxA, B, C, D, and E) in saccharomyces cerevisiae,” FEMS Yeast Research, Vol. 4, No. 3, pp. 305–313, Dec. 2003, https://doi.org/10.1016/s1567-1356(03)00174-0
-
H. H. Seliger, J. B. Buck, W. G. Fastie, and W. D. Mcelroy, “The spectral distribution of firefly light,” Journal of General Physiology, Vol. 48, No. 1, pp. 95–104, Sep. 1964, https://doi.org/10.1085/jgp.48.1.95
-
H. H. Seliger and W. D. Mcelroy, “The colors of firefly bioluminescence: enzyme configuration and species specificity,” Proceedings of the National Academy of Sciences, Vol. 52, No. 1, pp. 75–81, Jul. 1964, https://doi.org/10.1073/pnas.52.1.75
-
Nakatsu T. et al., “Structural basis for the spectral difference in luciferase bioluminescence,” Nature, Vol. 16, pp. 372–375, 2006, https://doi.org/10.1038/nature0454
-
W. D. Mcelroy, J. W. Hastings, J. Coulombre, and V. Sonnenfeld, “The mechanism of action of pyrophosphate in firefly luminescence,” Archives of Biochemistry and Biophysics, Vol. 46, No. 2, pp. 399–416, Oct. 1953, https://doi.org/10.1016/0003-9861(53)90211-2
-
J. W. Hastings, W. D. Mcelroy, and J. Coulombre, “The effect of oxygen upon the immobilization reaction in firefly luminescence,” Journal of Cellular and Comparative Physiology, Vol. 42, No. 1, pp. 137–150, Aug. 1953, https://doi.org/10.1002/jcp.1030420109
-
S. M. Marques and J. C. G. Esteves Da Silva, “Firefly bioluminescence: A mechanistic approach of luciferase catalyzed reactions,” IUBMB Life, Vol. 61, No. 1, pp. 6–17, Jan. 2009, https://doi.org/10.1002/iub.134
-
A. Meyrat and C. Von Ballmoos, “ATP synthesis at physiological nucleotide concentrations,” Scientific Reports, Vol. 9, No. 1, pp. 1–10, Dec. 2019, https://doi.org/10.1038/s41598-019-38564-0
-
R. Vijayaraghavan et al., “A bioreporter bioluminescent integrated circuit for very low-level chemical sensing in both gas and liquid environments,” Sensors and Actuators B: Chemical, Vol. 123, No. 2, pp. 922–928, May 2007, https://doi.org/10.1016/j.snb.2006.10.064
-
E. Rabbow, P. Rettberg, C. Baumstark-Khan, and G. Horneck, “The Sos-Lux-Lac-Fluoro-Toxicity-test on the International Space Station (ISS),” Advances in Space Research, Vol. 31, No. 6, pp. 1513–1524, Mar. 2003, https://doi.org/10.1016/s0273-1177(03)00086-3
-
M. B. Gu, In: E. Lichtfouse, J. Schwarzbauer, and D. Robert, Environmental Chemistry. Berlin, Heidelberg: Springer Berlin Heidelberg, 2005, p. 691, https://doi.org/10.1007/b137751
-
T. Xu, D. M. Close, G. S. Sayler, and S. Ripp, “Genetically modified whole-cell bioreporters for environmental assessment,” Ecological Indicators, Vol. 28, pp. 125–141, May 2013, https://doi.org/10.1016/j.ecolind.2012.01.020
-
P. Peltola, A. Ivask, M. Åström, and M. Virta, “Lead and Cu in contaminated urban soils: Extraction with chemical reagents and bioluminescent bacteria and yeast,” Science of The Total Environment, Vol. 350, No. 1-3, pp. 194–203, Nov. 2005, https://doi.org/10.1016/j.scitotenv.2005.01.029
-
I. Alkorta, L. Epelde, I. Mijangos, I. Amezaga, and C. Garbisu, “Bioluminescent bacterial biosensors for the assessment of metal toxicity and bioavailability in soils,” Reviews on Environmental Health, Vol. 21, No. 2, pp. 139–152, Jan. 2006, https://doi.org/10.1515/reveh.2006.21.2.139
-
J. G. Bundy, H. Maciel, M. T. D. Cronin, and G. I. Paton, “Limitations of a cosolvent for ecotoxicity testing of hydrophobic compounds,” Bulletin of Environmental Contamination and Toxicology, Vol. 70, No. 1, pp. 1–8, Jan. 2003, https://doi.org/10.1007/s00128-002-0148-9
-
Gary K. Ostrander, Techniques in Aquatic Toxicology. Boca Raton: CRC Press, 2005, https://doi.org/10.1201/9780203501597
-
M. Woutersen, S. Belkin, B. Brouwer, A. P. van Wezel, and M. B. Heringa, “Are luminescent bacteria suitable for online detection and monitoring of toxic compounds in drinking water and its sources?,” Analytical and Bioanalytical Chemistry, Vol. 400, No. 4, pp. 915–929, May 2011, https://doi.org/10.1007/s00216-010-4372-6
-
T. Elad, J. H. Lee, S. Belkin, and M. B. Gu, “Microbial whole-cell arrays,” Microbial Biotechnology, Vol. 1, No. 2, pp. 137–148, Mar. 2008, https://doi.org/10.1111/j.1751-7915.2007.00021.x
-
D. Abd-El-Haleem, S. Zaki, A. Abulhamd, H. Elbery, and G. Abu-Elreesh, “Acinetobacter bioreporter assessing heavy metals toxicity,” Journal of Basic Microbiology, Vol. 46, No. 5, pp. 339–347, Oct. 2006, https://doi.org/10.1002/jobm.200510122
-
George Bullerjahn, “Construction and characterization of a cyanobacterial bioreporter capable of assessing nitrate assimilatory capacity in freshwaters,” Limnology and Oceanography: Methods, Jan. 2005.
-
R. Pedahzur, B. Polyak, R. S. Marks, and S. Belkin, “Water toxicity detection by a panel of stress-responsive luminescent bacteria,” Journal of Applied Toxicology, Vol. 24, No. 5, pp. 343–348, Sep. 2004, https://doi.org/10.1002/jat.1023
-
P. L. Haddix, N. J. Shaw, and M. W. Lechevallier, “Characterization of bioluminescent derivatives of assimilable organic carbon test bacteria,” Applied and Environmental Microbiology, Vol. 70, No. 2, pp. 850–854, Feb. 2004, https://doi.org/10.1128/aem.70.2.850-854.2004
-
Y. S. Kim, H. S. Jung, T. Matsuura, H. Y. Lee, T. Kawai, and M. B. Gu, “Electrochemical detection of 17β-estradiol using DNA aptamer immobilized gold electrode chip,” Biosensors and Bioelectronics, Vol. 22, No. 11, pp. 2525–2531, May 2007, https://doi.org/10.1016/j.bios.2006.10.004
-
J. H. Lee, R. J. Mitchell, B. C. Kim, D. C. Cullen, and M. B. Gu, “A cell array biosensor for environmental toxicity analysis,” Biosensors and Bioelectronics, Vol. 21, No. 3, pp. 500–507, Sep. 2005, https://doi.org/10.1016/j.bios.2004.12.015
-
P. Rettberg et al., Environmental Chemistry: Green Chemistry and Pollutants in Ecosystems. Berlin: Springer, 2005, https://doi.org/10.1007/b13775
-
D. Porta, G. S. Bullerjahn, M. R. Twiss, S. W. Wilhelm, L. Poorvin, and R. M. L. Mckay, “Determination of Bioavailable Fe in Lake Erie Using a Luminescent Cyanobacterial Bioreporter,” Journal of Great Lakes Research, Vol. 31, pp. 180–194, Jan. 2005, https://doi.org/10.1016/s0380-1330(05)70313-0
About this article

This is research work is funded by The Scientific Research Project Program of Marmara University (Project No. FYL-2022-10619).
The datasets generated during and/or analyzed during the current study are available from the corresponding author on reasonable request.
Burak Yağdıran: investigation, project administration, resources, writing – original draft preparation. Sezgin Ersoy: formal analysis, methodology, software, validation, writing – original draft preparation conceptualization, data curation, investigation, project administration, visualization, writing – review and editing. Büşra Nur Gültekin: formal analysis, methodology, software, validation. Melis Yağdıran: investigation, methodology, resources, validation, writing – review and editing.
The authors declare that they have no conflict of interest.
