Abstract
The measurement of instantaneous speed is often used in the vibration and noise control of equipment. This paper designs an instantaneous speed measurement method based on A/D sampling method. This method mainly obtains the instantaneous speed indirectly by obtaining the square wave signal. The experimental results show that this method is simple and feasible, and provides a reference for the establishment of instantaneous speed measurement system.
1. Introduction
Rotational speed is an important basis for engine comprehensive performance detection, and its measurement is also an important link in engine research. In fact, the change of speed has a certain law. The fluctuating speed contains very rich information, which can comprehensively reflect the operating state of the engine when it is working. In the industries of engine maintenance and fault diagnosis, the measurement of speed is of great practical significance [1-4]. Among them, the instantaneous speed contains very rich information, which makes it an effective means and tool for engine performance detection and fault judgment.
Among the many methods of instantaneous speed measurement, the clock or timer pulse counting method and A/D sampling method are commonly used according to the different measurement hardware. The clock or timer pulse counting method counts the square wave signal of the speed sensor with the high-frequency pulse square wave signal generated by the clock or timer to measure the speed. Its characteristics are that it needs to build a hardware circuit, less measurement data and poor expansibility. The A/D sampling method uses industrial computer and data acquisition card to sample the speed sensor to obtain the speed waveform, and uses software algorithm to realize the speed measurement function [5]-[8]. Its characteristics are no need to build hardware circuit, large measurement data and good expansibility.
In this paper, an instantaneous speed measurement system based on industrial computer and data acquisition card is built to measure the instantaneous speed of small hydraulic motor. The principle of this method is to collect the square wave periodic signal with amplitude of 11.5 V generated by the magnetoelectric speed sensor through A/D sampling method, and use the square wave periodic signal to design a software counting algorithm to count the sampling points of a single square wave, so as to measure the instantaneous speed.
2. Measuring principle
The signal output diagram of magnetoelectric sensor is presented in Fig. 1.
As can be seen from the figure, when the shaft rotates, the rotating gear teeth pass through the fixed sensor in turn. Due to the electromagnetic induction effect, high voltage is generated when the tooth top passes through the sensor, and low voltage is generated when the tooth groove passes through. The generated sinusoidal like voltage signal is filtered, amplified and shaped by the signal conditioning circuit inside the sensor and converted into a square wave voltage signal with an amplitude of 11.5 V.
The measured instantaneous speed can be expressed by Eq. (1):
where is the instantaneous frequency of the square wave signal output by the speed sensor; is the number of teeth of the speed measuring gear, and its value is 30.
Then can be expressed by Eq. (2):
where is the period of a square wave signal.
The period of a single square wave signal collected by A/D sampling method is presented in Fig. 2.
Fig. 1A schematic diagram of signal output of magnetoelectric sensor
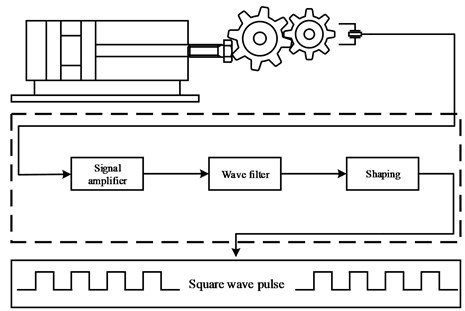
Fig. 2A schematic diagram of square wave signal period
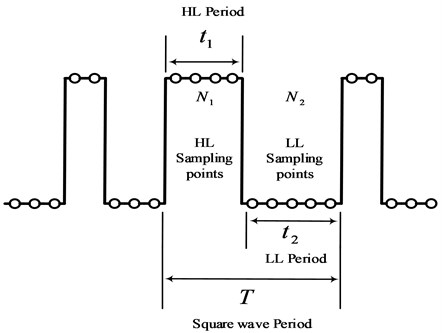
The period of a single square wave signal is:
where is the elapsed time of high level, is the elapsed time of low level.
The instantaneous frequency can also be expressed as follows:
where is the number of sampling points in a single periodic square wave signal, is the sampling frequency set in the measurement and control software of industrial computer.
The number of sampling points of a single square wave period is:
where is the number of sampling points of single period square wave high level, is the number of sampling points of single period square wave ground level.
From Eq. (1-4):
The sampling points obtained by A/D sampling method are and sampling frequency relevant equal time interval sampling points. It can be seen from Eq. (6) that and are constants. Therefore, as long as the value of is measured, the instantaneous speed can be measured.
The flow chart of the test algorithm is presented in Fig. 3.
Fig. 3A flow chart of test algorithm
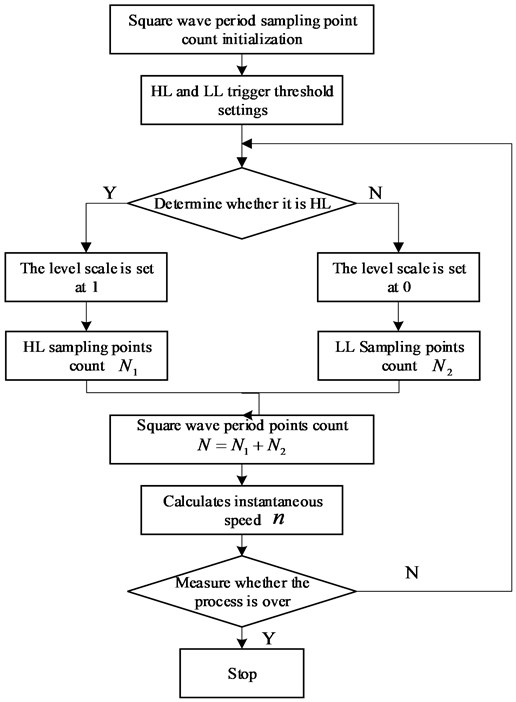
The high level sent by the speed sensor is a square wave voltage signal with an amplitude of 11.5 V. Set the threshold between 8 and 11.5 V to 9.75 V to judge whether the sampling point is at low level or high level. If the voltage value is less than the threshold value and it is judged as low level, the corresponding low level counter works, starts counting the number of sampling points, and the flag bit value of the level is set to 0. If the voltage value is greater than the threshold, it is judged as high level, the corresponding high level counter works, starts counting the number of sampling points, and the flag bit value of the level is set to 1. After getting the number of high-level sampling points and number of low-level sampling points , the number of sampling points of a single square wave voltage signal can be obtained by substituting into Eq. (5), and then the instantaneous speed can be obtained by substituting into Eq. (6). As long as the measurement process does not stop, the above process continues to cycle, so that the instantaneous speed of each square wave signal can be measured until the measurement process stops.
3. Experimental design
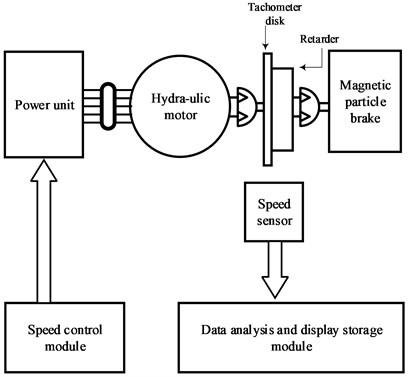
The experimental device for instantaneous speed measurement is presented in Fig. 4.
The speed measuring gear is installed on the output shaft of the hydraulic motor. The hydraulic system is a variable speed open hydraulic system, and the power source is permanent magnet synchronous AC servo controller and quantitative gear pump. By adjusting the engine speed and changing the flow of the hydraulic system, the speed of the small diesel engine is changed. The hardware of the whole measurement and control system is based on industrial computer and data acquisition card, and the measurement and control program is compiled by LabVIEW. The collected square wave signal is realized by using the speed measurement algorithm in Fig. 3. This process is programmed in MATLAB.
Fig. 4A schematic diagram of instantaneous speed measurement experimental device
4. Conclusions
The control mode is speed open-loop control. The speed of the hydraulic motor changes with the speed of the motor. The sampling frequency of the data acquisition card is set to 50 kHz in LabVIEW software.
In this process, the traditional monitoring method is connected to the API-1 test port and the monitoring method is proposed to the api-2 test port. At the same time, the monitoring process is started and two groups of test windows are generated; After 60 s of window operation, 10 groups of monitoring data of 2 groups of test windows are intercepted instantaneously, and the data time interval is 0.18 s; The intercepted data is collated and compared with the background data of MATLAB to generate a test report which is presented in Table 1.
Table 1Comparison of effectiveness test data of instantaneous speed detection technology
Traditional technology speed measurement rain/s | A/D acquisition method speed measurement rain/s | Background speed rain/s |
2530 | 2734 | 2746 |
2624 | 2827 | 2834 |
2426 | 2658 | 2661 |
2353 | 2578 | 2582 |
2365 | 2558 | 2560 |
2978 | 3056 | 3060 |
2987 | 3108 | 3112 |
3024 | 3134 | 3140 |
3078 | 3168 | 3175 |
3062 | 3160 | 3166 |
Through the comparison of revolutions in Table 1, it can be seen that the value obtained by the proposed monitoring technology is closer to the actual revolutions, and under the same time interval, the fluctuation between the monitoring values is small and the stability is better.
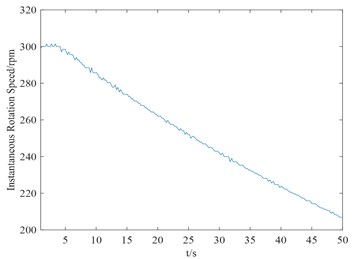
Figs. 5-7 described the whole time history and the waveforms of 2-2.5 seconds pulse signal and speed signal, as well as the waveforms from steady-state operation to shutdown of the equipment. The above phenomenon confirms that the instantaneous speed is proportional to the instantaneous frequency of the periodic square wave voltage signal. So as long as the instantaneous frequency or period of periodic square wave voltage signal is measured, the instantaneous speed value can be obtained.
Fig. 5Waveform diagram of pulse signal
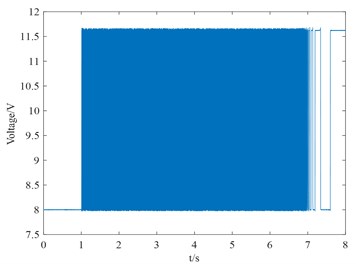
a) Whole time

b) 2-2.5 s
Fig. 6Waveform of speed signal
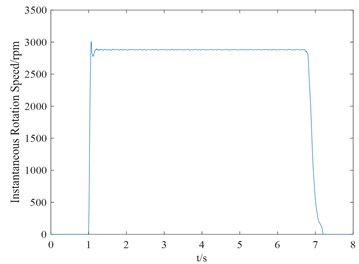
a) Whole time
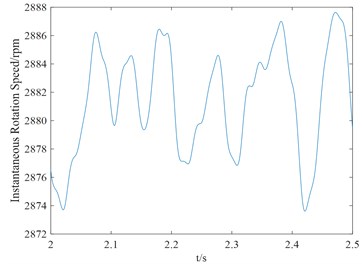
b) 2-2.5 s
Fig. 7Time history diagram of steady-state operation shutdown speed of the equipment
References
-
T. Lan, H. Hu, C. Jiang, G. Yang, and Z. Zhao, “A comparative study of decision tree, random forest, and convolutional neural network for spread-F identification,” Advances in Space Research, Vol. 65, No. 8, pp. 2052–2061, Apr. 2020, https://doi.org/10.1016/j.asr.2020.01.036
-
D. Kazienko and L. Chybowski, “Instantaneous rotational speed algorithm for locating malfunctions in marine diesel engines,” Energies, Vol. 13, No. 6, p. 1396, Mar. 2020, https://doi.org/10.3390/en13061396
-
Charchalis. A. and Dereszewski. M., “Monitoring of instantaneous angular speed of the crankshaft for control of the ship engine performance changes,” Diagnostyka, Vol. 60, No. 4, pp. 53–58, 2011.
-
A. Gisbrecht, A. Schulz, and B. Hammer, “Parametric nonlinear dimensionality reduction using kernel t-SNE,” Neurocomputing, Vol. 147, No. 1, pp. 71–82, Jan. 2015, https://doi.org/10.1016/j.neucom.2013.11.045
-
H.-K. Kim, J.-H. Nam, J.-S. Hawong, and Y.-H. Lee, “Evaluation of O-ring stresses subjected to vertical and one side lateral pressure by theoretical approximation comparing with photoelastic experimental results,” Engineering Failure Analysis, Vol. 16, No. 6, pp. 1876–1882, Sep. 2009, https://doi.org/10.1016/j.engfailanal.2008.09.028
-
Y. H. Yu and J. G. Yang, “Research on simulation model for instantaneous angular speed of marine diesel engine,” Transactions of CSICE (Chinese Society for Internal Combustion Engines), Vol. 26, No. 6, pp. 550–555, 2008.
-
Timoshenko S. P. and Goodier J. N., Theory of elasticity. Beijing: Tsinghua University Press, 2004.
-
M. S. Wang and M. Q. Shen, “Virtual coder design and rotation speed measurement,” Chinese Journal of Scientific Instrument, Vol. 29, No. 6, pp. 1300–1305, 2008.
About this article

