Abstract
Almaty is the largest city in the Republic of Kazakhstan, population is almost 2,0 million persons. The atmospheric air pollution is the most important environmental problem in this city. The main sources of the atmospheric air pollution are: emissions of the motor transport, emissions of the heating power plants (HPP), which use the solid fuel, emissions of the other industrial enterprises as well as emissions of the heating devices used in the private sector. According to the design data, motor transport makes the main input into the formation of total amount of the emissions. At the same time, some experts and public representatives periodically doubt the priority significance of the motor transport emissions for formation of level of the atmospheric air pollution at the residential areas. Analysis of possible interconnection between the changes in the transport flow on Almaty roads and level of the atmospheric air pollution at the residential areas in the area of influence is conducted based on the data provided by the posts of the automatic continuous observations, which belong to LLP “ECOSERVICE-C”. Winter period of the year 2022 was selected for evaluation of level of the pollutants’ content in the atmospheric air. During this period heating power plants HPP-1 and HPP-2, as well as heating devices of the private sector were operated day-and-night under maximum load. It was found out that level of content of fine-dispersed particles РМ10 and РМ2,5, as well as NO2 and СО increases in the atmospheric air, when the intensity of the motor transport movement grows. The results of monitoring during the period of January 5th – 9th, 2022, when the transport movement was limited due to introduction of the curfew regime, is the sound argument, which gives the evidence on the motor transport role in the atmospheric air pollution. According to the expert evaluations, during this period only about 20-30 % of the available motor transport were operated. At the same time, heating power plants HPP-1, HPP-2 and HPP-3, boiler houses, heating devices of the private sector worked at full capacity. During this period, based on the data provided by the air monitoring stations, which belong to LLP “ECOSERVICE-C”, the abrupt reduction of all pollutants, measured in the air, was observed. The environmental assessment of effectiveness of the measures directed on reduction of the pollutants’ emissions in Almaty, was conducted. Withdrawal of the diesel motor transport from the city allows reduction of the emissions. Practically complete elimination of emissions of solid particles РМ10 and РМ2,5 is the main effect of the diesel motor cars’ prohibition. Use of the electric motor transport and compressed natural gas (CNG) will give the significant influence on the emissions’ reduction. Such measures are the most perspective as regards the motor transport. Limitation by days of access for the motor transport with even and odd numbers will give the largest qualitative effect in reduction of the pollutants emitted by the motor transport (by 55,5 %). Prohibition to manufacture the passenger cars with ecological class up to Euro 4 and their replacement by ecological classes Euro 5-6 will result in the emissions’ reduction by 40,9 %.
1. Introduction
The atmospheric air pollution is one of the most important problems in development of the modern large cities. The city of Almaty is the largest economic, cultural and scientific center of the Republic of Kazakhstan with population amounted to 2,0 million persons and developed industry, transport and infrastructure. Based on the data of Project “World index of the air quality”, the city of Almaty, as regards the degree of the air pollution, estimated by AQI scale, the USA, periodically becomes one of the most contaminated cities in the world [1].
Specific geographic and meteorological conditions of the city, low level of the air exchange supports the pollutants’ accumulation in the air medium and smog formation. Heating power plants, for which coal is used, heating devices of the private sector, for which solid fuel is used, as well as the motor transport emissions are the main sources of the atmospheric air pollution. At that, the motor transport emissions amount to more than 60 % of total gross emissions of the city. Maximum polluted areas of the city’ territory are mainly confined to the areas of intensive movement of the motor transport [2].
Status of the environment and atmospheric air in the city of Almaty is constantly controlled by the municipal environmental protection service and Akimat of the city. The decisions are made, and wide range of different measures, directed on reduction of negative impact on the environment made by the motor transport, industrial enterprises and private sector, are taken. But, notwithstanding the taken measures, the air pollution remains the most important environmental problem in the city of Almaty.
It is necessary to point out that some experts and public community periodically doubt in significance of the motor transport emissions, being the most important reason for low indexes of the atmospheric air quality at the residential areas of Almaty [3]. Negation of priority of measures, to be taken to reduce the motor transport emissions, may have the negative impact on the environmental situation.
The given study, realized within the Project “Monitoring of the target indexes of the environmental quality in the city of Almaty” (according to the task of the Department on green economy of Almaty Akimat), is directed on determination of amounts of the motor transport emissions, evaluation of changes in the pollutants’ content in the areas of the motor roads’ influence during 24 hours and during the period of introduction of the curfew regime at January 6 – 11, 2022, as well as ranking of the environmental effects from different measures, targeting on the reduction of the pollutants emitted by the motor transport.
2. Methods
To assess the influence of the motor transport emissions into the city’ atmospheric air the calculations of the pollutants’ quantity emitted by the road transport were done in accordance with the methods developed based on the International Methods on inventory of harmful substances’ emissions EMEP/ EEA (CORINAIR), computer software for calculation of the emissions created by the road transport COPERT-5, taking into account the structure and status of the motor transport fleet in the city of Almaty [4-6]. The calculated emissions include the adjustable (regulated) (CO, NOx, СН, PM) and unregulated pollutants (СО2, N2O, NH3, SO2, non-methane hydrocarbons НМVОС). Assessment of the actual level of the pollutants’ content in the atmospheric air (РМ10, РМ2,5, NO2, СО) is conducted based on the data provided by the monitoring – observation stations, which belong to LLP “ECOSERVICE-C”, located in different districts of Almaty in accordance with the Akimat task.
3. The study’ results
According to the data of Almaty Police Department, at November 2021 533230 units of the motor transport were registered in the city. Including: passenger cars – 485924 units (91,1 % of total number of the motor transport), buses – 8987 units (1,7 %), trucks – 32044 units (6,0 %), special machinery – 641 units (0,1 %) and motorcycle transport – 5634 units (1,0 %).
Amount of the harmful pollutants emitted by the motor transport in the city in the year 2022 (annual designed amount of the emissions) may be 42843 tons. The main amount of harmful emissions accounts for the share of carbonic oxide CO 30385 tons (71,0 % of total amount). Emissions of nitrogen oxides NOX will amount to 5396 tons (12,6 %), hydrocarbons СН(VOC) – 3177 tons (7,7 %), non-methane hydrocarbons NMVOC – 2889 tons (6,7 %), sulphur dioxide SO2 – 805 tons (1,8 %), solid particles РМ2,5 and РМ10 – 191 tons (0,4 %).
According to the data of the monitoring network of RSE “Kazhydromet”, level of the atmospheric air pollution in the city in the year 2021, in general, is estimated as being high. Maximum-one-time concentrations amounted to: suspended solids (dust) – 1,4 MPCmaximum-one-time, suspended solids РМ-2,5 – 6,3 MPCmaximum-one-time, suspended solids РМ-10 – 3,3 MPCmaximum-one-time, sulphur dioxide – 9,8 MPCmaximum-one-time, carbonic oxide – 6,3 MPCmaximum-one-time, nitrogen dioxide – 5,3 MPCmaximum-one-time, nitrogen oxide – 2,5 MPCmaximum-one-time, phenol – 1,2 MPCmaximum-one-time, ozone – 3,9 MPCmaximum-one-time. Average concentrations amounted to: suspended solids (dust) – 1,0 MPCaverage daily, suspended solids РМ2,5 – 1,0 MPCaverage daily, nitrogen dioxide – 2,0 MPCaverage daily, nitrogen oxide – 1,0 MPCaverage daily, formaldehyde – 1,2 MPCaverage daily [7].
To analyze possible interconnection between changes in the transport flow on the busy streets of Almaty and level of the atmospheric air pollution the data of the automatic continuous monitoring stations, which belong to LLP “ECOSERVICE-C”, were used. The monitoring stations, located near the motor roads with intensive motor transport movement, were selected for such analysis. The results of monitoring of the atmospheric air quality at the ecological stations allow assuming the connection between growth of the pollutants’ content during 24 hours and increase of the motor transport number on the road. The winter period was selected to evaluate the daily changes in the pollutants’ contents in the atmospheric air. During this period heating power plants HPP-1 and HPP-2, as well as the heating devices of the private sector are operated day-and-night under maximum load.
Figs. 1 and 2 provide the graphs of changes in concentrations of solid particles РМ10 and РМ2,5 in the air during 24 hours at observation station No. 5, located near the road with intensive motor transport movement – Raimbek avenue. There the average daily MPC of the pollutants are given for comparison.
Fig. 1Concentration of РМ10 in the air at automated observation station No. 5 (Raimbek av., January 22nd, 2022)
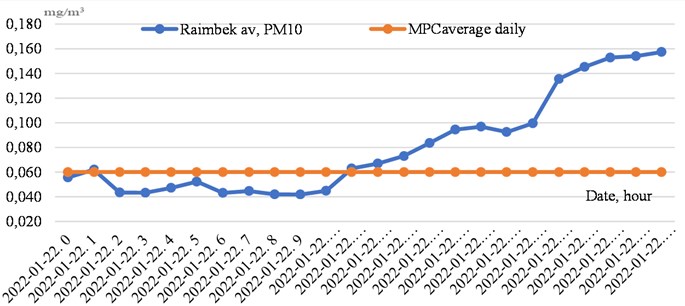
According to the given graphs, content of РМ10 and РМ2,5 in the atmospheric air near automated observation station No. 5 exceeds the permissible average daily values.
It is necessary to point out that increase of content of fine-dispersed particles in the atmospheric air occurs after 10:00 – 11:00 a.m., achieving maximum values after 21:00 p.m. Fig. 3 contains the changes in NO2 concentrations during 24 hours at the given station.
Fig. 2Concentration of solid particles РМ2,5 in the air at station No. 5 (Raimbek av., January 22nd, 2022)
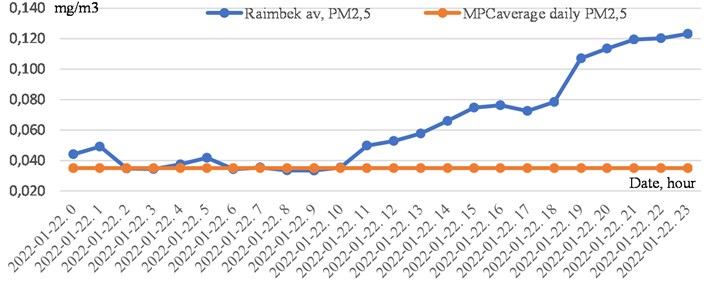
Fig. 3Concentration of NO2 in the air at automated observation station No. 5 (Raimbek av., January 22nd, 2022)
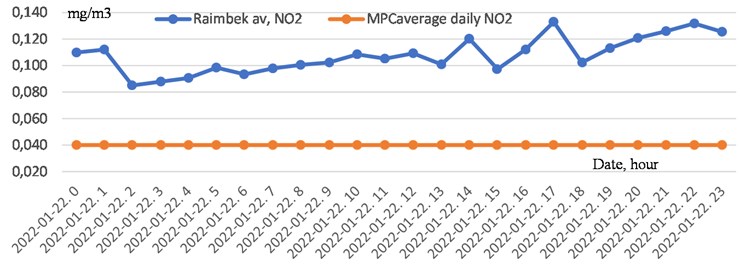
According to Fig. 3, content of NO2 in the atmospheric air at automated observation station No. 5 exceeds the permissible average daily values.
Content of NO2 in the atmospheric air is also subject to variations during 24 hours, though it is not so pronounced. So, after 14:00-15:00 p.m. gradual increase of values of the found-out concentrations may be pointed out.
This is explained by the advent of the motor transport on the streets and emissions during daytime as well as by gradual accumulation of the pollutants emitted by the road transport in the air.
The results of monitoring during the period of January 5th-9th, 2022 is the sound argument, which gives the evidence on the motor transport role in the atmospheric air pollution.
During the period of January 5th-9th, 2022, due to introduction of the curfew regime, the transport movement was limited. According to the expert evaluations, during this period only about 20-30 % of the available motor transport were operated. At the same time, heating power plants HPP-1, HPP-2 and HPP-3, boiler houses, heating devices of the private sector worked at full capacity.
The unique possibility was given to estimate practically the role and influence of the motor transport emissions on the atmospheric air pollution in the city.
During this period, based on the data provided by the air monitoring stations, which belong to LLP “ECOSERVICE-C”, the abrupt reduction of all pollutants, measured in the air, was observed. So, in the central part of the city the pollutants’ average concentrations were lower or insignificantly exceeded maximum permissible concentrations (MPC). In the other districts of the city the pollutants’ average concentrations didn’t exceed MPC.
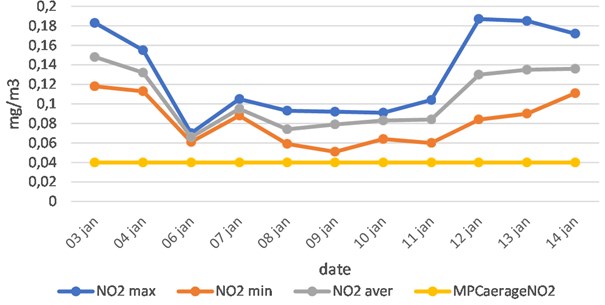
Table 1 and Fig. 4-6 provide the pollutants’ concentrations in the air during the period from January, 3rd till January, 14th, 2022 at ecological station No. 5 (Raimbek avenue). The data received during the curfew regime (January, 6th-11th), before the introduction of the curfew regime (January, 3rd-4th) and after cancellation of the curfew regime (January, 12th-14th, 2022) are given for comparison.
For comparison, data for 3 time periods are given, during the curfew time between January 5th and 11th, prior to the introduction of the curfew between January 3rd and 4th, and after the lifting of the curfew between January 12th and 14th in the year of 2022. During the curfew (January 5-11), the average concentrations of solid pollutants PM10 in the air (0.031-0.65 mg/m3) decreased by 2-3 times compared to the concentrations of PM10 (0.071-0.130 mg/m3) before and after the curfew (January 3-4 and January 12-14), when vehicles were fully operational with the corresponding emissions. There was a decrease in the average concentrations of other pollutants in the air: solid substances PM2.5, carbon monoxide CO, and nitrogen dioxide NO2.
During those days of the winter season, the most dangerous, in terms of climatic conditions, are the main harmful substances such as PM2.5, PM10 and NO2 (Table 2).
Based on the results of the analysis, it can be concluded that vehicle emissions have a major contribution to the exceeding levels of urban air pollution with harmful substances.
Table 1The pollutants’ concentrations in the air during the period from January, 3rd till January, 14th, 2022 at ecological station No. 5, Raimbek avenue
Date of observation | The pollutants’ concentrations in the air, mg/m3 | ||||||||
РМ10 | NO2 | СО | |||||||
Max. | Min. | Aver. | Max. | Min. | Aver. | Max. | Min. | Aver. | |
January, 03rd, 2022 | 0,196 | 0,024 | 0,071 | 0,183 | 0,118 | 0,148 | 0,331 | 0,03 | 0,178 |
January, 04th, 2022 | 0,089 | 0,012 | 0,034 | 0,155 | 0,113 | 0,132 | 0,395 | 0,02 | 0,151 |
January, 06th, 2022 | 0,034 | 0,025 | 0,031 | 0,07 | 0,061 | 0,066 | 0,032 | 0,03 | 0,031 |
January, 07th, 2022 | 0,105 | 0,041 | 0,065 | 0,105 | 0,088 | 0,095 | 0,09 | 0,03 | 0,054 |
January, 08th, 2022 | 0,095 | 0,014 | 0,052 | 0,093 | 0,059 | 0,074 | 0,07 | 0,03 | 0,04 |
January, 09th, 2022 | 0,086 | 0,023 | 0,062 | 0,092 | 0,051 | 0,079 | 0,063 | 0,03 | 0,041 |
January, 10th, 2022 | 0,06 | 0,039 | 0,051 | 0,091 | 0,064 | 0,083 | 0,066 | 0,03 | 0,052 |
January, 11th, 2022 | 0,081 | 0,033 | 0,053 | 0,104 | 0,06 | 0,084 | 0,09 | 0,03 | 0,054 |
January, 12th, 2022 | 0,208 | 0,071 | 0,113 | 0,187 | 0,084 | 0,13 | 0,551 | 0,028 | 0,23 |
January, 13th, 2022 | 0,186 | 0,014 | 0,082 | 0,185 | 0,09 | 0,135 | 0,542 | 0,03 | 0,227 |
January, 14th, 2022 | 0,134 | 0,019 | 0,066 | 0,172 | 0,111 | 0,136 | 0,452 | 0,035 | 0,181 |
Table 2The pollutants’ concentrations in the air during the period from from January 21 to February 14, 2022 at the ecological station No. 5, Raimbek avenue
Date of observation | The pollutants’ concentrations in the air, mg/m3 | ||||||||
РМ10 | NO2 | СО | |||||||
Max. | Min. | Aver. | Max. | Min. | Aver. | Max. | Min. | Aver. | |
January, 21rd, 2022 | 0,088 | 0,014 | 0,054 | 0,146 | 0,082 | 0,113 | 0,167 | 0,030 | 0,086 |
January, 22th, 2022 | 0,157 | 0,040 | 0,081 | 0,133 | 0,082 | 0,107 | 0,266 | 0,030 | 0,079 |
January, 23th, 2022 | 0,204 | 0,070 | 0,102 | 0,137 | 0,107 | 0,121 | 0,345 | 0,040 | 0,098 |
January, 29th, 2022 | 0,153 | 0,029 | 0,077 | – | – | – | – | – | – |
January, 30th, 2022 | 0,171 | 0,017 | 0,094 | 0,148 | 0,072 | 0,119 | 0,528 | 0,030 | 0,124 |
February, 12th, 2022 | 0,106 | 0,014 | 0,063 | 0,180 | 0,079 | 0,127 | 0,239 | 0,030 | 0,100 |
February, 14th, 2022 | 0,091 | 0,013 | 0,054 | 0,182 | 0,099 | 0,138 | 0,369 | 0,030 | 0,102 |
In order to reduce the pollutants’ amounts emitted by the motor transport and to improve the atmospheric air’ quality, Akimat and public society of the city consider the following measures to be realized in the nearest years and in the perspective:
– staged withdrawal and prohibition to use diesel motor transport on the territory of the city;
– introduction of prohibition to use gasoline transport with emission at the level below Euro 5;
– in perspective – complete prohibition to use gasoline and diesel transport in the city;
– use of motor transport operated with compressed natural gas (CNG);
– development of electric transport, electric cars and electric buses;
– limitation by days in use of motor transport with even and odd numbers;
– toughening of control on the motor transport’ toxicity and smoking.
Fig. 4Concentrations of РМ10 in the air during the period from January, 3rd till January, 14th, 2022, at ecological station No. 5 (Raimbek av.)
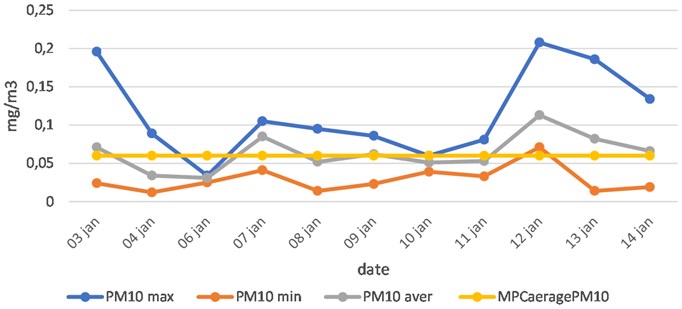
Fig. 5Concentrations of СО in the air during the period from January, 3rd till January, 14th, 2022, at ecological station No. 5 (Raimbek av.)
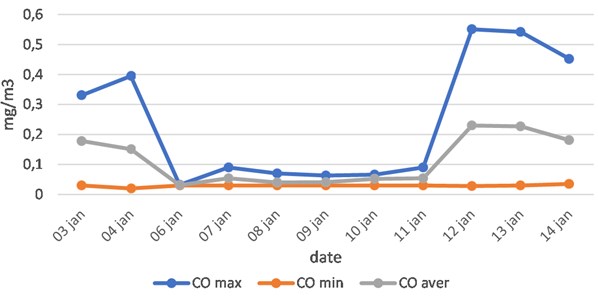
Fig. 6Concentrations of NO2 in the air during the period from January, 3rd till January, 14th, 2022, at ecological station No. 5 (Raimbek av.)
The effectiveness of measures on reduction of the pollutants’ emissions was evaluated in order to rank the priority of the given measures. For this purpose the pollutants’ emissions were calculated for each of the proposed measures. The comparative emissions of the pollutants produced by the motor transport in case of the measures’ realization are given in Table 3.
Table 3Comparative emissions of the pollutants produced by the motor transport
No. | Conditions of the motor transport’ operation | Number of motor transport, units | Emissions, tons/year | Relative emissions, % |
1 | All motor transport registered in the city (2021) | 513938 | 43901 | 100 |
Including: | ||||
1.1 | Diesel buses | 4157 | 2476 | 5,7 |
1.2 | Buses operated using CNG | 515 | 316,9 | 0,8 |
1.3 | Diesel trucks | 21318 | 1874 | 4,3 |
1.4 | Passenger cars | 458317 | 30198 | 68,8 |
In case of the measures’ realization | ||||
2 | Replacement of diesel buses (public transport) by buses operated using CNG | 2000 | 1230 | 2,8 |
3 | Replacement of diesel buses by electric buses | 1000 | 1168 | 2,6 |
4 | Limitation in access for motor transport with even and odd numbers by 50 % | 250136 | 24345 | 55,5 |
5 | Limitation in using of passenger cars with ecological class below Euro 4 and their replacement by cars of ecological classes Euro 5-6 | 328592 | 17948 | 40,9 |
Control of the motor transport’ emissions | ||||
6 | Motor transport with emissions exceeding the standards in the exhaust gases* | 77090 | 7719 | 17,5 |
Replacement of diesel buses (public transport) by buses operated using CNG allows reduction of the emissions by 1230 tons or 2,8 % of total emissions in the city. In case of complete prohibition of diesel motor transport is possible to reduce the emissions by 2476 tons or 5,7 %. But the main effect from prohibition of diesel motor transport is practically complete elimination of emissions of fine-dispersed particles РМ10 and РМ2,5.
Limitation by days of access for motor transport with even and odd numbers (about by 50 %) allows reduction of the emissions by 24345 tons. This measure provides the highest effect in the pollutants’ reduction in the city – by 55,5 %.
Use of 1000 electric buses instead of diesel buses will result in reduction of the emissions by 1168 tons or 2,7 %. At that the emissions of solid particles РМ10 and РМ2,5 are also excluded.
Prohibition to use passenger cars with ecological class below Euro 4 and their replacement by the cars with ecological classes 5-6 allows reduction of the emissions by 17948 tons or 40,9 %.
The important direction of the environmental policy is control on the emissions produced by the motor transport. At the present time the ecological stations on control on the motor transport as regards content of carbonic oxide and smoking are acting in the city of Almaty. Checking of the cars is conducted in accordance with the standard requirements. Methods of control on the motor transport are used according to standards GOST 33997-2016 and ST RK 1433-2017 [8, 9]. During realization of such control it was found out that about 12-15 % of the cars do not correspond to the standards’ requirements. The exceeding of standard on content of carbon and smoking in the exhaust gases is observed. According to the performed calculations, the motor transport, which exceeds the standards in the exhaust gases, emits the pollutants in amount of 7719 tons/year. This increases total emissions by 18,1 %.
4. Conclusions
Emissions from vehicles make a significant contribution to air pollution in the residential area of the city of Almaty with particles PM10 and PM2.5, nitrogen dioxide, carbon monoxide.
In addition, vehicle emissions are the main contributors to the exceeding levels of urban air pollution with harmful substances.
The complex of measures should be realized in order to improve the atmospheric air’ quality in the city. One of the most effective measures is limitation of access of the motor transport with even and odd numbers by 50 %, limitation of use of the passenger cars with ecological class below Euro 4 and their replacement by cars with ecological classes Euro 5-6.
Withdrawal of diesel motor transport from the city gives the possibility to exclude the emissions of fine-dispersed particles РМ10 and РМ2,5 practically completely.
Use of electric motor transport and compressed natural gas (CNG) gives the significant effects as regards the reduction of the emissions. These measures are the most perspective in the sphere of the motor transport use.
Control on content of carbonic oxide and smoking in the exhaust gases is an important tool in provision of permissible level of the emissions during the operation of the motor transport.
References
-
“World air quality ranking (AQI),” https://www.iqair.com/ru/world-air-quality-ranking.
-
Yerkin A. Jailaubekov, Galym Dzh. Berkinbaev, Natalya A. Yakovleva, and Valeria S. Kosach, “Monitoring of the air pollutants’ emissions from the motor transport in the city of Almaty,” International Review of Mechanical Engineering, Vol. 15, pp. 301–303, Jun. 2021.
-
A. Kerimray et al., “Assessing air quality changes in large cities during COVID-19 lockdowns: The impacts of traffic-free urban conditions in Almaty, Kazakhstan,” Science of The Total Environment, Vol. 730, p. 139179, Aug. 2020, https://doi.org/10.1016/j.scitotenv.2020.139179
-
“Computer software for calculation of the emissions created by the road transport COPERT 5,” https://copert.emisia.com/
-
Y. A. Jailaubekov, “Calculation and analysis of the harmful pollutants emitted by the motor transport into the atmospheric air in the Republic of Kazakhstan,” (in Russian), KazATC, Almaty, 2010.
-
Y. A. Jailaubekov, R. D. Alibekov, M. A. Nartov, and G. Z. Bekbolatov, “Methods andcomputer software for calculation of the harmful pollutants emitted by the motor transport,” (in Russian), Kazpatent, No. 11651, 2020.
-
“Monthly information bulletin on the environment status of RSE “KAZHYDROMET”,” https://www.kazhydromet.kz/ru/ecology/ezhemesyachnyy-informacionnyy-byulleten-o-sostoyanii-okruzhayuschey-sredy
-
“GOST 33997-2016. Wheel transport. Requirements to safety in operation and methods of control,” (in Russian), Standartinform, Moscow, 2018.
-
“ST RK 1433-2017. Road transport. Emissions of the pollutants with the exhaust gases of the motor transport into the atmospheric air. Norms and methods of determination,” (in Russian), Gosstandart, Astana, 2017.
About this article

The authors have not disclosed any funding.
The datasets generated during and/or analyzed during the current study are available from the corresponding author on reasonable request.
Yerkin Jailaybekov: The main idea and content of the article. Collection and analysis of statistics on the concentration of pollutants in the air of the city in the considered periods of time. Preparation of tables and figures. Main conclusions and suggestions. Compilation of the original version of the article. Subsequent editing of the article based on the comments of the review.
Galym Berkinbaev provided online air quality monitoring data. Performed verification of the results. Participated in the work editing.
Natalya Yakovleva took part in the research, preparation of tables and figures, editing the work.
Seilkhan Askarov prepared data of vehicle emissions, statistical data for the whole city. Participated in editing the work.
The authors declare that they have no conflict of interest.
