Abstract
Nowadays, everything is getting smarter such as mobile phones, cars, watches and home appliances. Our powerlines are also getting smarter. There are many smart grid and smart home applications. Designing of recognition devices to identify appliances for these smart networks is a new task to do it. There are many different approaches on recognition and identification these power consumer devices and appliance. This study aims to develop an effective method that does not require any additional hardware. This method has been developed by using powerline parameters such as current, phase angle, voltage, active and reactive power. These data have been classified and normalized by using a validation method and grey relational analysis to train an artificial neural network. This neural network was trained by using power parameters of many different common appliances like heater, coffee machine, television, radio, lamp, computer, fan, refrigerator etc. This identification algorithm can be used within a low-cost embedded system for collecting appliance information over a powerline to provide info for smart homes and smart grids.
1. Introduction
The households and other buildings use almost 40 % of total energy all over the world. This means we should put more effort on studies about energy saving and planning. Monitoring of energy consumption is essential for these studies. There are many different techniques to monitor and predict energy consumption of a building. According to a review by Zhao and Magoules [1], engineering methods, statistical methods, neural networks, support vector machines and grey models can be used for the prediction. However, one of these techniques is not enough by itself for high accuracy. Being fast enough, applicable and easy to implement are some other problems.
There are many different appliances and devices which consume electrical energy on the same buildings. Therefore, it is need to measure and record hundreds of parameters to be used for smart energy system. A high frequency voltage and current measurement data set [2] has been recently established by Medico et al. This data set contain 17 different appliances in 330 different models. They have also measured combined operations where appliances were active simultaneously. Another database named ACS [3], has been established by measuring 15 different appliances and 225 brand/model in two different session. Ridi et. al. have intentionally used low sampling frequency because of energy saving. On the other hand, an advanced home energy management system [4] has shown that future of smart home system depends on load monitoring and power scheduling. Another study about automatic recognition of electrical loads [5] has also demonstrated the need of recognition techniques for simultaneously working appliances. Studies such as the energy aware smart home [6] and the future renewable electric energy delivery and management system [7] have proved that information based electrical power system will take over soon. Therefore, analyzing electrical parameters such as voltage, current, active and reactive power should be considered as data acquisition rather than a simple measurement. Real-Time recognition and profiling of appliance through a single sensor [8] without complex device and environment is key to smart grids and homes. Low-cost prototype of smart meters for household [9] has already been started to be developed. Because of all these reasons, this study focuses on identification of appliances by using only line parameters such as voltage, current, power, frequency etc. It is also important that detecting which appliance is working when more than one appliance running simultaneously.
Previous studies have used different classification techniques. ACS-F2 [3] database has been used for this study because of its appliance variety and low frequency sampling rate. Ridi et. al. have applied machine learning algorithms which are nearest neighbor (k-NN) and Gaussian Mixture Modelling (GMM). Overall accuracy varying between 70 % and 90 % based on test protocols. They have also mentioned that some appliances were easy to recognize while some were not. Some other researchers who use the same database have achieved better results. An adaptive rate time-domain approach [10] has reached 91.9 % average classification accuracy. However, in this approach some of the appliances were skipped. Another study that uses Hidden Markov Models, which is another machine learning algorithm [11], has achieved relatively better results. A study using moving average for data preparation [12] has reached to 99 % by random forest classification and multilayer perceptron. It is obvious that different pre-processing data techniques and machine learning algorithms have improved the overall accuracy.
Our study, all previous methods and classification techniques have been examined. Appliance data has been pre-processed by using grey relational analysis. This way all data normalized as well as they are pre-processed with a dynamic coefficient. Additionally, a data validation method has been developed to avoid invalid data. After that, a multilayer feed-forward back-propagate ANN has been trained by using these data. By this way, a grey relational neural network has been established for identification of appliances by only using power line parameters with high accuracy.
2. Methods and techniques
Pattern recognition processes has three main tasks: data pre-processing, data representation and decision making. A simple feed-forward neural network can be trained for pattern recognition tasks such as image processing and biometric identification [13]. ANNs can be described as non-linear machine learning methods. Therefore, they are more effective and successful than the conventional methods for pattern recognition.
In this study, grey relational analysis has been used as data pre-processing to create dynamic coefficients that specify the correlation of input samples. Then, a data validation technique has been applied to measurement data because some measurements results are mistaken due to transient regime of the appliances. Besides, appliances are not working all the time. Therefore, ANN should be trained by using the right data. By this way, a new highly accurate hybrid identification method has been derived.
2.1. Grey relational analysis
Hybrid analysis methods are recently popular due to their high accuracy and reliability. Normalization techniques such a grey relational analysis (GRA) in neural network [14] significantly improves quality of multi-objective optimization. GRA is also used for many different areas like product design [15], analysis for multivariate time series [16], optimization of operating rules for powerplants [17].
GRA calculates correlation between input sequences dynamically. There are three different initial approach; higher is better Eq. (1), smaller is better Eq. (2) or nominal value is better Eq. (3). The best approach can be determined by researcher according to the data sequence [18]:
where is the original input value, is the maximum value of the sequence, is the minimum value of the sequence, is the pre-processed data, is the desired normalize value, 1, 2, 3… is a integer number of parameters and 1, 2, 3,… is a integer number of the samples.
In other word, GRA is a calculation of grey relation grades for a data sequence as pre-processing. These grades determine the relational degree between different sequences Eq. (4). Finally, average value of these coefficients for n different values determines the grey relational rank Eq. (5):
where is grey relational grade, is deviation sequence of , is optimizing coefficient between 0 and 1, is grey relational coefficient.
By this way, multiple input data can be converted into a single grey relation grade that shows the correlation of data. This method can be used for various problems such as calculating the initial values of weights in an artificial neural network [19], building power systems strategies in distribution systems [20] and hybrid forecasting modelling for wind power [21].
2.2. Data validation
ACS-F2 database has measured power parameters of 15 different appliance within 15 different brands for each category. These parameters are line frequency, angle between voltage and current, real power, reactive power, rms current and rms voltage of the related appliance as seen on Table 1.
Table 1Database parameters
Parameter | Symbol | Unit |
Frequency | Hz | |
Angle | Degree | |
Real power | Watt | |
Reactive power | VAR | |
RMS current | Ampere | |
RMS voltage | Volt |
Researchers have measured the parameters for one hour with 10 second interval in two separate sessions. This makes a comprehensive database. However, database contains uncertain values as well. Therefore, derivative values such as apparent power Eq. (6), power factor Eq. (7), active Eq. (8) and reactive power Eq. (9) should be calculated by using measured parameters for validation:
where is the apparent power, is active power, is reactive power, is power factor, root mean square current and is root mean square voltage value.
After the calculation, difference between measured and calculated values Eq. (10) and coefficient for the difference Eq. (11) can be determined by using sigmoid function Eq. (12) and its derivative Eq. (13). These coefficients will determine the accuracy of the sample:
where is the difference, is measured value, is the calculated value, is the number of the sample and is the number of the parameter, is validation error coefficient. is sigmoid function and is first derivative while is the gain value for the function.
2.3. Grey relational artificial neural network
ANN is a mathematical method that can learn critical information from multi-dimensional data sequences. They can also process noisy and incorrect data with high error tolerance [22]. On the other hand, using GRA classifier for identification [23] within another techniques improves the accuracy. GRA can determine closeness and uniqueness between different parameters [24]. Grey embedded ANNs can be used for many different tasks such as optimization approach in machining [25] and hybrid forecasting modelling [26].
ANNs are very good to work with any other analysis methods. They can determine the importance of the data and decide how it effects to the output. The principal parameters of an ANN are input data, weight matrixes, bias values and activation function. They can also adjust their initial weights by using various techniques such as back propagation and genetic algorithms [27]. General mathematical function for an ANN cab be stated as below Eq. (14). Here, you can change the way how weights affect to sum or how much bias value should be added. The various different kind of activation function and technical indicators can also be used [28]:
where is the bias value, is the input, is the weight and is the activation function. is the number of input 1, 2, 3,…, .
Table 2Input parameters of GRANN
GRA grade | Validation error | RAW values | |
Inputs () | (1) | (1) | Frequency |
(2) | (2) | Phase angle | |
(3) | (3) | Real power | |
(4) | (4) | Reactive power | |
(5) | (5) | RMS current | |
(6) | (6) | RMS voltage |
The Grey Relational Artificial Neural Network (GRANN) uses grey relational grades and validation error value as input. Validation error coefficients are also used as hidden layer’s bias. This way, ANN can avoid uncertain and unstable measurement values. On the other hand, GRA coefficient work as output’s bias to create a threshold for the sample whether it should be labeled or not. A four-layered feed forward back propagated ANN is constructed as seen in Fig. 1.
Fig. 1Architecture of GRANN
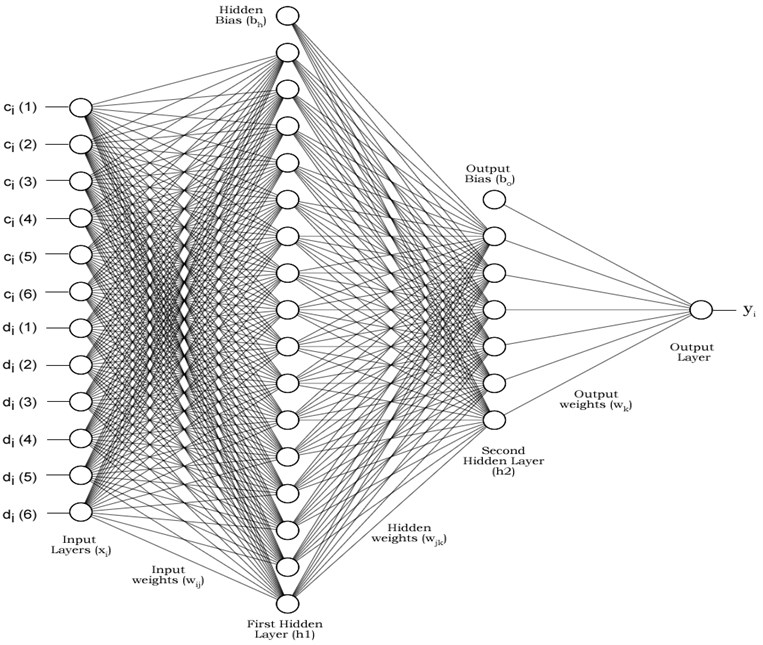
Here, , and are transfer function. We have used different type of transfer function which will be presented in the next section to get best accuracy. We have also used two coefficients as threshold to improve the response of the ANN. Validation error coefficient () makes hidden neurons values zero for invalid samples and grey-relational coefficients () makes output values zero for invalid samples. Relationship between layers and neurons as follows:
where is the number of input neurons, is the number of first hidden layer’s neurons, is the number of the second hidden layer’s neurons, is the bias for hidden layers, is the bias for output layer.
Grey models and neural networks are typical examples on time series analysis for prediction and identification [29]. Recently, grey relational analysis has been adopted by many different research areas to be used within ANNs coupled with other optimization techniques. Prediction of surface roughness composite material [30], prediction of maintenance workforce size [31], estimation of human impedance body parameters are some of these areas.
3. Result and discussion
The ACS-2 database [32] has 15 different categorical appliances. Therefore, we have created 15 different class for each category and we added one zero class for invalid measurement. These measurements include transient regimes, standby modes and uncertain values that affect output negatively. These values have been labeled as zero by using validation error and grey-relational coefficients. Although, we have tried different multidimensional optimization algorithm, the best result was obtained by Levenberg-Marquardt algorithm which works with gradient vector and Jacobian matrix. Performance of different training algorithms and activation functions can be seen on Table 3.
Table 3Performance comparison
Training algorithm | Activation function | MLR | MSE | ||
Training | Testing | Training | Testing | ||
Levenberg-marquart | pure-linear | 0.8546 | 0.8541 | 4.94 | 5.06 |
Levenberg-marquart | tan-sigmoid | 0.9948 | 0.9938 | 0.273 | 0.322 |
Quasi-newton | pure-linear | 0.9432 | 0.9404 | 2.03 | 2.096 |
Conjugate gradient | tan-sigmoid | 0.8675 | 0.8692 | 4.64 | 4.55 |
One step secant | tan-sigmoid | 0.8322 | 0.8305 | 5.72 | 5.74 |
In Table 3 parameter MSE is the mean square error, MLR is the multiple linear regression, is slope coefficient, is the model’s error:
Fig. 2MLR graphic of training
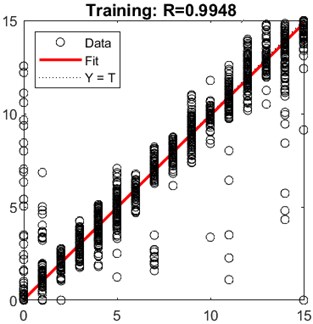
Fig. 3MLR graphic of testing
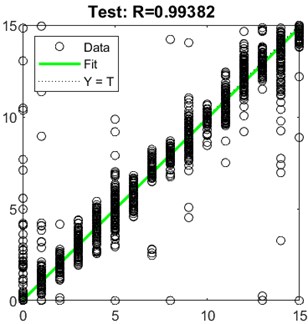
MLR results show that the most of miss predictions are very close to real data because total difference between classes is equal to one. These differences have been truncated by using bias values. The other miss predictions have been caused by zero class which were representation of the invalid input data. This class has more samples than combination of all other classes because appliances were not working all the time. We have also excluded the transient values and labeled them as class zero by using validation technique. Fig. 4 presents the confusion matrix plot [33] of test result. The average response of GRANN for each class is shown on Table 4.
Fig. 4Confusion matrix
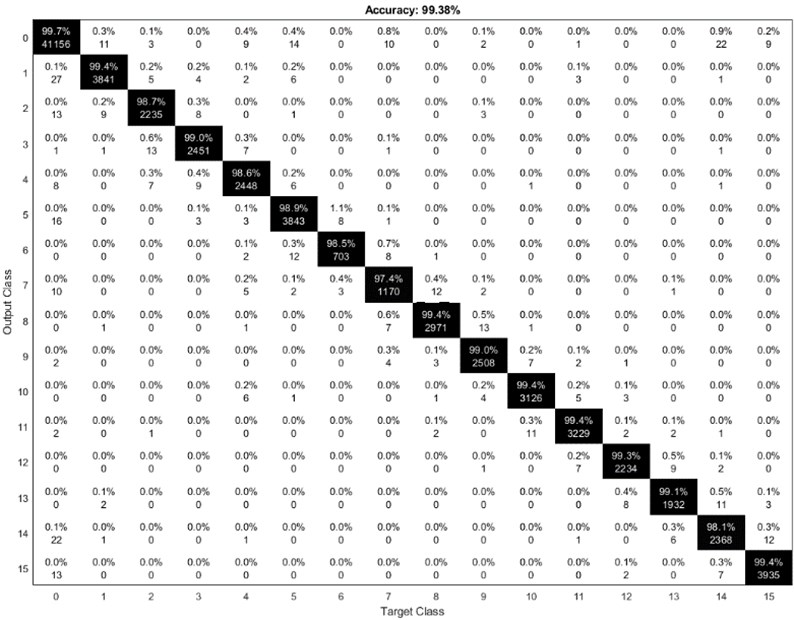
Table 4Labels and results
Label | Appliance | GRANN |
0 | – | 0 |
1 | Coffee machines | 0.98 |
2 | Computer stations | 1.96 |
3 | Fans | 2.97 |
4 | Fridges and freezers | 3.94 |
5 | Hi-fi music systems | 4.94 |
6 | Kettles | 5.91 |
7 | Fluorescent lamps | 6.81 |
8 | Incandescent lamps | 7.95 |
9 | Laptops (on charge) | 8.91 |
10 | Microwave ovens | 9.94 |
11 | Mobile Phone (on charge) | 10.93 |
12 | Monitors | 11.91 |
13 | Printers | 12.88 |
14 | Shavers | 13.73 |
15 | Television | 14.91 |
4. Conclusions
ANNs are very useful for solving of multi variable problems. Unlike machine learning, they can adapt and change their parameters to get best result. There are many different architectures, training algorithms and transfer functions for different approaches. In this study, GRA has been used for normalization. Besides, GRA provides a dynamic coefficient to determine the correlation of input samples for each class. Furthermore, a validation technique has been developed for avoiding invalid data. Hybridization of different methods is very useful to get better accuracy on recognition and identification problems.
The hybrid GRANN can predict appliance with more then 99 % accuracy by using only power parameters such as current, voltage, active and reactive power. The total accuracy was around 84 % without validation and grey-relational analysis. Pre-processing and preparation of data are dramatically important for ANNs. The training algorithm and transfer function should be chosen according the type and range of these data as well. This study has presented a hybrid appliance identification method which can be used within an embedded system for smart home and smart grids. Further study will focus on implementation of this method for real-life application.
References
-
Zhao Hai Xiang, Magoulès Frédéric A review on the prediction of building energy consumption, Renewable and Sustainable Energy Reviews, Vol. 16, 2012, p. 3586-3592.
-
Medico R., De Baets L., Gao J. et al. A voltage and current measurement dataset for plug load appliance identification in households. Scientific Data, Vol. 7, 2020, p. 49.
-
Ridi A., Gisler C., Hennebert J. ACS-F2 – a new database of appliance consumption signatures. 6th International Conference of Soft Computing and Pattern Recognition, 2014, p. 145-150.
-
Lin Y., Tsai M. An advanced home energy management system facilitated by nonintrusive load monitoring with automated multi-objective power scheduling. IEEE Transactions on Smart Grid, Vol. 6, Issue 4, 2015, p. 1839-1851.
-
Hamid O., Barbarosou M., Papageorgas P., Prekas K., Salame C.-T. Automatic recognition of electric loads analyzing the characteristic parameters of the consumed electric power through a non-intrusive monitoring methodology. Energy Procedia, Vol. 119, 2017, p. 742-751.
-
Jahn M., Jentsch M., Prause C. R., Pramudianto F., Al Akkad A., Reiners R. The energy aware smart home. 5th International Conference on Future Information Technology, Busan, 2010.
-
Huang A. Q., Crow M. L., Heydt G. T., Zheng J. P., Dale S. J. The future renewable electric energy delivery and management system: the energy internet. Proceedings of the IEEE, Vol. 99, Issue 1, 2011, p. 133-148.
-
Ruzzelli A. G., Nicolas C., Schoofs A., O'Hare G. M. P. Real-time recognition and profiling of appliances through a single electricity sensor. 7th Annual IEEE Communications Society Conference on Sensor, Mesh and Ad Hoc Communications and Networks, Boston, 2010.
-
Sanchez-Sutil F., Cano-Ortega A., Hernandez J., Rus-Casas C. Development and calibration of an open source, low-cost power smart meter prototype for PV household-prosumers. Electronics, Vol. 8, 2019, p. 878.
-
Qaisar S. M., Alsharif F. An adaptive rate time-domain approach for a proficient and automatic household appliances identification. International Conference on Electrical and Computing Technologies and Applications, Ras Al Khaimah, United Arab Emirates, 2019.
-
Ridi A., Gisler C., Hennebert J. Appliance and state recognition using hidden Markov models. International Conference on Data Science and Advanced Analytics, Shanghai, 2014, p. 270-276.
-
Mpawenimana I., Pegatoquet A., Soe W. T., Belleudy C. Appliances identification for different electrical signatures using moving average as data preparation. 9th International Green and Sustainable Computing Conference, Pittsburgh, USA, 2018.
-
Abiodun O. I., et al. Comprehensive review of artificial neural network applications to pattern recognition. IEEE Access, Vol. 7, 2019, p. 158820-158846.
-
Wan X., Wang Y., Zhao D. Grey relational and neural network approach for multi-objective optimization in small scale resistance spot welding of titanium alloy. Journal of Mechanical Science and Technology, Vol. 30, 2016, p. 2675-2682.
-
Lin Y., Yeh C. Grey relational analysis based artificial neural networks for product design: A comparative study. 12th International Conference on Informatics in Control, Automation and Robotics (ICINCO), Colmar, 2015, p. 653-658.
-
Sallehuddin R., Shamsuddin S. M. H., Hashim S. Z. M. Application of grey relational analysis for multivariate time series. 8th International Conference on Intelligent Systems Design and Applications, Kaohsiung, 2008, p. 432-437.
-
Fang G., Guo Y., Huang X., Rutten M., Yuan Y. Combining grey relational analysis and a Bayesian model averaging method to derive monthly optimal operating rules for a hydropower reservoir. Water, Vol. 10, 2018, p. 1099.
-
Hasani H., Tabatabaei S. A., Amiri G. Grey relational analysis to determine the optimum process parameters for open-end spinning yarns. Journal of Engineered Fibers and Fabrics, Vol. 7, 2012, p. 81-86.
-
Lin Y. C., Yeh C. H. Grey relational analysis based artificial neural networks for product design: a comparative study. Proceedings of 12th International Conference Informatics Control Automation Robotic, Vol. 1, 2015, p. 653-538.
-
Chen W. H. Quantitative decision-making model for distribution system restoration. IEEE Transaction Power System, Vol. 25, 2010, p. 313-21.
-
Shi J., Ding Z., Lee Wj, Yang Y., Liu Y., Zhang M. Hybrid forecasting model for very-short term wind power forecasting based on grey relational analysis and wind speed distribution features. IEEE Transaction on Smart Grid, Vol. 5, 2014, p. 521-526.
-
Şahin M., Oğuz Y., Büyüktümtürk F. ANN-based estimation of time-dependent energy loss in lighting systems. Energy and Buildings, Vol. 116, 2016, p. 455-467.
-
Chen Pei-Jarn, Du Yi-Chun Combining independent component and grey relational analysis for the real-time system of hand motion identification using bend sensors and multichannel surface EMG. Mathematical Problems in Engineering, Vol. 2015, 2015, p. 329783.
-
Kumar Dinesh, Chandna Pankaj, Pal Mahesh Efficient optimization of neural network using Taguchi-grey relational analysis with Signalto-noise ratio approach for 2.5D end milling process. American Journal of Mechanical Engineering and Automation, Vol. 5, Issue 2, 2018, p. 30-42.
-
Kharwar P. K., Verma R. K. Grey embedded in artificial neural network (ANN) based on hybrid optimization approach in machining of GFRP epoxy composites. FME Transactions, Vol. 47, 2019, p. 641-648.
-
Sallehuddin Roselina, Mariyam Siti, Shamsuddin H. J. Hybrid grey relational artificial neural network and auto regressive integrated moving average model for forecasting time-series data. Applied Artificial Intelligence, Vol. 23, Issue 5, 2009, p. 443-486.
-
Kalogirou Soteris A. Optimization of solar systems using artificial neural-networks and genetic algorithms. Applied Energy, Vol. 77, Issue 4, 2004, p. 383-405.
-
Patel Jigar, Shah Sahil, Thakkar Priyank, Kotecha K. Predicting stock and stock price index movement using trend deterministic data preparation and machine learning techniques. Expert Systems with Applications, Vol. 42, Issue 1, 2015, p. 259-268.
-
Yokoyama Ryohei, Wakui Tetsuya, Satake Ryoichi Prediction of energy demands using neural network with model identification by global optimization. Energy Conversion and Management, Vol. 50, Issue 2, 2009, p. 319-327.
-
Thankachan Titus, Prakash K. Soorya, Malini R., Ramu S., Sundararaj Prabhu, Rajandran Sivakumar, Rammasamy Devaraj, Jothi Sathiskumar Prediction of surface roughness and material removal rate in wire electrical discharge machining on aluminum based alloys/composites using Taguchi coupled grey relational analysis and artificial neural networks. Applied Surface Science, Vol. 472, 2019, p. 22-35.
-
Ighravwe D. E., Oke S. A., Adebiyi K. A. Selection of an optimal neural network architecture for maintenance workforce size prediction using grey relational analysis. Engineering and Applied Science Research, Vol. 45, Issue 1, 2018, p. 1-7.
-
Database of appliance consumption signatures, Institute of Complex Systems, https://icosys.ch/acs-f2.
-
Tshitoyan Vahe Plot Confusion Matrix. GitHub, 2020, https://www.github.com/vtshitoyan/plotConfMat.
About this article

