Abstract
In this paper, a method is proposed to secure an autonomous underwater blasting vibration test (UBVT) system with plugs to deep-water rock, and its specific configuration concept and plugging principle are illustrated. Using the principle of statics, a mathematical model is established for the squeezing force in the process of pressing the hole-plug device (HPD) into holes in rocks. The tension-compression test is conducted on the plugs in round granite holes to obtain the axial pressure-displacement curves of the pressing process with the HPD spring parameter , friction coefficient between the HPD and the rock-wall, and the dynamic contact friction attributes between the metallic HPD and the rock-wall of hole in granite. The axial pressure with such parameters as , , and the squeezing velocity , among others, and the four steps of the pressing process are numerically simulated. The relations of the characteristic squeezing force with , , and , as well as the mechanisms of these parameters that influence HPD usage and the sensitivity coefficient, are revealed. The findings of the present study provide references for setting the HPD configuration parameters and for formulating plug-specific construction methods.
1. Introduction
Seismic waves generated by deep-water rock blasting may damage the safety of underwater structures and facilities, and their deep-water propagation and hazardous effects have become problems that remain to be solved in this field [1-6]. The characteristics of underwater blasting and the propagation laws of induced vibration are both different from those of land blasting due to the influence of underwater environments such as water mass, water-saturated sediments, and rock mass [7, 8]. Limited by underwater blasting vibration test (UBVT) techniques and means, current study of underwater blasting vibration mainly concentrates on the response of land ground and structures, deep-water rock blasting vibration effects have been rarely reported at home and abroad [9-11]. We invented an UBVT system that integrates vibration signal acquisition and storage, and multiple autonomous triggering, among others [21]. By comparing the calibration, metering, and land blasting vibration test results, the precision and accuracy of the UBVT system is validated [13, 14]. The UBVT system provides technical support for testing the underwater blasting vibration effects, and the method of securing the test system to seabed rock offers engineering support. To solve problems of securing the test system to seabed rock and to ensure no relative displacement occurs between the system and the underwater measuring point under the blasting vibration effects, we presented methods of plugging the test system into underwater rock with holes [15].
2. Mathematic model of axial force analysis for pressing HPD into holes
Force analysis of pressing into the round rock hole is shown in Fig. 1, and the relative axial displacement between the plugs of different layers is presented in Fig. 2.
Force analysis is conducted at different steps of the pressing process, and the corresponding statics equations are established at different steps of the pressing process. The following expressions of axial pressure using the four steps are obtained:
Studies have shown that, when the normal pressure changes in the contact sliding process, the friction coefficient is also correlated with the normal pressure [16]:
where is the sliding friction coefficient and is the constant coefficient.
When , as shown in the plug configuration parameters in Table 1, as shown in Fig. 3 the change curves of the theoretical pressure while pressing the plugs into the mounting holes in rock and the displacement are obtained.
Fig. 1Force analysis of bulb of HPD
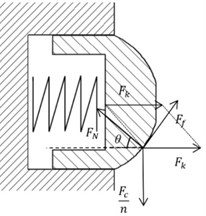
Fig. 2Relative axial displacement between the plugs of different layers
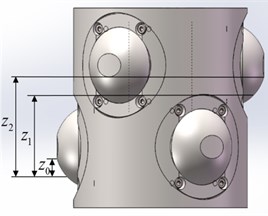
Fig. 3Curves in the theory force of axially squeezing
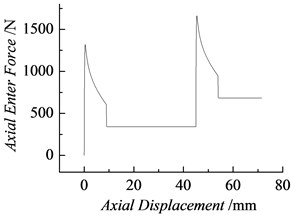
Table 1Plug configuration parameters
/mm | /mm | /mm | /mm | /mm | /mm | /mm | /mm | /N·mm-1 | |
23.288 | 15.852 | 17.599 | 5.000 | 10.000 | 8.852 | 45.000 | 53.852 | 15 | 0.7 |
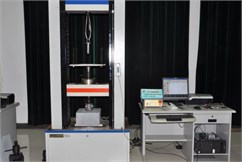
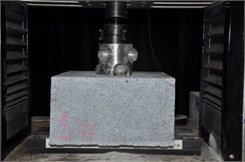
3. Experimental studies on the pressing effect
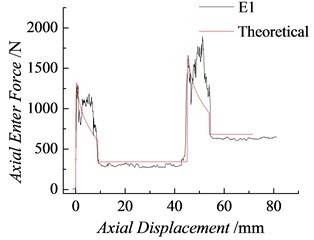
The test system is presented in Fig. 4. The test procedures are repeated once every condition to obtain the relation curves between the axial pressure and the displacement, as shown in Figs. 5, 6, and 7, where and are the pressure – displacement curves of pressing into natural granite at a constant velocity with a plug spring coefficient of 15 N/mm; and are those of pressing into synthesized granite with a plug spring coefficient of 15 N/mm; and and are those of pressing into synthesized granite with a plug spring coefficient of 18 N/mm. As illustrated in Figs. 5-7, the change regularity of the axial pressure-displacement curves under the same test conditions remains unchanged. However, compared with the pressure – displacement time curves from the theoretical calculation, the test results fluctuate randomly, as shown in Fig. 8 The maximal axial pressures and in the process of squeezing the first and second layers of plugs into the mounting holes under different test conditions and the mean friction forces while squeezing and can be read from the test curves in Table 2. The four characteristic forces in the squeezing process, defined as , , and , are short for the characteristic squeezing force.
Fig. 4System for testing the sliding friction in the squeezing process
a)
b)
Fig. 5Axial pressure curves of pressing the plugs into natural rock holes (K= 15 N/mm)
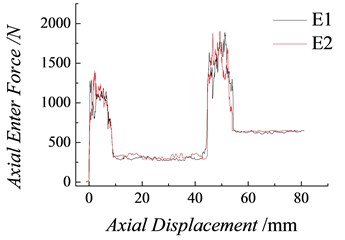
Fig. 6Axial pressure curves of pressing the plugs into synthesized rock holes (K= 15 N/mm)
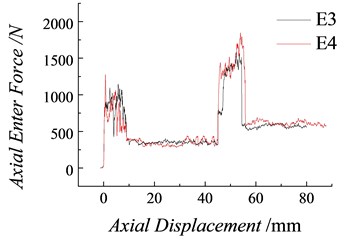
Fig. 7Axial pressure curves of pressing into the synthesized rock holes (K= 18 N/mm)
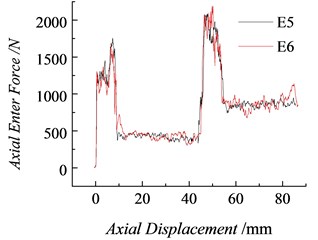
Fig. 8Comparison between the theoretical and test values of the axial pressure (K= 15 N/mm)
In Table 2, the mean friction forces , of the first and second layers are obtained:
In Eq. (3), and respectively represent the number of measuring points on the first and second plateaus of the pressure test curves, and, and respectively represent the measured pressures on the first and second plateaus. Thus, the friction coefficient between the bulb and the rock hole wall is obtained:
where n is the number of bulbs that are contacted at the same time, is the spring constant, and is the spring compression while the bulb is being squeezed.
In Fig. 8 the theoretical and test results of the axial pressure – displacement time curves of the squeezing process are compared under Condition . As shown in the Table 3, the maximal relative error between the theoretical and test values of the squeezing force is smaller than 8 %, which indicates enhanced consistency.
Table 2Test results of the sliding friction coefficient under different test conditions
Test conditions | /N | /N | /N | /N | ||
15 N/mm, pressing in natural granite | 1262.3 | 315.1 | 1626.2 | 630.2 | 0.70 | |
1327.9 | 321.3 | 1573.4 | 642.6 | 0.71 | ||
15 N/mm, pressing in the artificial sesame white granite | 788.8 | 286.8 | 1310.7 | 573.6 | 0.64 | |
823.2 | 291.9 | 1439.8 | 583.7 | 0.65 | ||
18 N/mm, pressing in the artificial sesame white granite | 1288.1 | 431.4 | 2077.9 | 862.7 | 0.96 | |
1304.6 | 440.5 | 2069.1 | 880.9 | 0.98 |
Table 3Comparison between the theoretical and test results of the characteristic force under condition E1
Characteristic squeezing force | /N | /N | /N | /N | Mean friction coefficient |
Test value | 1262.3 | 315.1 | 1626.2 | 630.2 | 0.70 |
Theoretical value | 1320.6 | 342 | 1662.2 | 684 | 0.70 |
Relative error / % | 4.4 | 7.9 | 2.2 | 7.9 | / |
4. Numerical simulation study of the pressing effect
The friction force between the bulb and the hole wall is correlated with the normal pressure on the sliding plane and the sliding contact area as follows [17]:
The relationship is shown in Fig. 9. In the figure, is the velocity of movement at the boundary between adhesive friction and sliding friction. The ratio of the increment of the friction force while squeezing to the corresponding increment of the maximal squeezing force is defined as the sensitivity coefficient of the factor, which is expressed as and in percentage.
4.1. Comparison between the theoretical calculation and the numerical simulation
Through the plug configuration parameters given in Table 1, the experiment scheme , and the mean friction coefficient ( 0.7), a simulation model is established for the squeezing process [18]. As shown in Fig. 10 he relative errors with the theoretical values are 0.4 % and 0.8 %, thus indicating a good agreement. The numerical simulation model and all the calculation parameters are suggested to be rational, feasible, and applicable to the present study in the change regularity of the characteristic squeezing force of the plug with different spring stiff nesses, contact frictions, and load velocities [19, 20].
4.2. Change regularity of the characteristic squeezing force of the plug with the contact friction
In Fig. 11 the friction coefficient on the contact surface changes from 0.5 to 1.0, with spring stiffness of 15 N/mm and squeezing velocity of 20 mm/min. In Fig. 12 the same friction coefficient, , is in good agreement with the theoretical analysis result, and changes in , with the friction coefficient are nonlinear. Fig. 13 shows the change curves of and with the friction coefficient. When and other conditions remaining unchanged, the plugging force may increase with the number of layers.
4.3. Change regularity of the characteristic squeezing force of the plug with the spring stiffness
Fig. 14 shows the axial pressure–displacement curves with a friction coefficient of 0.7, load velocity of 20 mm/min, spring stiffness coefficient increasing from 15 N/mm to 20 N/mm, and different stiffness coefficients. Figs. 15 and 16 respectively show the simulation results of the maximal squeezing forces , and the friction forces . Based on the numerical simulation results of the characteristic squeezing force with different stiffness coefficients Fig. 14, the change regularities of the maximal squeezing forces , and the friction forces and with the spring stiffness coefficient can be attained in the process of squeezing the plugs into holes in rock, increasing with the stiffness coefficient linearly.
In the range of 15–20 N.m-1, the spring stiffness sensitivity coefficient 34.1 % and the friction sensitivity coefficient 48.3 %. Therefore, while improving the installation and performance of the plug, any increase in the squeezing force peak should be avoided as much as possible by increasing the friction coefficient rather than the spring constant. This specific method is to increase both friction/contact area and surface roughness.
Fig. 15Change curves of with the spring constant
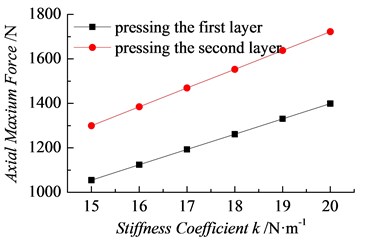
Fig. 16Change curves of with the spring constant
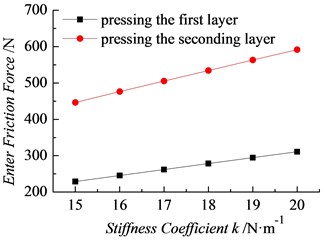
Fig. 17Squeezing force with different load velocities
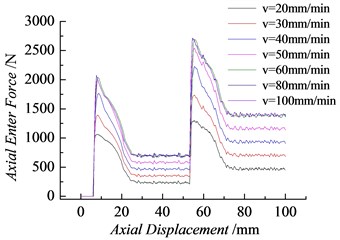
Fig. 18Change curves with the load velocity
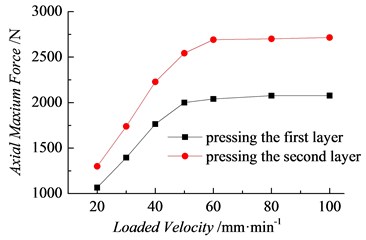
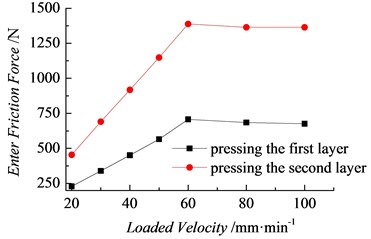
4.4. Change regularity of the characteristic squeezing force of the plug with the load velocity
Fig. 17 shows the change regularities of the axial pressure-displacement curves attained by numerical simulation under different conditions but with a spring stiffness coefficient of 15 N/mm, plug-rock friction coefficient of 0.7, and load velocity 20-100 mm/min. In Fig. 17, the characteristic squeezing forces , , and change more significantly with load velocity than with friction coefficient and spring stiffness. Figs. 18 and 19 respectively show the change regularities of the characteristic squeezing forces , , and with load velocity. As shown in the figure, with the increasing load velocity, the characteristic squeezing force increases with the load velocity with nonlinearity, but the increase rate gradually diminishes. When the load velocity increases to 60 mm/min, all the characteristic squeezing forces reach their peaks and then remain unchanged at 60 mm/min. The range of load velocity 20-60 mm.min-1 is presented in Figs. 18 and 19, and 65.9 %. Clearly, an appropriate increase in load velocity is suitable for improving the installation and performance of the plug. Although accelerating the plug installation in underwater construction is difficult, the loading velocity should be improved in practice as much as possible.
Fig. 19Change curves with the load velocity
5. Conclusions
In this paper, the process of pressing the plugs into mounting holes in rock for a UBVT system is simulated numerically. The following conclusions are drawn:
1) The statics analysis, experimental test, and numerical simulation results of the squeezing process are in good agreement. The complete theories and methods established lay a solid foundation for designing the plug configuration parameters, calculating the characteristic squeezing force, developing the implementation plan, and evaluating and analyzing the plug performance.
2) The pressure-displacement curves are attained by simulation under different conditions and reveal the change regularity of the axial pressure through four steps of the squeezing process. A method is proposed to characterize the squeezing force and the characteristic squeezing forces and with displacement. Therefore, the change regularities and characteristics of the characteristic force with friction, spring stiffness, and load velocity are obtained.
3) A method is proposed to characterize the sensitivity coefficient of the friction coefficient, spring stiffness coefficient, and load velocity in the plug performance and plugging capacity. Therefore, the sensitivity coefficient of each of the factors influencing the performance is attained, and reference for optimizing the plug configuration parameters and developing proper process measures is provided.
References
-
Adapaka S. K., Kalan U. G., Pydisetty V. K. R., Amalapurapu J. Blast loading of underwater targets – a study through explosion bulge test experiments. International Journal of Impact Engineering, Vol. 79, 2015, p. 189-195.
-
Liu Xiao-wen, Cao Zu-gui, Huang Lin, Gao Yu-gang Ground vibration tests of underwater explosion in blast pond. Journal of Huainan Vocational and Technology College, Vol. 10, Issue 4, 2010, p. 13-15.
-
Jiang Mei, Shen Xin-qiang, Yang Hong Influence of underwater explosions on fishery organism. Marine Fisheries, Vol. 27, Issue 2, 2005, p. 150-153.
-
Zhu Li-xin, Xia Wei-guo, Ni Rong-fu How to prevent damage of short-range structures from quakes of underwater drilling and blasting. Blasting, Vol. 20, Issue 2, 2003, p. 86-87.
-
Chen Chun-hui, Wu Li, Zhao Jun-wen, Li Bo, Li Hong-yong, Li Chun-jun Influence of underwater drilling and blasting on adjacent structure safety. Blasting, Vol. 33, Issue 2, 2016, p. 117-122.
-
Wiley M. L., Gaspin J. B., Goertner J. F. Effects of underwater explosions on fish with a dynamical model to predict fishkill. Journal of Ocean Engineering and Science, Vol. 6, Issue 2, 1981, p. 223-284.
-
Cole R. Underwater Explosions. Dover Publications, New York, 1965.
-
Adushkin A. V., Burchik V. N., Goncharov A. I., Kulikov V. I., Khristoforov B. D., Tsykanovskii V. I. Seismic, hydroacoustic, and acoustic action of underwater explosions. Combustion Explosion and Shock Waves, Vol. 40, Issue 6, 2004, p. 707-713.
-
Tong Jin-yue, Shi Jiao-wang, Xiong Chang-han, Zhang Zheng-yu Study on the law of influence of underwater engineering blasting on environment (II). Blasting, Vol. 17, Issue 4, 2000, p. 1-4.
-
Madheswaran C. K., Sundaravadivelu R., Boominathan A., Natarajan K. Response of berthing structure due to underwater blasting for rock dredging. Experimental Techniques, Vol. 33, Issue 3, 2009, p. 61-72.
-
Zhong Dong-wang Seismic test and analysis of underwater drilling blasting for Taiziji waterway. Journal of Wuhan University of Science and Technology, Vol. 34, Issue 5, 2011, p. 350-353.
-
Gu Wen-bin, Wang Zhi-hua, Chen Jiang-hai, et al. An Autonomous Acquisition Device for Underwater Blasting Vibration Test. China, ZL 2014 2 0859882. 2, 2015.
-
Gu Wen-bin, Chen Jiang-hai, Wang Zhen-xiong, Wang Zhi-hua, Liu Jian-qing, Lu Ming Experimental study on the measurement of water bottom vibration induced by underwater drilling blasting. Shock and Vibration, Vol. 2015, 2015.
-
Chen Jiang-hai, Gu Wen-bin, Liu Jian-qing, Wang Zhen-xiong, Lu Ming, Pan Yu-xin Measurement and analysis of land and water bottom vibrations induced by underwater blasting. Journal of Vibroengineering, Vol. 17, Issue 8, 2015, p. 4057-4647.
-
Gu Wen-bin, Chen Jiang-hai, Liu Jian-qing, et al. Plugging and Fastening Device for Underwater Blasting Underwater Shock Embedded Test System. China, ZL 2015 2 0966921. 3, 2016.
-
ZHU Qing-jie, HE Yan-feng, Finite Element Modeling of Contact Interaction – ADINA Engineering Application Examples. China Science and Technology Press, Beijing, 2015.
-
Adina Theory and Modeling Guide. Volume I: ADINA Solid and Structures. Adina R&D Inc, USA, 2012.
-
Ma Ye, Yuan Zhi-dan, Cao Jin-feng ADINA Finite Element Classical Example Analysis. China Machine Press, Beijing, 2012.
-
Johnson K. L. Contact Mechanics. Higher Education Press, Beijing, 1992.
-
Wei Long, Liu Qi-he, Zhang Peng-gao Sliding friction surface contact mechanics model based on fractal theory. Journal of Mechanical Engineering, Vol. 48, Issue 17, 2012, p. 106-113.
About this article

