Abstract
The existing aircraft center track extraction methods only extract the position information of the trajectory, which cannot meet the requirements of abnormal trajectory detection and trajectory prediction. This paper innovatively proposes a center locus extraction algorithm based on multidimensional hierarchical clustering. Firstly, to solve the problem that trajectory resampling is easy to lose the original trajectory features, an equal arc length interpolation resampling method is proposed to process the original trajectory data. Then, the weighted Euclidean distance matrix of the trajectory set is calculated. The calculation model of the weighted Euclidean distance matrix is novel and takes into account the influence of multidimensional features. Finally, multidimensional hierarchical clustering is used to get the traffic flow distribution and output the center trajectory. 703 departure trajectory data from the terminal area of an airport are used for example verification. The results show that compared with the traditional hierarchical clustering, this method has a significant advantage in accurately dividing traffic flow. Moreover, the extracted center locus can retain the multidimensional features of locus, which has certain practical significance.
Highlights
- To solve the problem that trajectory resampling is easy to lose the original trajectory features, an equal arc length interpolation resampling method is proposed to process the original trajectory data.
- The calculation model of the weighted Euclidean distance matrix is novel and takes into account the influence of multidimensional features.
- Multidimensional hierarchical clustering is used to get the traffic flow distribution and output the center trajectory.
1. Introduction
With the increasing scale of China’s civil aviation industry and the gradual application of the digital management system, the operation data related to air traffic management is also increasing [1]. The flight path information of aircraft contains rich application value. The flight trajectory data scanned by radar are sorted according to the time stamp, and the position feature, time feature, and attribute feature are recorded. Therefore, how to make full use of multidimensional feature information from historical trajectory data, output meaningful traffic flow distribution [2, 3], and obtain center trajectory has become one of the research hotspots in the field of air traffic.
The central trajectory is the most representative one with the highest density in the traffic flow. The central trajectory can be applied to aircraft trajectory prediction [4], abnormal trajectory recognition [5], practical analysis of departure procedures [6], and airport noise control [7]. The main technical idea of central trajectory extraction is to measure the similarity between tracks and cluster large-scale track data into traffic flows with large intra-class similarity and small inter-class similarity [8-10]. Furthermore, the overall movement characteristics of traffic flow are found, so that a representative trajectory can be used to represent the group movement pattern of traffic flow [11]. In the aspect of center trajectory extraction, J. W. Han et al. Proposed the classic trajectory generation algorithm TRACLUS based on the idea of trajectory segmentation [12]; L. Zheng et al. Used the improved LR-1 algorithm to calculate the average value of trajectory points with the same serial number to get the center trajectory [13]. Wang Lili uses the LOFC time window segmentation algorithm to take the value of the minimum curvature in each trajectory to fit the center trajectory [14]. The center trajectories obtained by the above methods are all new synthetic trajectories, and there may not be any trajectories with the same path in the traffic flow, which does not conform to the actual operation of terminal area navigation. In addition, the synthesis method is time-consuming, and its computational complexity increases exponentially with the increase of the number of trajectories and sampling points. To solve the above problems, S. Du uses K-means clustering [15], F. Cheng uses density peak clustering [16], and S. R. Li uses spectral clustering [17] to find the trajectory with the highest density as the central trajectory. The above method uses the original trajectory as the center trajectory, but the output trajectory only contains position information. Without considering the influence of multidimensional attributes such as time, speed, heading and climb gradient, it cannot meet the requirements of trajectory prediction and abnormal trajectory recognition.
In this paper, the aircraft trajectory data in the radar terminal area is taken as the research object, and the problem of multidimensional feature center trajectory extraction is studied by using the data mining analysis method. Firstly, aiming at the problem that the existing trajectory clustering methods do not make full use of multidimensional features, on the one hand, the equal arc length interpolation resampling method is used to retain the real trajectory information; On the other hand, effective features are selected to calculate the similarity matrix with greater discrimination. Then the traffic flow distribution in the terminal area is obtained by multidimensional hierarchical clustering, and the center trajectory extraction model is established. Finally, the rationality and effectiveness of the proposed algorithm are verified by comparing with the traditional hierarchical clustering.
2. Data preprocessing
2.1. Introduction of trajectory data
In this paper, the center trajectory extraction algorithm is studied based on the trajectory data of the aircraft leaving the terminal area. Due to the complexity of aircraft operation in the terminal area, radar monitoring equipment in the terminal area takes a fixed time interval in the process of data acquisition. And the data acquisition process may be affected by terrain, weather and other factors, resulting in the loss of radar information:
(1) The trajectory data of the departure radar in the terminal area is filtered out, and the duplicate data in the trajectory is deleted.
(2) The flights with more than 5 fixed radar acquisition time intervals between two consecutive points in a single trajectory are eliminated.
(3) The number of points on a trajectory is less than 1 / 2 of the average number of flights.
The processed trajectory set represents the set of trajectory data, namely , where represents the trajectory data. The trajectory data of aircraft consists of a series of discrete trajectory points, namely . For different trajectories, the number of trajectories is not necessarily the same. Each trajectory point includes recording time, spatial position, direction and speed information. For the aircraft trajectory data used in this paper, the trajectory point can be expressed as , where is the record time of the trajectory point, , and are the longitude, latitude and altitude of the trajectory point position, is the heading of the trajectory point, is the climb gradient of the trajectory point, and is the ground speed of the trajectory point.
2.2. Resampling of multidimensional features by interpolation of equal arc length
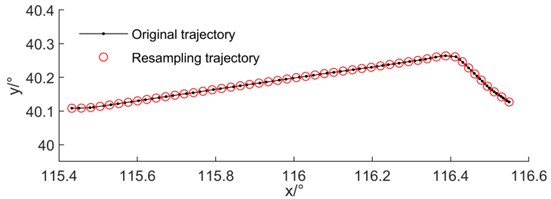
Resampling is one of the core technologies in big data processing, which can effectively reduce the size of data while retaining the characteristics of data. Compared with linear interpolation [19], cubic spline interpolation [18] can better describe the trajectory movement characteristics, so this paper uses equal arc length interpolation resampling based on cubic spline interpolation to resample the trajectory. After defining the cubic spline interpolation function to calculate the original trajectory, the trajectory points are resampled according to the principle of equal arc length. Among them, the time and velocity are resampled in equal proportion according to the change of the value points of equal arc length, the heading is the tangential angle of the horizontal plane of the curve, and the climb gradient is the tangential angle of the vertical direction of the curve.
Resampling is shown in Fig. 1. The original position coordinates of the trajectory and the position coordinates after resampling are drawn on the same figure. The original object contains 96 trajectory points. In this paper, according to the idea of literature [20], after many experiments, the final determination of the number of sampling points is 50. Using the method of equal arc length interpolation resampling, the multidimensional characteristics of the trajectory can be accurately described when the sampling amount is 50. At the same time, this method greatly reduces the data scale and improves the running speed of the subsequent center trajectory extraction algorithm.
Fig. 1Schematic diagram of trajectory resampling
3. Center trajectory extraction algorithm
3.1. Similarity calculation based on multidimensional distance
The similarity calculation model of trajectories is the key factor affecting the rationality of clustering results. The traditional trajectory similarity calculation only focuses on the position feature, while the operation feature of space-time trajectory is multidimensional, so only calculating the position will cause large errors in calculation. Therefore, to reduce the error, this paper introduces the heading, climbing gradient and velocity of the real object trajectory. To improve the accuracy of trajectory similarity calculation and increase the differentiation of traffic flow in complex motion scenes. The trajectories and after resampling with equal arc length interpolation are defined, in which the sampling points of trajectories are equal.
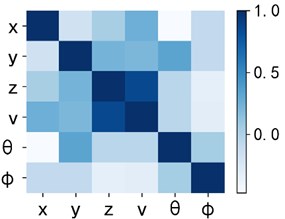
It is necessary to make a correlation analysis of the multidimensional characteristics of flight trajectory to determine their mutual influence relationship. In this paper, the correlation degree of each feature is found by Pearson coefficient correlation analysis. Fig. 2 is a thermal diagram of correlation, and the deeper the blue is, the stronger the correlation is. It can be seen from the figure that the correlation between speed and height is higher, and the correlation between other features is weak. Because the aircraft in the terminal area is in the acceleration stage and the altitude is rising, there is a certain correlation between altitude and speed. Therefore, it is determined that the distance between trajectories is still calculated by using six-dimensional data and the weight of speed is reduced appropriately.
Generally, the similarity between trajectories can be obtained by Euclidean distance [21], LCSS distance [22] and DTW distance [23]. The aircraft in the terminal area has high flight density, and the trajectory recorded by radar has the characteristics of different points, noise and strong maneuverability. Resampling not only unifies the number of tracks, but also reduces the influence of noise, so the Euclidean distance can be used to conveniently calculate the distance between tracks. Based on the six-dimensional characteristics of longitude, latitude, height, speed, direction and climb gradient, this paper uses the feature weighting method to calculate multidimensional distance, named weighted Euclidean distance (WED). The specific calculation formula is as follows:
In Eq. (1), is the velocity Euclidean distance between trajectory points, is the direction Euclidean distance between trajectory points, and is the climbing gradient Euclidean distance between trajectory points; The weight should meet the following conditions: weight factor , and . The weight factor can be adjusted according to the actual application scenarios, 0.7, 0.05, 0.15, 0.1.
Fig. 2Correlation thermogram
3.2. Center trajectory extraction algorithm based on multidimensional hierarchical clustering
The weighted Euclidean distance measurement method combined with trajectory data can be used to construct the similarity matrix between calculated trajectories. In order to improve the calculation speed and reduce the error, it is necessary to normalize , as Eq. (2):
In before normalization, the diagonal element 0 of the similarity matrix represents the distance between the trajectory and itself.
Due to the complexity of aircraft operation in the terminal area, different shapes of traffic flow and uneven distribution of trajectories in traffic flow, this paper uses the agglomerative hierarchical clustering algorithm for clustering analysis. Compared with other algorithms, this algorithm has two obvious advantages:
(1) Hierarchical clustering does not need random selection of cluster center, so other algorithms can avoid falling into local optimal due to random selection of initial cluster’s center.
(2) Hierarchical clustering can adapt to the traffic flow of any shape in the terminal area by analyzing the hierarchical relationship among clusters, to provide a data basis for the subsequent center trajectory extraction.
Davies Bouldin index (DBI) is used to calculate the optimal number of clusters to improve hierarchical clustering. The index is used to evaluate the clustering under a different number of clusters. The higher the value is, the better the clustering effect is, that is, the best number of clusters corresponds to the best evaluation value, as Eq. (4):
In Eq. (4), represents the center point of class . is the average distance between trajectories in class . corresponds to the distance between class and class center points.
The center trajectory should have the maximum value of the density in the traffic flow. Therefore, we can compare the distance between each trajectory in the hierarchical clustering and other trajectories in the traffic flow. And output the trajectories with the smallest sum of weighted Euclidean distance of multidimensional features as the center trajectories of this class. The steps of the algorithm are as follows:
Step 1: Input trajectory data set and sufficiently large cluster number . The weighted Euclidean distance between trajectories in data set is calculated, and the similarity matrix is constructed and standardized.
Step 2: A dynamic array clusters is established to store the clustering results. Clusters contains initial classes, and each class contains a trajectory.
Step 3: The DBI of each candidate cluster number from 2 to is calculated, and the number of clusters corresponding to the minimum index value is .
Step 4: When the number of clusters is larger than , the distance between clusters is calculated.
Step 5: Two clusters with the smallest distance are merged to generate new clusters, and the number of clusters in clusters is reduced by 1.
Step 6: Repeat steps 4 to 5 until the number of clusters is .
Step 7: The sum of the distances from each trajectory in each class to all trajectories in this class is calculated, and the representative trajectory with the smallest sum is taken as the center trajectory.
Step 8: Output clustering results, center trajectory and minimum DBI values.
4. Case analysis
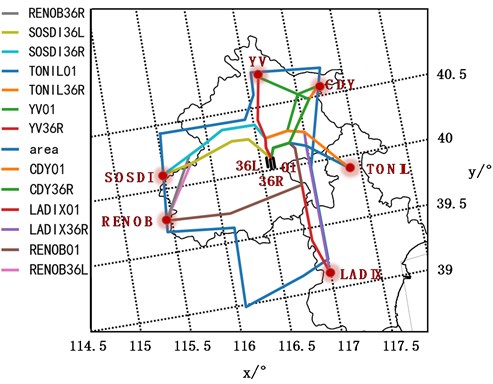
To verify the robustness of the algorithm and the accuracy of the algorithm, 703 radar trajectories, including 69763 data points, are selected as the input of the algorithm. The airport has three runways and six departure corridors. Flights in the terminal area of the airport basically follow regional area navigation (RNAV) procedures and radar guidance for departure flight. The map of 13 departure procedures used on the same day is shown in Fig. 3.
The minimum and maximum data points of a single trajectory in the trajectory set are 64 and 163 respectively. Set the number of resampling points to 50, adopt the method of equal arc length interpolation resampling, retain the first and last trajectory points, resample the trajectory set, and get a new flight trajectory set . The resampling results are shown in Fig. 4. Compared with the off-site RNAV, the trajectory basically conforms to the program. The control points of different departure programs are different, the length of departure trajectory is different, and the time of departure program is also different. The multidimensional characteristics of the trajectory are resampled through the time series equal arc length interpolation, and the trajectory characteristics of different programs are retained. Therefore, it can be used as the input of the trajectory center extraction algorithm.
Fig. 3RNAV departure procedure
Some resampling data are shown in Table 1.
Table 1Resampling results of trajectory data
Callsign | Number | / s | / ° | / ° | / m | / ° | / ° | /km·h-1 |
AAF888 | 1 | 0 | 116.5494 | 40.1268 | 595 | 307.78 | 7.43 | 296 |
AAF888 | 2 | 18.9 | 116.5400 | 40.1340 | 771 | 308.17 | 9.59 | 278 |
AAF888 | 3 | 32.4 | 116.5307 | 40.1415 | 907 | 308.44 | 11.24 | 281 |
AAF888 | 4 | 45.5 | 116.5213 | 40.1489 | 992 | 308.50 | 12.26 | 293 |
AAF888 | 5 | 58.2 | 116.5120 | 40.1564 | 1044 | 310.10 | 12.88 | 301 |
AAF888 | 6 | 70.5 | 116.5030 | 40.1643 | 1080 | 313.45 | 13.31 | 315 |
AAF888 | 7 | 82.2 | 116.4946 | 40.1728 | 1116 | 316.59 | 13.73 | 332 |
AAF888 | 8 | 93.4 | 116.4865 | 40.1817 | 1160 | 318.38 | 14.25 | 350 |
AAF888 | 9 | 104 | 116.4787 | 40.1908 | 1204 | 318.92 | 14.77 | 373 |
Fig. 5 shows DBI’s evaluation of clustering results with different number of clusters. The best number of clusters is 15, and the corresponding index value is 0.0967.
Fig. 4Terminal area off-site resampling
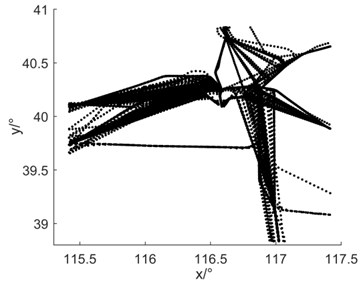
Fig. 5DBI curve
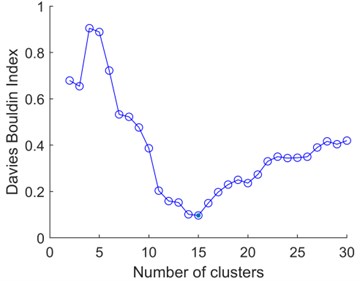
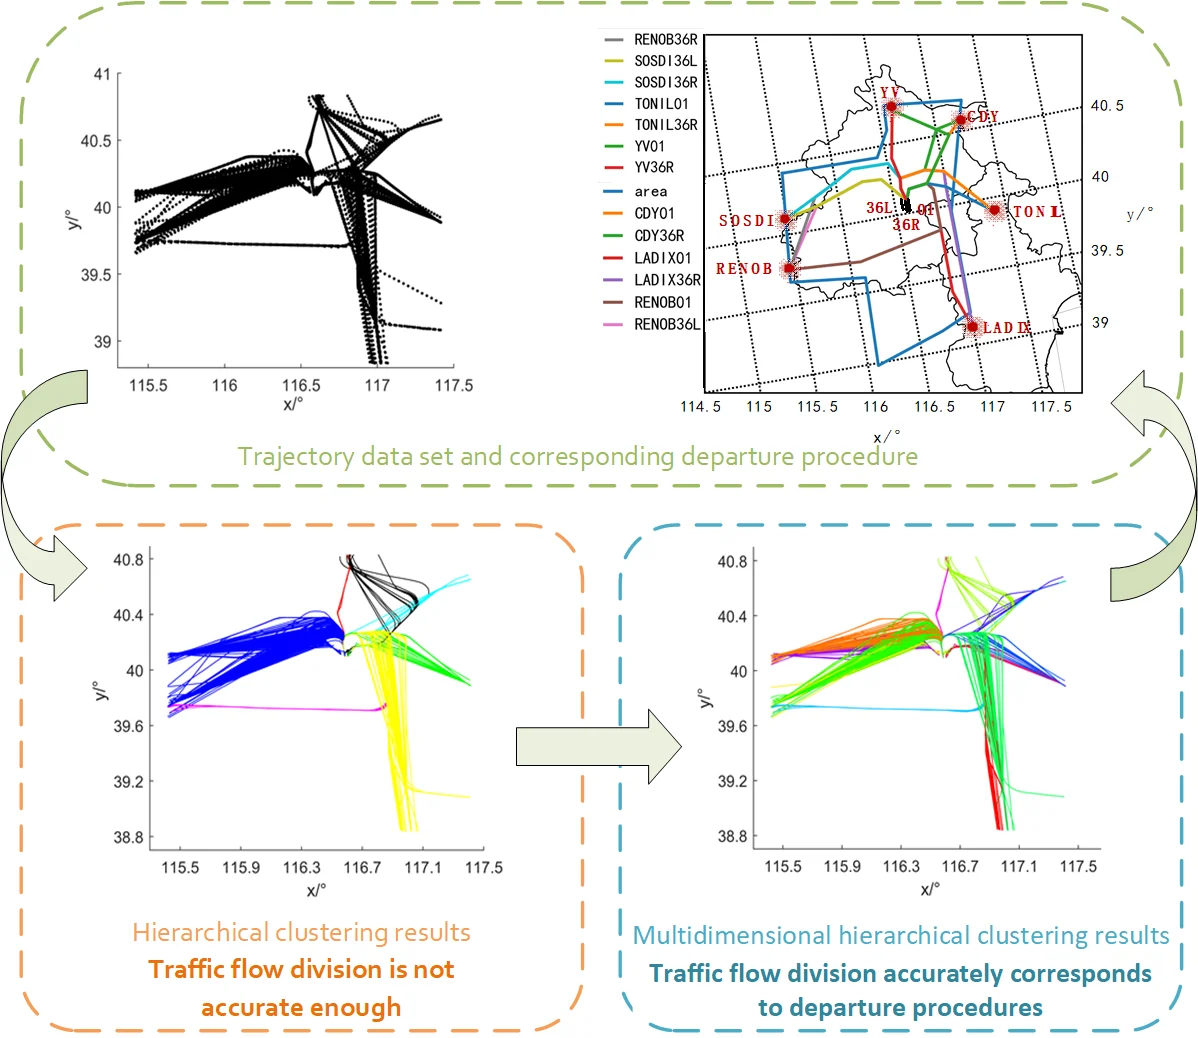
Fig. 6(a) is the experimental control group of traditional hierarchical clustering. The input of traditional hierarchical clustering is the Euclidean distance similarity matrix calculated by trajectory location feature, and the number of clusters needs to be manually specified as 15. Fig. 6(b) is the result of multidimensional hierarchical clustering. The traditional hierarchical clustering divides the 703 tracks into seven categories. The clustering does not distinguish between flights departing from different runways and westbound flights departing from SOSDI and RENOB. Therefore, the results cannot meet the requirements of extracting the center locus. Finally, 13 clusters of traffic flows are obtained by multidimensional hierarchical clustering, and the results can accurately correspond to 13 traffic flows from runway 36L, 36R and 01 to RENOB, SOSDI, YV, CDY, TONIL and LADIX. It is proved that the algorithm has strong robustness to complex operation scenarios.
Fig. 6The clustering results were compared with the 2D graph
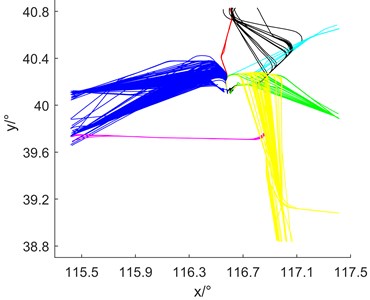
a) Hierarchical clustering results
b) Multidimensional hierarchical clustering results
The experimental results were evaluated by using the cluster internal evaluation index, silhouette index (SI) and classification effect evaluation index, such as accuracy rate, recall rate and F1 score. The larger the SI is, the better the clustering result is. The accuracy rate is the proportion of the actual and correct trajectory in the correct classification and prediction of the algorithm; Recall rate is the proportion of the correct trajectories in the trajectory test set which are classified correctly by the algorithm; F1 score is the weighted harmonic average of accuracy and recall.
Table 2 shows the quantitative results of the experimental group and the control group. Compared with the traditional hierarchical clustering algorithm, the multidimensional hierarchical clustering algorithm is more adaptable and robust, because it does not need to specify the number of clusters in the way of manual input. And the application of multidimensional features makes full use of the ability to construct the details of trajectory features. On the one hand, it reduces the distance of trajectories in traffic flow, on the other hand, it increases the distance between traffic flows. It makes the contour coefficient of clustering increase and the F1 score increase.
Table 2Resampling results of trajectory data
Algorithm | SI | Precision | Recall | F1 score |
Multidimensional hierarchical clustering | 0.9832 | 99.85 % | 98.70 % | 99.20 % |
Hierarchical clustering | 0.8553 | 56.32 % | 56.57 % | 71.8 % |
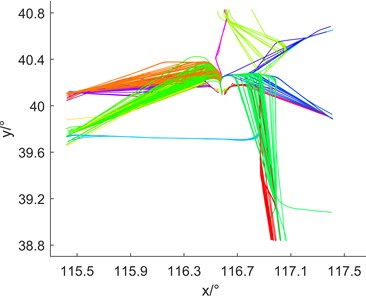
Fig. 7 shows the results of multidimensional hierarchical clustering and the three-dimensional display of the center trajectory, respectively. the center trajectory is a smooth curve with multidimensional attributes such as time, space and speed, which is consistent with the actual flight. Compared with the clustering results, the trajectories extracted by the algorithm can correspond to the densest part of each traffic flow one by one, which directly proves the effectiveness of the algorithm.
Two departure programs with more trajectories are selected, which are 102 trajectories of SOSDI departure from runway 36R and 86 trajectories of RENOB departure, as shown in Fig. 8. the center trajectory extracted by this algorithm is the red line in the graph, which represents the densest trajectory of traffic flow. the characteristics of center trajectory include time, position, direction, velocity and climb gradient, which can use for abnormal trajectory recognition and initial trajectory input for trajectory prediction.
Fig. 73D diagram of experimental results
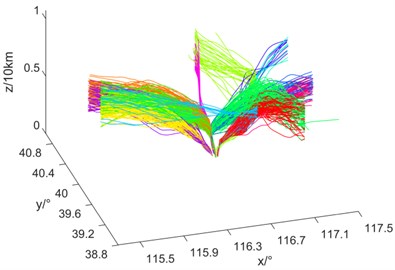
a) Traffic flows distribution
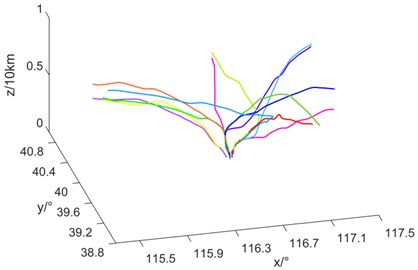
b) Central trajectories
Fig. 8Central trajectory in traffic flow
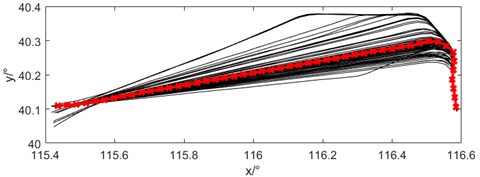
a) SOSDI36R departure
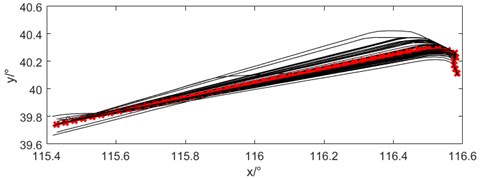
b) RENOB36R departure
5. Conclusions
This paper studies a center locus extraction algorithm based on multidimensional hierarchical clustering. It aims to make full use of the multidimensional features of the trajectory. the resampling of equal arc length interpolation preserves all the spatial and temporal characteristics of the trajectory accurately. Moreover, the weighted Euclidean distance increases the discrimination of traffic flow, making full use of the multidimensional trajectory’s characteristics. in a departure trajectory experiment at a large airport, the results show that the algorithm can obtain the traffic flow distribution and multidimensional feature center trajectory succinctly and efficiently by effectively reducing the data size from the complex operation scene. Thus, it provides a feasible method for aircraft trajectory prediction and a support for dynamic prediction of aircraft trajectory. Future research work includes optimizing multidimensional hierarchical clustering algorithms. and the center trajectory extraction results are compared with the standard departure procedures and quantitatively evaluated.
References
-
N. Li, Y. Qiang, and R. Fan, “Aircraft flight trajectory clustering based on trajectory compression,” (in Chinese), Journal of Chongqing Jiaotong University (Natural Science), Vol. 40, No. 1, pp. 1–6, 2021.
-
Q. Yu, Y. Luo, C. Chen, and S. Chen, “Trajectory similarity clustering based on multi-feature distance measurement,” Applied Intelligence, Vol. 49, No. 6, pp. 2315–2338, Jun. 2019, https://doi.org/10.1007/s10489-018-1385-x
-
B. Murray and L. P. Perera, “Ship behavior prediction via trajectory extraction-based clustering for maritime situation awareness,” Journal of Ocean Engineering and Science, Mar. 2021, https://doi.org/10.1016/j.joes.2021.03.001
-
J. Chang, C. Liu, Q. Zheng, and Y. Li, “Summary and outlook of 4D track prediction methods,” Journal of Mechanical Engineering, Automation and Control Systems, Vol. 1, No. 1, pp. 46–55, Jun. 2020, https://doi.org/10.21595/jmeacs.2020.21553
-
J. L. Ding, T. J. Huang, J. J. Xu, and J. Wang, “Theoretical solution of bearing capacity of shallow circular foundation,” (in Chinese), Computer Engineering and Design, Vol. 41, No. 7, pp. 1935–1940, 2020.
-
X. Tao, X. R. Chen, and Z. P. Lu, “Flight procedure representation of terminal area based on flight tracks clustering,” (in Chinese), Journal of Sichuan University (Engineering Science Edition), Vol. 48, No. 6, pp. 188–196, 2016.
-
Z. Yang, R. Tang, Y. Chen, and B. Wang, “Spatial-temporal clustering and optimization of aircraft descent and approach trajectories,” International Journal of Aeronautical and Space Sciences, Jul. 2021, https://doi.org/10.1007/s42405-021-00401-y
-
D. Zhang, Y. Zhang, and C. Zhang, “Data mining approach for automatic ship-route design for coastal seas using AIS trajectory clustering analysis,” Ocean Engineering, Vol. 236, p. 109535, Sep. 2021, https://doi.org/10.1016/j.oceaneng.2021.109535
-
L. Wang, P. Chen, L. Chen, and J. Mou, “Ship AIS trajectory clustering: an HDBSCAN-Based approach,” Journal of Marine Science and Engineering, Vol. 9, No. 6, p. 566, May 2021, https://doi.org/10.3390/jmse9060566
-
G. Xuhao, Z. Junfeng, and P. Zihan, “Trajectory clustering for arrival aircraft via new trajectory representation,” Journal of Systems Engineering and Electronics, Vol. 32, No. 2, pp. 473–486, Apr. 2021, https://doi.org/10.23919/jsee.2021.000040
-
M. Conde Rocha Murca, R. Delaura, R. J. Hansman, R. Jordan, T. Reynolds, and H. Balakrishnan, “Trajectory clustering and classification for characterization of air traffic flows,” in 16th AIAA Aviation Technology, Integration, and Operations Conference, Jun. 2016, https://doi.org/10.2514/6.2016-3760
-
J.-G. Lee, J. Han, and K.-Y. Whang, “Trajectory clustering: a partition-and-group framework,” in 2007 ACM SIGMOD international conference, pp. 593–604, 2007, https://doi.org/10.1145/1247480.1247546
-
Y. Zheng, D. Sui, J. F. Zhang, and X. G. Wu, “Analysis of the aircraft flight path based on turning points clustering,” (in Chinese), Journal of Wuhan University of Technology (Transportation Science and Engineering), Vol. 39, No. 1, pp. 139–143, 2015.
-
L. Wang and B. Peng, “Track clustering based on LOFC time window segmentation algorithm,” (in Chinese), Nanjing Hangkong Hangtian Daxue Xuebao/Journal of Nanjing University of Aeronautics and Astronautics, Vol. 50, No. 5, pp. 661–665, Oct. 2018, https://doi.org/10.16356/j.1005-2615.2018.05.011
-
S. Du, Y. T. Che, and L. H. Wang, “k-means track clustering based on dynamic time warping metric,” (in Chinese), China Sciencepaper, Vol. 14, No. 6, pp. 664–669, 2019.
-
X. D. Li and F. Cheng, “Computing classical trajectories using density-peak based clustering,” (in Chinese), Journal of CAEIT, Vol. 89, No. 9, pp. 75–80, 2019.
-
S. R. Li, C. Y. Lu, and G. J. Ren, “Aircraft flight trajectory analysis in terminal area based on improved spectral clustering,” (in Chinese), Journal of Wuhan University of Technology (Transportation Science and Engineering), Vol. 43, No. 6, pp. 1130–1134, 2019.
-
I. G. Kang and F. C. Park, “Cubic spline algorithms for orientation interpolation,” International Journal for Numerical Methods in Engineering, Vol. 46, No. 1, pp. 45–64, Jul. 1999, https://doi.org/10.1002/(sici)1097-0207(19990910)46:1
-
S. R. Zhao, C. Wang, and S. M. Li, “Dependable clustering method of flight trajectory in terminal area based on resampling,” (in Chinese), Journal of Southwest Jiaotong University, Vol. 52, No. 4, pp. 817–825, 2017.
-
Y. D. Zhao, Y. J. Tian, and J. X. Wu, “Similarity measurement and cluster analysis of aircraft flight trajectory,” (in Chinese), China Sciencepaper, Vol. 15, No. 2, pp. 249–254, 2020.
-
J. C. Gower and P. Legendre, “Metric and Euclidean properties of dissimilarity coefficients,” Journal of Classification, Vol. 3, No. 1, pp. 5–48, Mar. 1986, https://doi.org/10.1007/bf01896809
-
M. Vlachos, G. Kollios, and D. Gunopulos, “Discovering similar multidimensional trajectories,” in 18th International Conference on Data Engineering, pp. 673–684, Feb. 2002, https://doi.org/10.1109/icde.2002.994784
-
H. Li, J. Liu, Z. Yang, R. W. Liu, K. Wu, and Y. Wan, “Adaptively constrained dynamic time warping for time series classification and clustering,” Information Sciences, Vol. 534, pp. 97–116, Sep. 2020, https://doi.org/10.1016/j.ins.2020.04.009
About this article

This research was supported by Science and Technology Project of North China Regional Air Traffic Management Bureau CAAC, (No. 201904; 202002) and 2020 Civil Aviation Safety Ability Building Funding Project (202072).
