Abstract
To encourage the society to choose the public transportation system, it should comfort and satisfy people. Noise pollution in urban transportation systems is a risk that can endanger passenger health and affect their use of public transportation. Hence, this study investigates the effect of noise pollution on users’ satisfaction of Tehran Metro line 7 using a sound level meter to measure noise pollution in four stations, namely Sanat Square, Tarbiat Modarres University, Shahid Navvab Safavi, and Rudaki. The data was analyzed using noise measurement, and noise pollution is compared at four stations with noise contour maps.
Highlights
- Comparing measurement points in terms of sound pollution at different hours.
- This study is a cross-sectional analysis of Tehran Metro line 7 that entailed measuring and recording sound levels.
- The Leq (dBA) measurements and the sound frequency analysis were taken in each station during movement and station. These measurements were taken at different hours (7AM to 10 PM) in a week.
- The map was used to produce noise pollution level graphs in platforms of four stations to compare with the standard platform noise level.
- Objective observations during measurement suggest that the noise level increased as the train slowed down to a stop and reached its peak when braking near the passenger platform.
- The noise pollution in Navvab station is higher than the other three stations and that Sanat Square station is the quietest. Rudaki station has a higher minimum noise level than other stations, and Navvab station has a higher maximum noise level.
- The results of this study presented in graphic and analytical form indicate that noise pollution is an important determinant of urban planning.
1. Introduction
Noise pollution has drawn attention to itself within the three recent decades, being a big problem in larger cities and seen collectively of the various environmental problems which is on the including increased population density, cars, industrial activities within the proximity of urban areas and construction activities [1].
Public transportation, especially the metro, is a principal source of noise pollution in the urban environment. Train movement sounds in the city is a constant problem that can endanger human health, workers and passengers could be exposed to excessive noise. The main sound sources in the metro are intersections (junctions, pins, switches), wheels rotating on tracks, electric motors, electrical equipment, signals, locomotives, brakes, stops, and the train’s aerodynamic sound. As an environmental pollutant in rail transport, especially inside trains (passenger cars and the cab), noise pollution has received little attention in the literature. The noise inside the train constantly affects passengers and workers during the trip, and could irritate and dissatisfy the public and compromise the comfort of rail transport if left unchecked. The noise inside the train generally emanates from three main sources.
– The external noise of air transferred through car walls.
– The noise transferred via the structure and vibration.
– The air noise from internal sources.
Noise or sound pollution is the unwanted sound that disturb people’s rest or focus during work. Like other environmental pollutions, it negatively affects humans, animals, and inanimate objects, and its analysis and detection require collecting long-term statistical information and sound level maps. Various types of pollution affect human life in more or less known ways, and different countries have codified different strategies to address and reduce them. There are growing complaints about the noise inside the trains, as more passengers and metro staff will be exposed to interior train noise for a longer time with the expansion of the metro system [7, 8]. According to statements released by the World Health Organization (WHO), noise exposure to 85 dB A-weighted over 45 min will lead to noise-induced hearing loss (NIHL) [9].
Zu et al. (2019) measured the effect of Hong Kong’s noise pollution on users’ health and satisfaction, and reported that the peak railway noise level can exceed 110 dB in some cities according to the literature, which far exceeds the 70 dB safe level specified by the World Health Organization (WHO) and the Environmental Protection Agency (EPA). This study described the railway noise level in Hong Kong by analyzing the features of potential sources and presenting technical recommendations to public companies and the railway to evaluate. The overall noise data of the nine city-wide railway lines was presented and compared with other railway lines from around the world [2]. Many achievements concerning the interior noise problem of trains have been made theoretically and numerically. Eade and Hardy [10] investigated the transmission mechanisms of noise generated by various sources into a vehicle train through both the air-borne and structure-borne path. The spectrum results of interior noise show that low-frequency noise accounted for the largest proportion. Forssén et al. [11] proposed a statistical energy analysis model to predict the interior sound field of a railway vehicle. The prediction results were validated by a ray tracing method and scale model measurements. Han et al. [12] investigated the effects of rail corrugation on the interior noise and vibration of a metro vehicle based on the measurements. Li et al. [13] conducted field measurements to examine the interior noise and vibration of a railway vehicle at different speeds with respect to two different rail fastener stiffnesses. Soeta et al. [14] pointed out that the improvement of the acoustic environment in a train’s carriages only through the reduction of the A-weighted SPL inside the carriage was impossible. Currently many studies are undertaken to quantify the uncertainties involved in noise mapping to minimize errors in practical applications. Nilsson, Jones, Thompson, et al. showed that although engineering methods for modelling the generation of railway rolling noise were well established, they involved some simplifying assumptions to calculate the sound powers radiated by the wheel and the track [15]. Earlier studies also indicated the problem of uncertainties in both measurements and noise prediction [16, 17].
In this paper we focused on noise in an urban context. The rail traffic noise is among the main sources of noise in the cities. The aim of this study was to investigate the effects of urban rail noise level in a residential area of Klaipeda city.
Table 1The summary of background research
Author | Year | Country | Title |
Gomez [18] | 2016 | Spain | Urban traffic noise and self reported health |
E. Chevallier, A. C., M. Nadji, L. Leclercq [19] | 2009 | France | Improving noise assessment at intersections by modeling traffic dynamics |
Guarnaccia, C. [20] | 2010 | Wseas transactions on systems | Analysis of traffic noise in a road intersection |
Garg [21] | 2017 | India | Evaluation and analysis of environmental noise pollution in seven major cities of India |
Ki-Hyunkim, D. X. H., Richard J.C. Brown, J.-M. O H, Chan Goo Park [22] | 2012 | china | Some insights into the relationship between urban air pollution and noise levels |
Since Tehran Metro Line 7 has just been established, it is quite obvious that in this short period of time, extensive research has not been done in this field. On the other hand, in order to determine the effect of subway noise pollution on citizens and to what extent it causes their dissatisfaction, it is also one of the innovations of this research. General Objective of this research is to measure the level of noise pollution in the desired points of Metro Line 7. And the practical purpose is to develop appropriate strategies and strategies to reduce noise pollution in line 7 of metro.
2. Research methodology
The variables under analysis in a conceptual model and the description of variable evaluation and measurement:
The variables include various sound parameters, namely sound pressure level ( (dBA)), equivalent sound level ( (dBA)), and sound analysis in various frequencies, times, locations, and more, which will be evaluated as follows:
– Evaluating and comparing various sound parameters, including sound pressure level, equivalent sound level, and sound analysis in various frequencies.
– Comparing measurement points in terms of sound pollution at different hours.
– Evaluating opinions on metro sound pollution.
– Determining the significance of sound pollution on satisfaction.
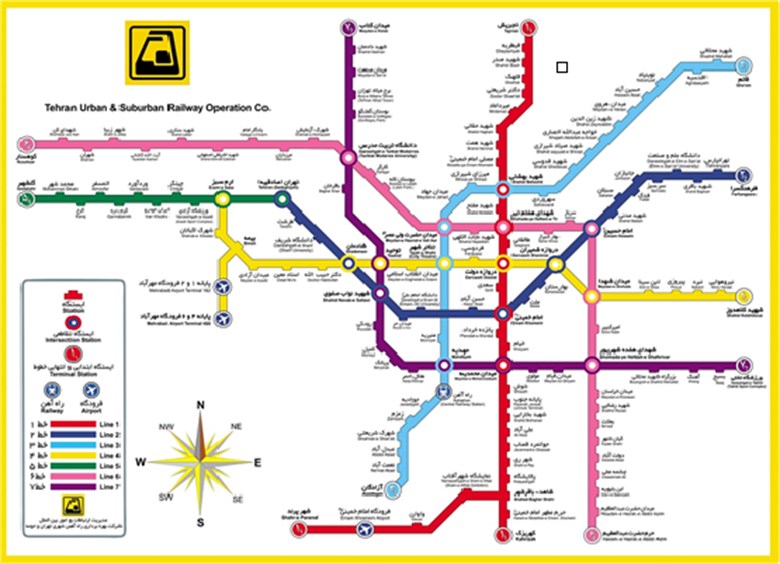
The History of Tehran Metro and Line 7, with 22 stations and 10 currently active stations, namely Sanat Square, Tarbiat Modarres University, Shahid Navvab Safavi, Rudaki, Komeil, Beryanak, Helal-e-Ahmar, Mahdiyeh, Mohammadiyeh Square, and Basij, line 7 connect the south of Tehran at Takhti station to the southwest in Beryanak station, and continues northwest until Ketab Square in Saadatabad. With line 6 under construction in Shahrivar 17th station, this line will cross the Mohammadiyeh station with line 1, Mahdiyeh station with line 3, Shahid Navvab Safavi station with line 2, Towhid station with line 4, and the Tarbiat Modarres station with line 6 (under construction). After the 2017 trial operation of the central Tehran Metro line 7 and the following trial of the north and south sections in April and March, the inauguration of the 22 km Tehran Metro line 7 and line 5 with 7 stations coincided on June 10, 2017. The stations inaugurated were respectively Sanat Square, Tarbiat Modarres, Shahid Navvab Safavi, Komeil, Beryanak, Mohammadiyeh Square, and Basij. Map of Tehran metro stations is shown in Fig. 1 [3].
Fig. 1Map of Tehran metro stations
The statistical population of this study consists of trains and metro users. The sampling was conducted with data collection and the information was obtained by point measurement using sound level meter. This study is a cross-sectional analysis of Tehran Metro line 7 that entailed measuring and recording sound levels. These measurements were taken from Sanat Square, Tarbiat Modarres, Navvab Safavi, and Rudaki stations at three points inside station platforms and different hours of week, including the center and both ends of the platform, as well as car interiors during the trip from Sanat Square to Rudaki station (covering the stations under analysis). These measurements were taken in motion and station. The (dBA) measurements and the sound frequency analysis inside the cab and passenger cars were taken in each station during movement and station. These measurements were taken at different hours (7 AM to 10 PM) in a week. Sound analysis followed the Iranian standards approved by the Supreme Council of Environment and ACGIH.
3. Influential parameters
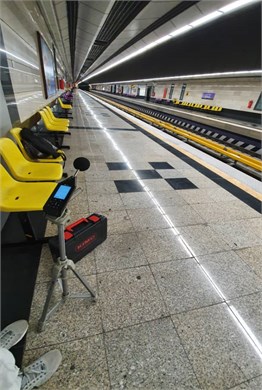
The KIMO DB 200 sound level meter was used for sampling and measuring sound parameters in stations and the device was calibrated before measurement. The DB200 sound level meter is supplied with LDB200 software for display data and measurement report printing. The way of using the instrument has at least as much importance on result than device quality. The sound level meter is designed for a free-field acoustic measurement. The instrument is held with reached out arm for short-time measurement. The axis of the instrument must face sound source, do not interfere with own body or with any close material item. Protect the instrument from bad weather, and use as much as possible the windscreen. It protects the microphone and minimizes during measurement the disruptive effects linked to air currents. For calibrating the instrument regularly use a suitable calibrator CAL200 type. The measuring point for example is shown in Fig. 2.
Fig. 2The point that measured with The KIMO DB 200 sound level meter in Sanat Station
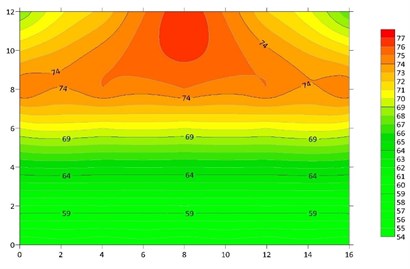
For a more conceptual description of the problem and the sound level at each station, the Surfer software was used to produce noise pollution level graphs in platforms of four stations to compare with the standard platform noise level. Navvab Station had a higher equivalent sound level indicator in a specific time period () than the other three stations, and the first assumption for explaining the sound pollution is the large crowd of passengers. Sanat Square, however, was the quietest station. The equivalent sound level in a specific time period () was 83 in Navvab Station and 77 in Sanat Square, which satisfies the other assumption regarding the environmental sound pollution recorded and the lack of supervision. The sound level measured in most points exceeded the permissible limit (65 dB) as Sanat station, the quietest station until the train’s arrival and departure, exceeded the standard limit with a 77 dB equivalent sound level. Objective observations and measurements at stations suggest that the highest sound level is attributed to the moment of braking, which significantly increases the average sound level.
4. Results (generating the noise level map)
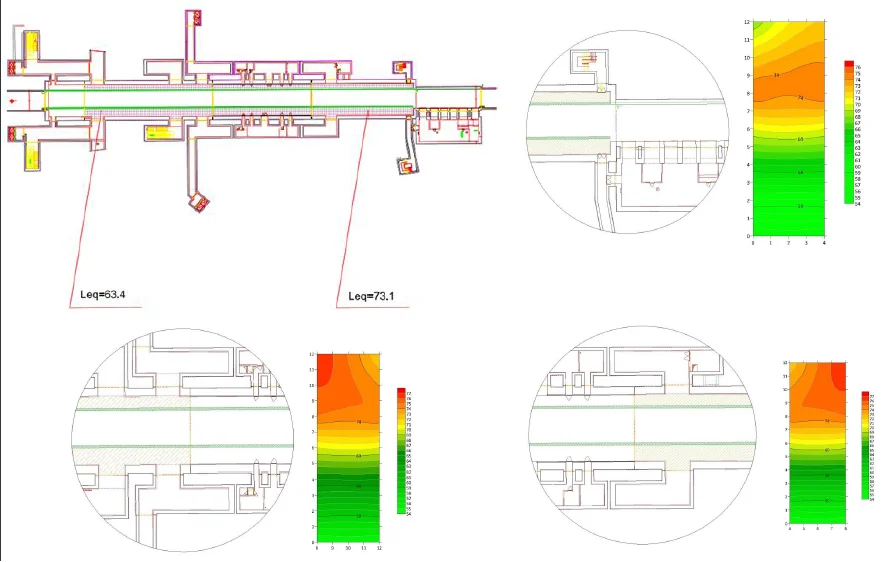
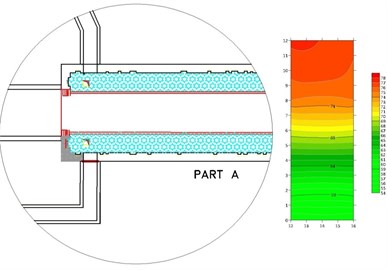
This section will use Surfer to evaluate the noise levels recorded from stations from train entry to full stop and obtain a better understanding of the sound level in four stations (Sanat Square, Tarbiat Modarres University, Navvab Safavi, and Rudaki). The layout of the four stations is shown in Fig. 3. The layout of each stations are shown in Figs. 4-7. As the figures suggest, the highest noise pollution belongs to the middle of Sanat station.
Fig. 3The layout of the four stations
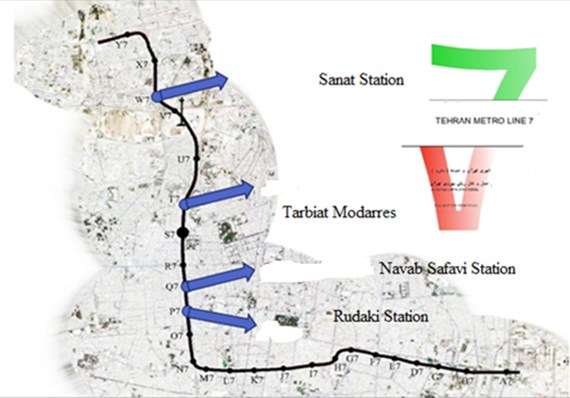
Fig. 4The layout of the Tarbiat Moddares station
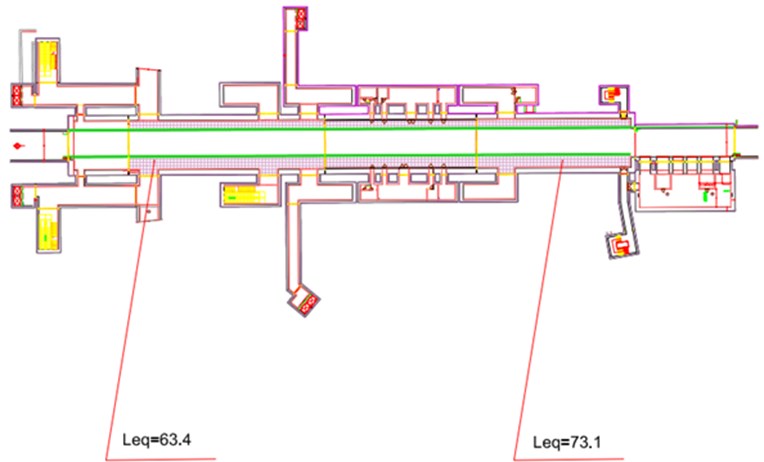
Fig. 5The layout of the Rudaki station
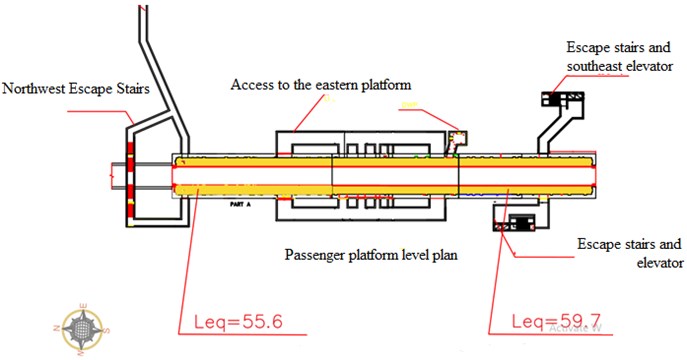
Fig. 6The layout of the Sanat station
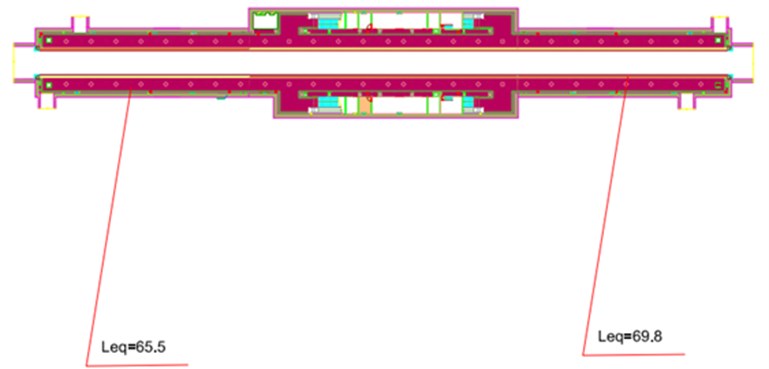
Fig. 7The layout of the Navab Safavi station
According to the standard, the noise level map is in the green zone until 65 dB, followed by yellow, orange, and red for higher noise levels. Noise maps for stations are shown in Figs. 8-27. Objective observations during measurement suggest that the noise level increased as the train slowed down to a stop and reached its peak when braking near the passenger platform. Compared to the middle part, the noise level at the end of the platform drops before full stop, which is shown in the previous figures. County regions of Iran are divided into 5 categories based on this standard is shown in Table 2. Law on determining the permissible limits of noise in the open air of Iran. Pursuant to Article 2 of the Executive Regulations on the Prevention of Noise Pollution, approved at the meeting dated 2002 of the Council of Ministers, the permissible limits of noise in the open air of Iran are determined as follows and agreed to be implemented in the country from the date of approval [4].
Table 2Outdoor permitted amount of noise in Iran [4]
Type of area | Average day balance (7 AM to 10 PM) | Average night balance (10 PM to 7 AM) |
Residential area | 55 db | 45 db |
Complex area (commercial-residential) | 60 db | 50 db |
Commercial – administrative area | 65 db | 55 db |
Area of activity (residential-industrial) | 70 db | 60 db |
Industrial zone | 75 db | 65 db |
Fig. 8Noise level in the platform level of Sanat Square station
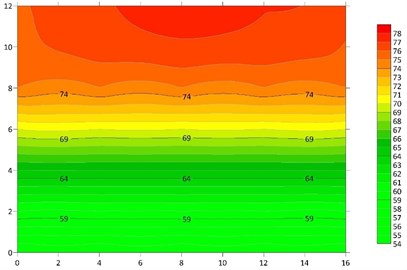
Note for figures: The vertical axis is the width of station for noise measuring (meter).
The Horizontal axis is the length of the station for measuring noise that is 0-160 meters and divided to 8 sections (8×20 = 160 meters)
It should be noted that in the diagrams, the vertical axis determines the sound level and the vertical axis is the distance of the sound level measuring station from the edge of the platform in each station. It is also noted that all stations of Tehran Metro Line 7 are 160 meters long.
The vertical axis is the width of station for noise measuring (meter).
As can be seen in the Figs. 8-13, the highest level of pollution is in Sanat station in the middle of the station. According to the noise pick-up time, the noise level when the train stops is increasing from the moment the train enters the station and at the moment of complete stopping the brake noise reaches the maximum, which is the highest in the middle of the passenger platform and then the noise level at the end. The platform reaches less than the center range in the moments before the complete stop, which is quite evident in the above figures.
According to the above diagram, it can be understood that when the train entered the station, at first the sound level was low due to the absence of the train at the station, and then gradually and after the train braking, this sound increased until the complete stop. Also, in the first 40 meters, the recorded sound level is higher than 80 decibels, of which 6 data were recorded, due to the high sound of the train brake, which raised the sound level in an instant, and as it is clear, the highest sound recording is in the intervals. 70 to 75, 75 to 80 and 70 to 75 for the moment the train arrives until it stops completely.
Fig. 9Magnifying the noise level of Sanat station, part 1
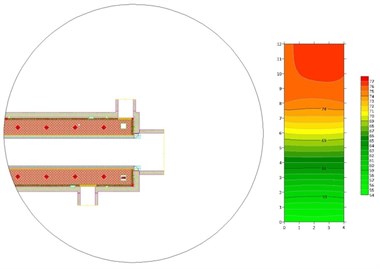
Fig. 10Magnifying the noise level of Sanat station part 2
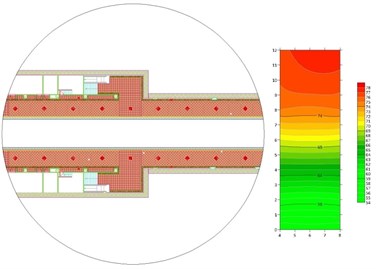
Fig. 11Magnifying the noise level of Sanat station, part 3
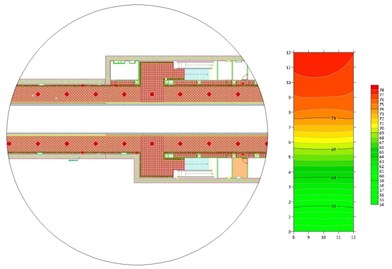
Fig. 12Magnifying the noise level of Sanat station, part 4

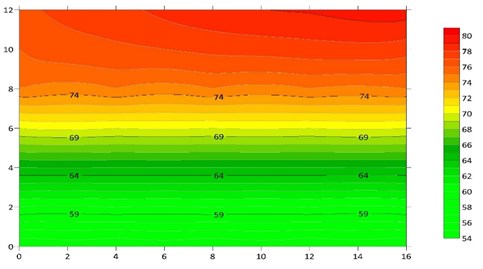
Fig. 13Noise level in the platform level of Tarbiat Modarres station
As shown in the figures, the highest level of pollution in Sanat station is in the middle of the station. According to objective observations during pick-up, the sound level when the train stops is increasing from the moment the train enters the station and at the moment of complete stopping the brake noise reaches the maximum, which is the highest in the middle of the passenger platform. During deceleration and braking interval, the noise levels are high due to additional noise sources, such as the braking system and the railway infrastructure condition. The end of the platform is less than the middle range in the moments before the complete stop. The unacceptable noise levels compared with the international standards of noise exposure led to more investigation on factors that may affect noise levels inside metro units, such as the speed of the train, the horizontal alignment, and the type of station. Concerning the noise-speed relationship, the noise is directly proportional to the speed of the train regardless of the type of the train until the train reaches a certain speed, and then noise starts to decrease again. The cause of this phenomenon is that at high speeds, the friction decreases, and so the produced noise decreases as well. The speed at which the noise curve decrease is different from one type to another depending on the maintenance status and the train type.
Fig. 14Magnifying the sound level of Tarbiat Modarres station, part 1
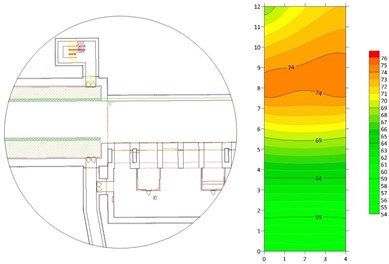
Fig. 15Magnifying the noise level of Tarbiat Modarres station, part 2
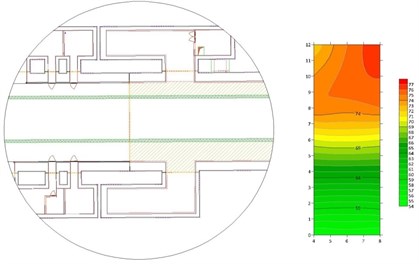
Fig. 16Magnifying the sound level of Tarbiat Modarres station, part 3
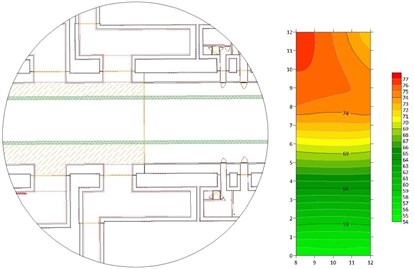
Fig. 17Magnifying the sound level of Tarbiat Modarres station, part 4
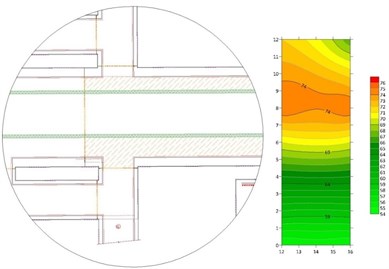
Fig. 18Noise level in the platform level of Navvab Safavi station
The results obtained from the tests suggest that:
– All groups except one had excessive sound pollution
– Stations have different sound pollution levels and can be generally categorized into four groups.
– The train departure from Rudaki station has the lowest sound pollution and a class of its own, the departure from Sanat square and the stop in Tarbiat Modarres belong to one group, and the rest were divided into two groups, although many shared the same two groups. Passengers who usually travel with the metro considered its sound pollution more irritating than did other participants with different objectives, possibly due to their daily presence in the metro. At the same time, people who use the metro for recreational purposes were less sensitive to environmental noise.
Fig. 19Magnifying the noise level of Navvab Safavi station, part 1
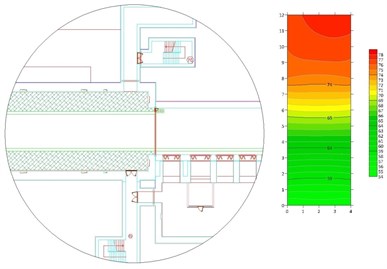
Fig. 20Magnifying the sound level of Navvab Safavi station, part 2
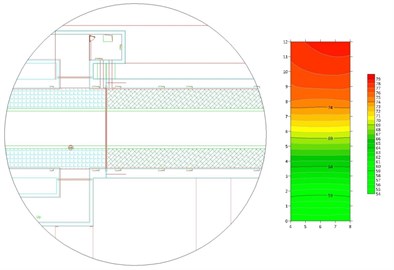
Fig. 21Magnifying the noise level of Navvab Safavi station, part 3
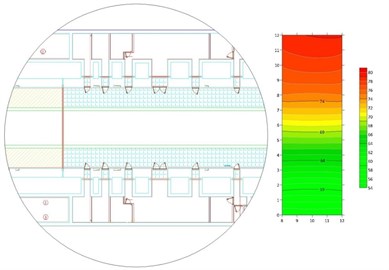
Fig. 22Magnifying the noise level of Navvab Safavi station, part 4
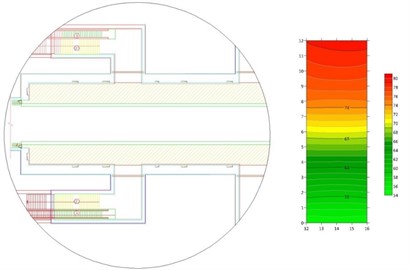
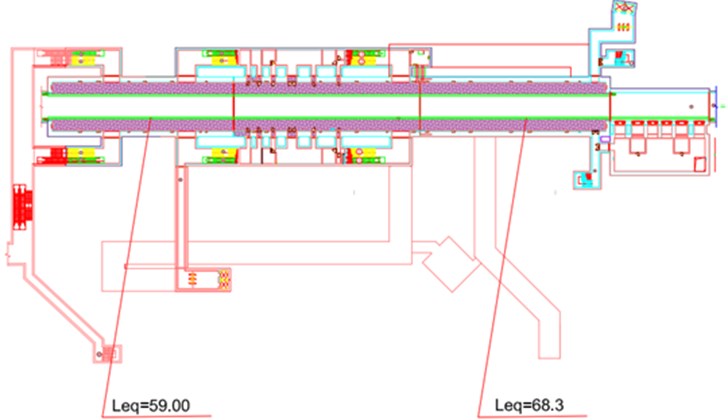
Fig. 23Noise level in the platform level of Rudaki station station
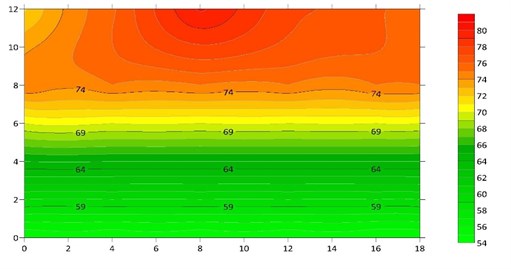
Fig. 24Magnifying the noise level of Rudaki station station, part 1
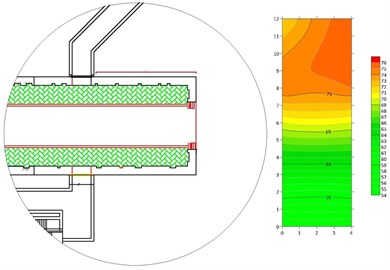
Fig. 25Magnifying the noise level of Rudaki station station, part 2
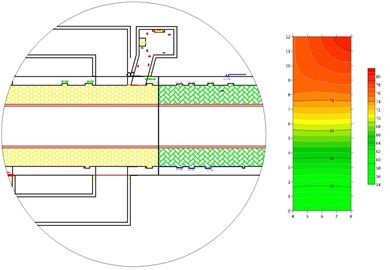
Fig. 26Magnifying the noise level of Rudaki station station, part 3
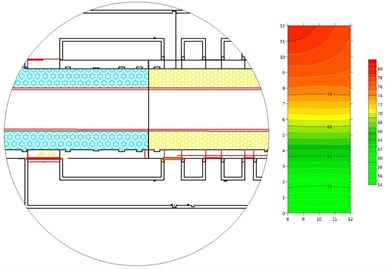
Fig. 27Magnifying the noise level of Rudaki station station, part 4
5. Conclusions
There are various indicators for measuring noise pollution at different areas of the metro. Hence, the table of descriptive statistics of measured indicators is presented as follows. Fig. 28 evaluates the minimum, maximum, and average sound levels in four stations, which indicates that the noise pollution in Navvab station is higher than the other three stations and that Sanat Square station is the quietest. Rudaki station has a higher minimum noise level than other stations, and Navvab station has a higher maximum noise level. Due to measuring the effect of noise pollution on citizens’ satisfaction in various stations, this parameter is not specifically dependent on a single factor, but requires presenting more general indicators.
Table 3 compares the noise pollution indicator of various regions. The and indicators are used to prevent accounting for outlier data. As the Table 3 shows, the Sanat Square station has the lowest and the Navvab Safavi station has the highest of all stations. Regarding the level that is exceeded by 90 % of the entire measurement period, Rudaki station at 60.1 was the lowest (quietest) and Navvab Safavi at 67.2 was the highest (busiest). The sound pollution of stations was compared using the TNI indicator, which shows the equivalent sound level for continuous traffic load condition. The Sanat Square Station was the quietest while Tarbiat Modarres was the busiest. The irritation caused by noise, which depends on the average sound level and sound source variability, was calculated using the NPL parameter. A tangible correlation between the satisfaction of individuals and this person is expected. According to measurements, Navvab and Tarbiat Modarres stations had a higher noise irritation than Sanat Square station. The Rudaki station’s noise irritation was also at a better state than the Tarbiat Modarres and Navvab stations.
Fig. 28Noise level in stations
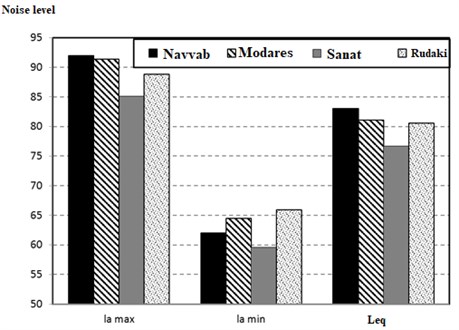
Table 3Comparison of noise pollution indicators in stations
Station name | ||
Navvab | 91.1 | 67.2 |
Tarbiat Modares | 89 | 63.3 |
Sanat | 78.3 | 62.9 |
Roudaki | 81.9 | 60.1 |
Weakly developed road networks and the absence of ring roads that shift road traffic outside residential districts are a widespread problem in the cities [5]. Acoustic maps developed for large cities are an abundant source of analytical data concerning the spatial distribution of noise sources. They are used to identify the correlations between noise and metro. The results of this study presented in graphic and analytical form indicate that noise pollution is an important determinant of urban planning. Taking into account that sensitivity to noise might be responsible for a substantial part of inter-individual variance in sleep disturbance induced by noise and that about 20 % of people are more sensitive to noise, we suggest that measures to reduce noise exposure should focus on the time and follow the noise standard [6]. Methodology for noise reduction on railways for consistent design of noise prevention measures, especially location, dimensions and acoustic properties of noise barriers and measures on the buildings themselves. The noise control measures are planned after the noise level is measured at different locations are as follows:
1. Specification of the area of interest – a user-defined polygon, which delimits the assessed area. Area of interest is defined by a strip (region) with a width of at least 10 m from the route of the railway line 7 metro in the stations.
2. Definition of railway communications – size, shape, character of trains’ run, quality of the superstructure and the like.
3. Design of noise barriers – at this stage 3D dimensions of all objects, acoustic properties of the walls and the height of the walls are determined.
4. Modelling the proposed route of the railway line – using software for predicting noise immissions in the exterior, all elements of the proposed routes – bridges, overpasses, cuts, embankments, elevated highways, and so on are modelled.
5. Input of the expected number and types of trains, their speeds, lengths, run character and so on.
6. Calculation of noise immissions in the area of interest. The objective is to develop a noise map of the area of the railway section using methods of mathematical modelling, using a methodology for traffic noise modelling.
7. Optimization of noise barriers – designed noise barriers will be optimized so that the permissible values determining the quantities of noise in accordance with applicable legislation have not been exceeded on the area of interest.
8. Proposal of other technical arrangements - arrangements for construction projects.
References
-
W. Passchier-Vermeer and W. F. Passchier, “Noise exposure and public health.,” Environmental Health Perspectives, Vol. 108, No. suppl 1, pp. 123–131, Mar. 2000, https://doi.org/10.1289/ehp.00108s1123
-
S. Y. Xu, C. Jiang, and L. Huang, “Public health impacts from subway noise: case study Hong Kong,” The Journal of the Acoustical Society of America, Vol. 145, No. 3, pp. 1867–1867, Mar. 2019, https://doi.org/10.1121/1.5101747
-
“The deepest metro line in Tehran was opened,” (in Persion), Tehran Urban and Suburban Railway Operation Company Report, 2019.
-
S. H. Mirhossain and H. R. P., “Evaluation and analysis of the environmental noise of Arak, Iran,” Journal of Applied Sciences, Vol. 8, No. 7, pp. 1333–1336, Mar. 2008, https://doi.org/10.3923/jas.2008.1333.1336.
-
A. Szczepańska, A. Senetra, and M. Wasilewicz, “Traffic noise as a factor influencing apartment prices in large cities,” Real Estate Management and Valuation, Vol. 22, No. 3, pp. 37–44, Oct. 2014, https://doi.org/10.2478/remav-2014-0025
-
L. Stošić, G. Belojević, and S. Milutinović, “Effects of traffic noise on sleep in an urban population,” Archives of Industrial Hygiene and Toxicology, Vol. 60, No. 3, pp. 335–342, Sep. 2009, https://doi.org/10.2478/10004-1254-60-2009-1962
-
Gershon R. R. M., et al., “Health and safety hazards associated with subways: a review,” Journal of Urban Health: Bulletin of the New York Academy of Medicine, Vol. 82, No. 1, pp. 10–20, Feb. 2005, https://doi.org/10.1093/jurban/jti004
-
T. Münzel et al., “Environmental stressors and cardio-metabolic disease: part II-mechanistic insights,” European Heart Journal, p. ehw294, Jul. 2016, https://doi.org/10.1093/eurheartj/ehw294
-
R. Guski, D. Schreckenberg, and R. Schuemer, “WHO environmental noise guidelines for the European region: a systematic review on environmental noise and annoyance,” International Journal of Environmental Research and Public Health, Vol. 14, No. 12, p. 1539, Dec. 2017, https://doi.org/10.3390/ijerph14121539
-
P. W. Eade and A. E. J. Hardy, “Railway vehicle internal noise,” Journal of Sound and Vibration, Vol. 51, No. 3, pp. 403–415, Apr. 1977, https://doi.org/10.1016/s0022-460x(77)80083-7
-
J. Forssén, S. Tober, A. C. Corakci, A. Frid, and W. Kropp, “Modelling the interior sound field of a railway vehicle using statistical energy analysis,” Applied Acoustics, Vol. 73, No. 4, pp. 307–311, Apr. 2012, https://doi.org/10.1016/j.apacoust.2011.09.012
-
J. Han, X. Xiao, Y. Wu, Z. Wen, and G. Zhao, “Effect of rail corrugation on metro interior noise and its control,” Applied Acoustics, Vol. 130, pp. 63–70, Jan. 2018, https://doi.org/10.1016/j.apacoust.2017.09.007
-
L. Li, D. Thompson, Y. Xie, Q. Zhu, Y. Luo, and Z. Lei, “Influence of rail fastener stiffness on railway vehicle interior noise,” Applied Acoustics, Vol. 145, pp. 69–81, Feb. 2019, https://doi.org/10.1016/j.apacoust.2018.09.006
-
M. D. Seidman and R. Standring, “Noise and quality of life,” International Journal of Environmental Research and Public Health, Vol. 7, No. 10, pp. 3730–3738, Oct. 2010, https://doi.org/10.3390/ijerph7103730
-
C.-M. Nilsson, C. J. C. Jones, D. J. Thompson, and J. Ryue, “A waveguide finite element and boundary element approach to calculating the sound radiated by railway and tram rails,” Journal of Sound and Vibration, Vol. 321, No. 3-5, pp. 813–836, Apr. 2009, https://doi.org/10.1016/j.jsv.2008.10.027
-
Alberola A. J., Mendoza L. J., Bullmore A. J., and Flindell I. H., “Noise mapping: uncertainties,” in Proceedings of Forum Acusticum, 2002.
-
Probst W., “Uncertainties in the prediction of environmental noise and in noise mapping,” Acoustique and Techniques, Vol. 40, pp. 34–39, 2011.
-
L. Gómez-Jacinto and F. Moral-Toranzo, “Urban traffic noise and self-reported health,” Psychological Reports, Vol. 84, No. 3_suppl, pp. 1105–1108, Jun. 1999, https://doi.org/10.2466/pr0.1999.84.3c.1105
-
E. Chevallier, A. Can, M. Nadji, and L. Leclercq, “Improving noise assessment at intersections by modeling traffic dynamics,” Transportation Research Part D: Transport and Environment, Vol. 14, No. 2, pp. 100–110, Mar. 2009, https://doi.org/10.1016/j.trd.2008.09.014
-
Claudio Guarnaccia, “Analysis of traffic noise in a road intersection configuration,” WSEAS Transactions on Systems, Vol. 9, Aug. 2010.
-
N. Garg, A. K. Sinha, M. Dahiya, V. Gandhi, R. M. Bhardwaj, and A. B. Akolkar, “Evaluation and Analysis of Environmental Noise Pollution in Seven Major Cities of India,” Archives of Acoustics, Vol. 42, No. 2, pp. 175–188, Jun. 2017, https://doi.org/10.1515/aoa-2017-0020
-
K.-H. Kim, D. X. Ho, R. J. C. Brown, J.-M. Oh, C. G. Park, and I. C. Ryu, “Some insights into the relationship between urban air pollution and noise levels,” Science of The Total Environment, Vol. 424, pp. 271–279, May 2012, https://doi.org/10.1016/j.scitotenv.2012.02.066
About this article

