Abstract
Instead of the conventional use of micro-electro-mechanical system (MEMS) hotplate for metal oxide semiconductor (MOS) or nondispersive infrared (NDIR) gas sensing, it was used for photoacoustic (PA) gas sensing. A low-cost MEMS microphone was used for the development of this MEMS hotplate PA carbon dioxide (CO2) sensor. To the knowledge of the authors, this is the first time that a MEMS hotplate and a MEMS microphone are combined for use in gas sensing with high modulation frequency. NDIR sensors use much more expensive photodetectors compared to the MEMS microphone used in this work. The MEMS hotplate and MEMS microphone have the desired characteristics of low power consumption, small size and low cost. The hotplate as a blackbody is a good infrared emitter which is suitable for CO2 detection around the 4.26 µm absorption band. Despite the significant radiation power loss due to high modulation frequency, the remaining/reduced power radiation power was still sufficient to excite CO2 molecules for PA signal generation. Temperature analysis on the sensor showed that PA signal decreases with an increase in temperature, which implies that compensation must be provided for such temperature effects. This work provides alternative optical gas sensing that is comparatively inexpensive compared to the conventional NDIR sensors and by using components that can be easily mass-produced, thereby making a valuable contribution to the fight against air pollution and global warming.
1. Introduction
Many natural and anthropogenic processes are sources of carbon dioxide (CO2) emission into the atmosphere. The natural processes cannot be stopped; however, something can be done regarding the emission that comes from human activities. As an insidious gas, CO2 concentration in the atmosphere is increasing rapidly [1] and it has a remarkable contribution to air pollution and global warming. To improve indoor air quality, it is essential to monitor (using sensors) and control CO2 concentration in buildings, transport areas [2] and the environment. Apart from the need to monitor CO2 concentration in the atmosphere because of its harmful effects, it is also extremely important to measure its concentration because of its widespread industrial applications. Some use of CO2 in industry include food packaging, production of chemicals, fire extinguishers, refrigeration, welding, purification of water, beverage manufacture and bacterial growth inhibition in agriculture [3].
There is a growing demand for gas sensors that are low power consuming [2], inexpensive and small in size [4]. Therefore, in this work a photoacoustic (PA) CO2 sensor was developed using a MEMS hotplate and a MEMS microphone. The hotplate is EMIRS 200 micro hotplate, packaged in TO-39 compact casing with a reflector and the microphone is SUP01410HR5H-PB. This combination of components in this PA sensor is novel because this is the first time that this is done, to the best of our knowledge. NDIR sensors use much more expensive photodetectors compared to the MEMS microphone used in this work. The MEMS hotplate and MEMS microphone have the desired characteristics of low power consumption, small size and low cost. Micro hotplates are predominantly used in metal oxide sensors and as infrared emitters for gas sensing applications. In metal-oxide-semiconductor (MOS), the hotplates are deposited with different selective gas sensing films which are heated by the micro heater and then the generated signal that is proportional to the gas concentration is measured. The sensing films are usually tin oxide (SnO2) or other metal oxides. Operation of the sensor is based on the principle of the sensing film’s conductivity variation with respect to change in concentration of the gas [5]. Conductance of the film, rates of reaction of the absorbed substances on the film and the amount of gases it absorbs, among other things, can be affected by the temperature of the sensor surface [6]. Neither MOS nor the non-dispersive infrared (NDIR) are used in this work. The use of MEMS hotplate here is for the development of a photoacoustic CO2 sensor.
The wide spectrum and very high lifetime of micro hotplates make them ideally suitable for use as infrared emitters [7]. The spectrum produced by a micro hotplate is very similar to the one given by a black body (BB) [8]. Adjustment of this spectrum can be done by using the emissivity of the body which is a unitless factor. All hot bodies emit electromagnetic (EM) radiation which makes them behave like a BB. The radiation of a BB is a characteristic, continuous frequency spectrum that is dependent only on the temperature of the body. The peak of the spectrum shifts to shorter wavelengths as the body’s temperature is increased. At room temperature most of the emitted wavelengths are in the infrared region of the EM spectrum and when the temperature is raised beyond the amount needed for IR, the emission becomes more of visible light. The radiation spectrum of a BB is shown in Fig. 1, generated from Microsoft excel using Eq. (1).
Fig. 1Black body radiation curves for temperatures at 873 K, 773 K and 673 K, generated from Microsoft Excel using Eq. (1)
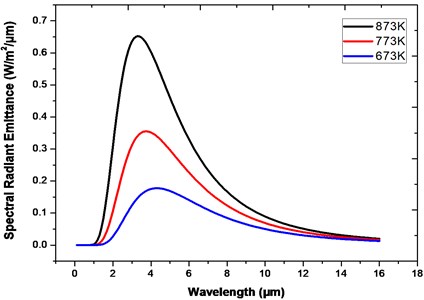
The total areas under the curves increase with temperature, signifying that a hotter body radiates more energy per unit volume. A black body radiation is the EM radiation emitted by a BB in thermal equilibrium. This radiation is emitted based on Planck’s energy distribution, given as [9]:
Fig. 1 as a representation of Planck’s distribution, confirms that the maximum emitted power is shifted toward shorter wavelengths when the temperature is increased. The emitted radiation power of a BB at the wavelength of 4.26 μm is considerably higher when the temperature is at 873K compared to the very low value obtained around 10 μm at the same temperature.
Micro hotplate structures can be divided into two, namely the closed-type membrane and suspended-type membrane. In the former, the membrane overlaps the silicon substrate along its periphery while the latter is the case where supporting beams suspend the membrane on silicon substrate, thus it is called the “suspended beam” design. Thermal losses to the substrate in the suspended beam structure are highly minimized because they only occur through the supporting beams, unlike in the closed-type design. This is the main reason why the suspended beam design is preferred, since heat loss to the supporting substrate usually dominates the power consumption of a micro hotplate. The heat transfer in a micro hotplate is based on three processes, they are (i) thermal conduction (ii) convection and (iii) thermal radiation. Therefore, its total heat loss can be expressed as [10]:
where is the resistance of the heater, is the current passing through the heater and is the heating time. Also, is the heat conduction through a closed membrane or supporting beams, is the heat conduction through the surface, is the heat conduction through the ambient air (also known as convection losses), is the heat loss via radiation, and represents unknown heat losses including free convection. The transfer of thermal energy within the micro hotplate is what is referred to as heat transfer. Determination of the dimensions of the heating element is done by taking into account the total power loss that can occur during operation. This is done to minimise the power loss as a consequence of the reduction of the heat conduction between the heated area and the surrounding regions. Since the sensor works based on the photoacoustic effect, it is essential to look at what the photoacoustic effect means.
The photoacoustic effect was discovered by Alexander Graham Bell in 1880 [11] and has gone through many phases of advancements up to this present time [12]. The PA effect in gases occurs when a modulated radiation is absorbed by gas molecules and they become excited to higher energy states. Their collisional de-excitation generates heat and pressure (acoustic) waves that are periodic, in line with the modulation of the radiation. In PA gas sensing, microphones are used to detect the acoustic signal which is proportional to the gas concentration. The PA effect occurs in gases because most of them have characteristic fingerprints of radiation absorption. For CO2, its absorption is around the wavelength of 4.26 μm [13]. The acoustic signal generated when heat H is produced by the absorption of light by the gas sample can be represented by the lossless inhomogeneous wave Equation [4]:
where is the acoustic pressure, is the velocity of sound and is the specific heat ratio or adiabatic constant of the gas. This equation is loss free because it does not include the viscous and thermal losses. Taking the Fourier transform of Eq. (3) gives:
And:
Eq. (3) can be solved by taking the time Fourier transform on both sides and expressing the solution as an infinite series expansion of the normal mode solution of the homogenous wave equation which are determined by the boundary conditions. The walls of the PA cell are assumed to be rigid, implying that the normal derivative of the pressure is zero at the walls or boundary. This is described by Eq. (5):
This equation represents the assumption that the walls of the cell are sound-hard. The generation of PA signal involves two processes, namely the production of periodic heat followed by the second step which is the generation of PA signal. Both processes are dependent on the absorption of modulated light energy. For vibrational excitation (which dominates in the target gas of this work, CO2), photon radiation and photochemical reactions are insignificant, because the radiative lifetimes of vibrational levels are longer than the non-radiative lifetimes in the PA process. In addition, the photon energy is insufficient to cause a photo chemical reaction. When the modulation frequency of the radiation is slower than the rate of the non-radiative relaxation, the latter dominates, giving rise to PA signal generation [14].
2. Characterisation of sensor components
It is essential to understand the behaviour of the key components used in this sensor before the design will be discussed. Therefore, the characteristics of the MEMS microphone and the MEMS hotplate which are central to this work will be briefly explained.
2.1. SUP01410HR5H-PB MEMS microphone
This microphone has a dynamic range of 0-10 kHz as shown in Fig. 2. The plot of this microphone output signal against frequency in the laboratory shows that ambient noise dominates from 0 Hz to the region close to 1 kHz. The plot was captured by a Hewlett-Packard (HP) 7470A Plotter Emulator which was used to connect the signal analyser to the computer. The output of the microphone placed on the cell was connected to the analyser.
Fig. 2Microphone frequency response when there was no gas in the cell and the radiation source was switched off
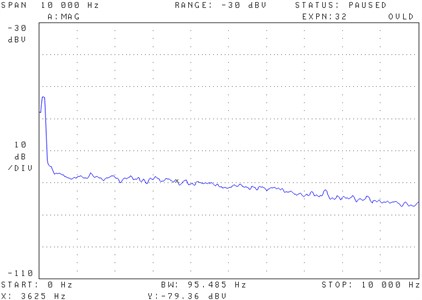
It can be seen that from approximately 1 kHz-10 kHz the microphone frequency response is less affected by 1/f noise. This spectrum helped in determining the modulation frequency and hence the PA cell length, as explained further in the sensor design section.
2.2. The EMIRS 200 micro hotplate
The EMIRS 200 micro hotplate packaged in TO-39 compact casing with a reflector was used as the radiation source in a non-dispersive infrared (NDIR) arrangement for this characterisation. Lead selenide (PbSe) was used as the detector. PbSe is a photoconductive detector whose resistance changes when it is illuminated by IR radiation. This characteristic makes it possible to measure the amount of radiation that it receives. Measurements were performed in two ranges; 5-100 Hz and 500 Hz-4 kHz and the plots of Fig. 3 show what happened.
Fig. 3How the power output of the micro hotplate reduces with increase in modulation frequency: a) frequencies between 5 and 100 Hz, b) frequency range of 500-4000 Hz
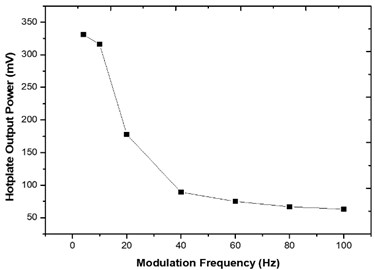
a)
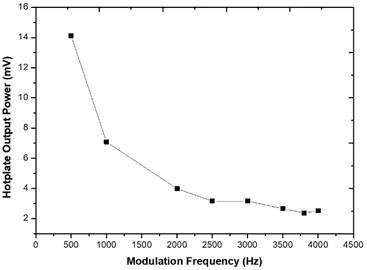
b)
These graphs show that higher modulation frequencies led to significant power loss from the micro hotplate. However, in a trade-off the higher frequencies offer lower 1/f noise and smaller sensor size. High frequency modulations are easily achieved with LEDS and lasers but not micro hotplates.
3. Design of the sensors
The PA cell was designed to have a 40 mm long acoustic resonator with 14 mm diameter. Dimensions of the two identical buffer volumes attached to both sides of the resonator are 20 mm and 48 mm for length and diameter respectively. Diameter of the resonator was determined based on the dispersion of the micro hotplate radiation, to ensure that all or most of the radiation passes through the resonator. The two identical buffer volumes diameters were derived from Eq. (8):
where is the buffer volume radius and is the resonator radius. The length of the buffer volumes are quarter wavelength of the resonance frequency so that they are used as acoustic filters against ambient noise coming into the cell. Fig. 4 shows the cell configuration.
Fig. 4The photoacoustic cell showing resonator, buffer volumes, microphone, gas inlet/outlet and radiation passage
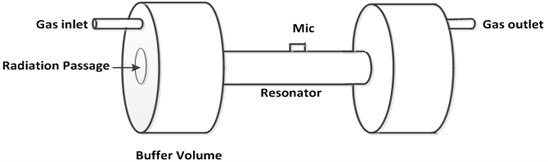
The microphone is placed on the middle of the resonator as shown; because it is the position of maximum acoustic signal (antinode). Openings were created on the buffer volumes for the infrared windows where the radiation will pass into and out of the cell.
Early stage of the sensor design was done by determining the target gas, buffer gas, radiation source and transducer type. The radiation source is low-cost and suitable for measurement in the designated gas concentration range. Due to the influence of 1/ noise on PA systems, lower frequencies were avoided. Characterisation of the microphone shows that frequencies below 1 kHz should not be used in such applications, see Fig. 2. The relationship between the resonance frequency and resonator length is given by:
where is the modulation frequency, is the number of longitudinal modes, is the speed of sound and is the resonator length. From the cell dimensions given above and the speed of sound in air (343 m/s), the fundamental longitudinal resonance frequency is 3543.14 Hz when the effective length of the resonator was used. The inner walls of the stainless-steel PA cell were coated with gold to reduce the effect of background signal caused by cell wall radiation absorption. Zinc selenide (ZnSe) windows with antireflective coatings were used. Fig. 5 is the resonance profile plotted from PA signal measurements made around the cell’s resonance frequency.
Fig. 5Resonance profile of the PA cell. It shows results of PA signal measurement when the modulation frequency was tuned between 2.92-3.22 kHz. The resonance profile was plotted from measurement data at about 42 % gas concentration and normal atmospheric conditions
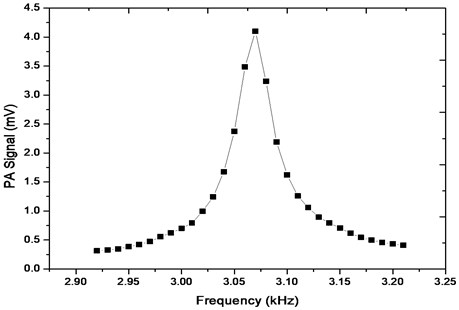
For high quality factor, is defined as:
where is the quality factor, is the resonance frequency and is the full width at half maximum described as the interval between the points where the amplitude is at the value of the peak amplitude. More design details can be found in previous works [4, 13].
4. Experimental set-up and measurement
An electronic circuit was designed and used to modulate the hotplate radiation as well as track the resonance frequency of the cell. Resonance tracking is needed because of the variation of resonance frequency with respect to gas composition/concentration and temperature changes. The radiation was directed into the cell which had CO2 (target gas) and N2 (buffer gas) flowing through it. Gas flow into the cell was controlled by the MKS Multi-Gas controller 647B. It had mass flow controllers connected to it and they were used to set CO2 and N2 flow rates in standard cubic centimetres per minute (SCCM) based on calculated proportions, thereby producing specified gas concentrations for PA signal measurements. Generated PA signal detected by the MEMS microphone is analysed using the HP 3561A Dynamic Signal Analyser. Connected to the signal analyser is the HP 7470A Plotter Emulator which captures the PA signal spectrum for display, printing or storage on the computer. Fig. 6 is the PA sensor used as part of the set-up for measurement.
Fig. 6The constructed PA cell with inlet/outlet pipes connected and microphone cable shielded against interference
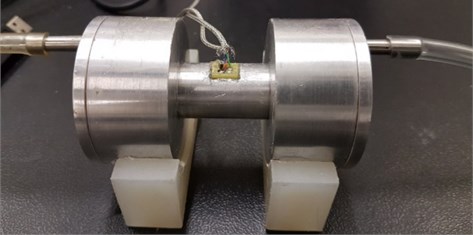
The cell was placed on two stands to reduce the effects of mechanical vibrations. Gas flow pipes connected to the inlet and outlet are also shown. Cables from the microphone were shielded with woven mesh of copper wires (braid shielding) to avoid interference on the PA signal. Measurements were carried out by allowing different gas concentrations to flow into the cell then PA signal were recorded for each concentration.
5. Results and discussions
Measurement results for gas concentrations starting from 100 % N2 to almost 90 % of CO2 in the cell was plotted and shown in Fig. 7. The measurements were carried out at room temperature.
Fig. 7Change in PA signal with respect to CO2 concentration increase at room temperature
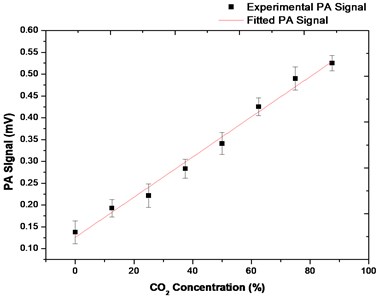
The graph shows that the PA signal is directly proportional to increase in the concentration of CO2 in the cell. This means that more gas molecules were excited at increased concentration for higher signal generation. The linear variation of PA signal with CO2 concentration has an value of 0.99. Sensitivity of the sensor at room temperature is 4.6 µV/%, calculated as the gradient of the graph. Uncertainty values were computed from three different results obtained for each concentration and they lie between 4.4-6.0 µV. Fig. 8 is a PA signal spectrum captured from the signal analyser.
Continuous PA signal measurement was done at four different CO2 concentrations for 15 minutes each. The four concentrations are 12.5 %, 37.5 %, 62.5 % and 87.5 % as shown in Fig. 9.
Fig. 8PA signal of the hotplate sensor measured at room temperature for a CO2 concentration of about 62.5 % in the cell
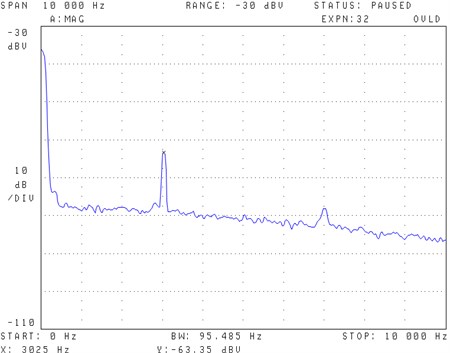
Fig. 9Plot of PA signal versus time at 12.5 %, 37.5 %, 62.5 % and 87.5 % concentrations of CO2 in the cell
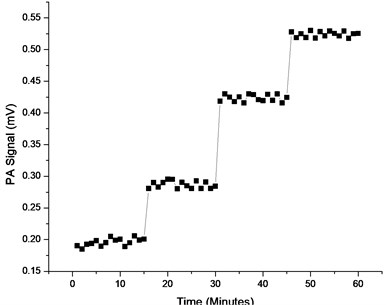
These results show good repeatability for each concentration and provide confirmation that the PA signal rises when the target gas concentration in the cell is increased. Uncertainty analysis of the micro hotplate sensor’s output data produced the results presented in Table 1 for each of the four CO2 concentrations.
Table 1Hotplate-based sensor’s average and uncertainty values for continuous measurement of PA signal at four different CO2 concentrations.
CO2 concentration (%) | Average PA signal (µV) | Uncertainty (µV) |
12.5 | 196.0 | 6.0 |
37.5 | 286.7 | 5.6 |
62.5 | 423.5 | 5.4 |
87.5 | 524.2 | 4.4 |
The largest difference between the uncertainty values across the four concentrations is only 1.6 µV. uncertainty calculations were done from three different measurements taken at each of the four CO2 Concentration.
Temperature analysis was performed on the hotplate sensor, as an essential requirement for resonant PA systems. Such examination provided important information on any challenges that could arise due to temperature variation, to find ways of overcoming them. The Weiss WKL 34 temperature and climate test chamber were used to experimentally measure the PA signal for increasing CO2 concentrations, within the temperature range of −20 °C to 50 °C at intervals of 10 °C. Resonance frequency tracking was applied in each measurement. Fig. 10 are graphs plotted for results of PA signal against CO2 Concentration for the different temperatures.
Fig. 10PA signal variation with CO2 concentration for different temperatures from −20 °C to 50 °C. These graphs show the effect that temperature has on PA signal – higher temperatures decrease PA signal output
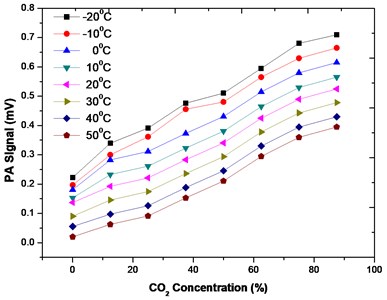
These graphs clearly illustrate the dependence of PA signal on temperature. At every fixed concentration of the gas and changing temperature, there is a corresponding change in PA signal. To further explain this effect, the PA results for CO2 at a concentration of 25 % in the cell was plotted as shown in Fig. 11.
Fig. 11How PA signal varies with change in temperature at 25 % CO2 concentration in the cell
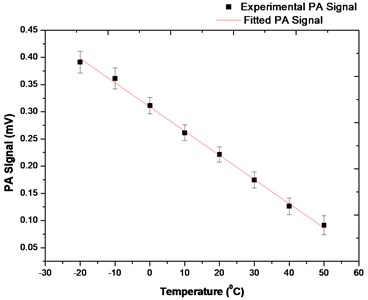
Calculations showed that there is approximately 77 % loss of PA signal from −20 °C to 50 °C and the rate of signal reduction is 4.4 µV/°C. For an interval of 10 °C, between 10 °C and 20 °C (room temperature at the time of measurement), there was about 15.3 % signal loss. Again, this agrees with the theory, that PA signal decreases with increasing temperature. Compensations for these temperature effects will be taken into account in future work. Detailed variation of PA signal with temperature can be found in earlier work [13].
6. Conclusions
The use of MEMS hotplate to develop PA CO2 sensor has been presented in this work and it reveals the suitability of these hotplates in PA gas sensing as well as the potential of such sensors. Huge availability due to ease of mass production and the low cost of components means that this type of sensors can be mass produced at cheaper cost. This work indicates that hotplates can be worthy alternatives to expensive light emitting diodes (LEDs) and lasers. MEMS hotplate’s emission of high intensity radiation in the infrared wavelength band makes it suitable for use in sensors that detect gases having characteristics absorption in the infrared region. A large sensor size would reduce the resonance frequency and hence modulation frequency. Experimental measurements showed that higher hotplate radiation power is achieved when modulation frequency is low. Results from the sensor show that PA signal varies linearly with CO2 concentration, with very low uncertainties of a few µV expressed as a percentage.
References
-
Lee T. J., Lee O., Kim J., Shterengas L. CO2 sensor with data logger system. Systems, Applications and Technology Conference, Long Island, 2012.
-
Gibson D., MacGregor C. A novel solid state non-dispersive infrared CO2 gas sensor compatible with wireless and portable deployment. Sensors, Vol. 13, Issue 6, 2013, p. 7079-7103.
-
Oblov K. Yu., Ivanova A. V., Soloviev S. A., Zhdanov S. V., Voronov Yu. A., Florentsev V. V. Carbon dioxide gas sensor based on optical control of colour in liquid indicator. IOP Conference Series: Materials Science and Engineering, Vol. 151, 2016, p. 012031.
-
Ishaku L. A., Hutson D. A resonant photoacoustic CO2 sensor based on mid-ir LED and MEMS microphone technology operating at 4.3 µm. Innovative Systems Design and Engineering (ISDE), Vol. 7, Issue 8, 2016.
-
Khanna V. K., Prasad K., Dwivedi D. K., Shekhar C., Pankaj A. C., Basu J. Design and electro-thermal simulation of polysilicon micro heater on a suspended membrane for use in gas sensing. Indian Journal of Pure and Applied Physics, Vol. 45, Issue 4, 2007, p. 332-335.
-
Maeng S., Kim S. W., Lee D. H., Moon S. E., Kim K. C., Maiti A. SnO2 nanoslab as NO2 sensor: identification of the NO2 sensing mechanism on a SnO2 surface. ACS Applied Materials and Interfaces, Vol. 6, 2014, p. 357-363.
-
Udrea F., Ali S. Z., Brezeanu M., Dumitru V., Buiu O., Poenaru I., et al. SOI sensing technologies for harsh environment. International Semiconductor Conference (CAS), Sinaia, Romania, 2012.
-
Barritault P., Brun M., Gidon S., Nicoletti S. Mid-IR source based on a free-standing microhotplate for autonomous CO2 sensing in indoor applications. Sensors and Actuators A, Vol. 172, Issue 2, 2011, p. 379-385.
-
De Luca A., Cole M. T., Fasoli A., Ali S. Z., Udrea F., Milne W. I. Enhanced infra-red emission from sub-millimeter microelectromechanical systems micro hotplates via inkjet deposited carbon nanoparticles and fullerenes. Journal of Applied Physics, Vol. 113, Issue 21, 2013, p. 214907.
-
Xu L., Li T., Gao X., Wang Y. Development of a reliable micro-hotplate with low power consumption. IEEE Sensors Journal, 2011, Vol. 11, 4, p. 913-919.
-
Bell A. G. On the production and reproduction of sound by light. American Journal of Science, Vol. 20, 1880, p. 305-324.
-
Li J., Chen W., Yu B. Recent progress on infrared photoacoustic spectroscopy techniques. Applied Spectroscopy Reviews, Vol. 46, 2011, p. 440-471.
-
Ishaku L. A., Hutson D., Gibson D. Temperature effects on photoacoustic carbon dioxide sensor developed using Mid-IR LED. IEEE International Instrumentation and Measurement Technology Conference, Houston, USA, 2018.
-
Baumann B., Kost B., Wolff M., Groninga H. Modelling and numerical investigation of photoacoustic resonators. Modelling and Simulation, InTech Education Publishing, 2008.
About this article

