Abstract
At present, increasing emphasis is being placed on low noise levels, especially in the automotive industry. One of the dominant sources of noise (and vibration) in vehicles (with an electric motor as well as an internal combustion engine) is the transmission system. In order to effectively reduce vibration and noise of gears and transmission systems, some important gear parameters should be determined / measured. One of these parameters is the static transmission error, which is addressed in this article. The evaluated parameter is the peak-to-peak value of the transmission error, which appears to be closely related to NVH (Noise Vibration and Harshness). The transmission error depends, inter alia, on the tooth macrogeometry (expressed by the contact ratio) and the tooth microgeometry (intentional tooth modifications), the influence of both has been analyzed and is presented in this article. The transmission error can be determined by virtual measurement (computationally) in software enabling finite element analysis or by technical experiments on a test rig. The results in this paper are based on the outputs of numerical simulations using the finite element method. This approach can be used at developing phase to find the optimal solution and to save a lot of time. In addition, no physical components are required and a wide range of arbitrary gear configurations can be analyzed. Nevertheless, the technical experiment is still necessary, thus the test rig will be designed/constructed in the near future, including the possibility of lubrication. The results will then be compared with numerical simulations.
1. Introduction
The way of transmitting mechanical energy by means of gears is very common in every industry, not excluding the automotive one. Helical gears (Fig. 1) are most often used in vehicle gearboxes. As new automobiles are expected to run still quieter, their transmission systems must also meet this. Gears are therefore required not only to have a high load capacity, fatigue and service life, but also to run as smoothly as possible without vibrations. The design process of gears thus becomes even more complicated, so the possibility of using numerical simulations is offered [1]. If the gear pair/gearbox has already been manufactured and has a higher noise level, it is advisable to proceed with a technical experiment to find out the reason, or just to determine the transmission error (TE) [2].
Vibrations and noise in the transmission systems occurs primarily from the engagement of the gears. The vibrations propagate from the gears through a flexible structure – bearings and shafts – further into the system and are radiated in the form of noise on thin-walled panels (gearcase, engine block, bodywork). In order to reduce the radiated noise, it is therefore necessary to deal with the gear mesh and its optimization. It turns out that the relation between vibration / noise and gear mesh can be relatively well expressed by the parameter called transmission error [3, 4].
Several authors have addressed the determination of the transmission error using numerical simulations of different levels of complexity in the (recent) past. Spur gears have been addressed in publications [1, 5-9]. Bartošová et al., in their paper [5] and her diploma thesis [1], analyzed the static TE. The influence of loading torque, working center distance, gear teeth modification (tip relief) and others was evaluated. Yin [6] also examined the effect of working center distance in the case of spur gears. Yılmaz et al. [7] dealt with the static TE, mesh stiffness and dynamic factor at bimetallic spur gears. Their work was also focused on reducing the weight of the gears without deteriorating other parameters. The TE issue can be approached in other ways than using only the finite element method (FEM), namely, using a multibody model – Cirelli et al. [8]. In their work, both static and dynamic conditions were simulated and the influence of dimensions of the tip relief modification at different torques on the static and dynamic TE was evaluated. They also compared the results with experimental values from the literature. Shweiki et al., in their article [9], dealt with a hybrid FE-Analytical approach implemented in multibody software. The static TE for different torques and the deformation for different values of the friction coefficient were evaluated. In addition, one of the gears had a micro-modification of the teeth (crowning). They compared the results with an experiment using a test rig which had a power circulation arrangement.
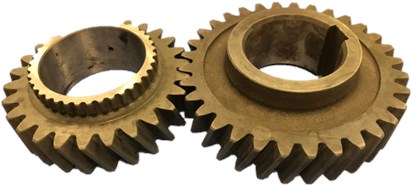
Fig. 1Helical gear pair
In addition to this article, numerical simulations of helical gears were also dealt with in [10-13]. Khosroshah et al. [10] performed stress-strain contact analysis based on the FEM and evaluated contact stress and bending tooth root stress at various torques. One of the conclusions was a linear relation between bending stress and torque, and a quadratic relation between contact stress and torque. An approach of Patil et al. [11] was similar, analyzing several gear configurations and evaluating the effect of the friction coefficient on stresses. He compared the results with analytical calculations and stated a good agreement / correlation. Bruzzone et al. proposed a semi-analytical model for the determination of the static TE and displacement of any gear geometry (including micro-modification). The results were compared with the FEM as well. Barbieri et al. [12] analyzed, among other things, the effect of micro-modifications on the static TE for external and internal helical gears. In their study [13], Wang et al. evaluated the effect of linear tip relief and lead crowning modification on the static and dynamic TE, contact stress and vibration energy. They also determined the dimensions of modifications in which the evaluated parameters decreased significantly.
Bevel gears are addressed in the studies [14-16]. Fraňová [14] dealt with spiral bevel gears. In particular, the effect of modifications (long / short tip relief) on the static TE at different load was determined. The same type of gears was analyzed by Vivet et al. [15]. They evaluated the static TE, contact pressure and contact pattern for different loads by two different approaches – analytical in combination with multibody versus FEM. Both methods yielded very similar results. In addition, Zhuo et al. [16] dealt with hypoid gears.
2. Theoretical knowledge
2.1. Transmission error
If all components of the transmission system were perfectly rigid and manufactured / assembled according to the theoretical dimensions, there would be no transmission error. However, deformation / bending of teeth, shafts, etc. occurs under load. Due to manufacturing inaccuracies, the tooth profile is not perfectly involute, so the engagement is not conjugate [4].
The transmission error (TE) is defined as the difference between the theoretical and actual angular position of the driven gear – Fig. 2, Eq. (1). Teeth do not engage along the pressure line, so the engagement is not conjugate, therefore at a constant angular velocity of the driving gear, the angular velocity of the driven gear is not constant but changes periodically. Thus, periodic angular acceleration is also present, which causes torsional vibrations of the gears [4].
Fig. 2Schematic representation of the TE
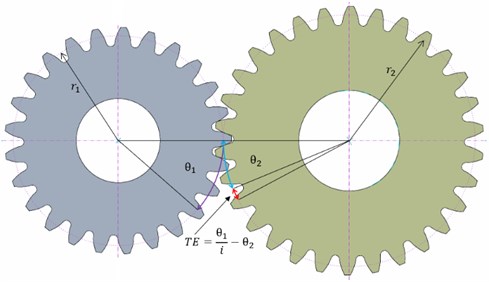
The TE can be expressed by angular or length units. The output of the measurements is usually an angular displacement, but for better clarity and comparability, it tends to be converted into the linear displacement (in microns) on the pitch or base circle – Eq. (2). Mathematically, it can be expressed as follows [4]:
where the expression is the theoretical angular displacement of the driven gear and is transmission ratio.
The transmission error can be divided, based on the measurement conditions, into three types [17]:
– geometric / manufacturing TE,
– static TE (STE),
– dynamic TE (DTE).
The geometric TE is measured at low speed and low load. Under these conditions, deviations from the theoretical geometry will reflect. The static TE, which is also addressed in this article, is also measured at low speeds, but at operating loads. Finally, the dynamic error is determined at both operating speed and load. The dynamic TE is the most complex and takes into account the real conditions, but its measurement is relatively difficult [17]. Therefore, the static TE, which is included in the dynamic TE [18], is often initially determined, and its low value could be a good assumption for a low TE even under dynamic effects.
It has turned out that vibrations and possible subsequent noise are influenced by the oscillating part of the transmission error (the TE is periodic with a period of the tooth pitch), therefore the peak-to-peak value of the TE is primarily evaluated [4]. In the case of an eccentricity or pitch error, the transmission error is modulated onto the total transmission error (Fig. 3), which is periodic with a period of one gear revolution. In most cases, however, the TE at the tooth pitch is evaluated, since most of the noise from the gearing is occurred at the mesh / tooth frequency [19]. When evaluating the measurement, it is therefore necessary to mathematically separate the transmission error from the total transmission error [3].
Fig. 3Components of the total TE [19]
![Components of the total TE [19]](https://static-01.extrica.com/articles/21825/21825-img3.jpg)
2.2. Gear teeth modifications
Gear teeth modifications are based on the removal of material from the theoretical shape of the teeth. They can be divided into two categories – as shown in Fig. 4. Transverse profile modifications are mainly used to compensate for tooth deformation, flank line modifications to compensate for shaft deformation [20]. The aim is, among other things, to reduce the peak-to-peak value of the mesh stiffness and thus also the transmission error [3].
Fig. 4Two main categories of gear teeth modifications [21]
![Two main categories of gear teeth modifications [21]](https://static-01.extrica.com/articles/21825/21825-img4.jpg)
The most common transverse profile modifications include linear tip / root relief, or a combination of both on one gear, the other gear being left unmodified. It is a smooth relief of the involute. Since it is a linear modification, the modified profile is also involute, but with a different base circle and origin [4, 20].
Modifications can also include tip corner rounding / chamfering. However, they are made for a different reason than the above-mentioned modifications. In addition, they shorten the active / working length of the involute profile [20].
The dimensions of the modification are given in terms of roll distance – Fig. 5. The modification amount can be calculated as follows [20]:
where is maximum allowed peripheral force (from a strength or any point of view), is gear width, is specific mesh stiffness and is transverse pressure angle.
The same result as for Eq. (3) can be obtained by determining the mean value of the transmission error (numerical simulations, technical experiment) for the rotation of the gears corresponding to the path of contact of one tooth pair.
The modification length (extent) can be expressed by the following relation [22]:
where is base pitch and is peripheral force corresponding to the design load (in terms of low noise / TE).
It is clear from Eq. (3-4) that if the design load is equal to the maximum load, the modification length is equal to the numerator from Eq. (4). Such a modification is called long tip relief. For zero (or a very small) design load, the modification length is half – short tip relief. In this case, the teeth do not deform, but other deformations and inaccuracies must be compensated [22].
Fig. 5Linear tip relief [22]
![Linear tip relief [22]](https://static-01.extrica.com/articles/21825/21825-img5.jpg)
3. Methods
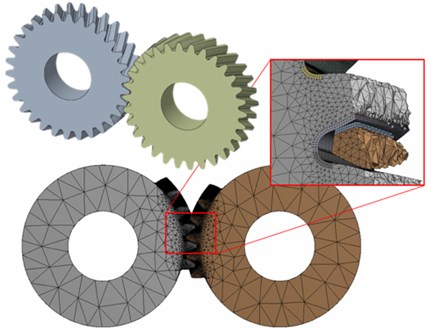
In this paper, numerical simulations based on the finite element method were used to determine the static transmission error. The input for the numerical simulations was a parametric 3D CAD geometry of a helical gear pair created in PTC Creo program. The basic parameters of the default gear pair configuration are given in Table 1 and the 3D model is shown in Fig. 6.
Table 1Parameters of the default gear pair
Parameter | Unit | Value |
Number of teeth | – | 30 |
Transmission ratio | – | 1 |
Normal module | mm | 3 |
Normal pressure angle | ° | 20 |
Helix angle | ° | 20 |
Gear width | mm | 24 |
Theoretical center distance | mm | 95.776 |
Working center distance | mm | 96.026 |
The numerical simulations themselves were performed in Ansys Workbench software. They were set as stress-strain quasi-static contact analyses. The gear material was steel, similar to the study in [1], with Young's modulus of elasticity of 200 GPa and a Poisson’s ratio of 0.3. For the purpose of this type of analysis and the determination of the static TE, other material properties were not necessary. The geometry was discretized into elements – finite-element mesh (Fig. 6). The teeth were not modeled around the entire circle, but only in the necessary area where the engagement took place. This was due to a reduction in the number of mesh elements and nodes and consequently the computational time. The finest mesh was in important areas (tooth flanks and roots) in terms of stress, contact pressure and deformation. The aim was also to create the mesh as evenly as possible and always in almost the same way in order to better comparability of the results. Several sensitivity analyses of the size of the mesh elements and the number of modeled teeth around the circumference were performed. The resulting size of the elements in important areas (0.25 mm) was chosen with respect to the relative accuracy of the results, the computation time and the size of the result files.
Next, the contact faces on the tooth flanks of the individual tooth pairs and the boundary conditions were set. The gears were adjusted relative to each other so that the middle tooth pair was just at the beginning of the engagement (contact of the tooth tip of the driven gear and the tooth flank of the driving one). Both gears were only allowed to rotate around their axis. Rotation with a certain step was prescribed to the driving gear so that the middle tooth pair went through its entire engagement. The driven gear could rotate freely (depending on the driving one) and a loading (braking) moment (torque) was applied to it, which gradually preloaded the teeth before starting the rotation, and its value was constant during the rotation. Friction coefficient between the tooth flanks was set to the value of 0.1.
After the stress-strain analysis was performed, the resulting angular displacements (from each step) were substituted into Eq. (2) to obtain the static transmission error as a function of the driving gear rotation.
Fig. 63D model and finite-element mesh
4. Results and discussion
4.1. Stress-strain analysis
Besides the transmission error, which is calculated based on the outputs of the stress-strain analysis, the primary results of the analyses themselves can also be evaluated. Specifically, it was the equivalent von Mises stress and contact pressure at certain moments of the gear rotation.
Numerical simulations in this subchapter were performed on the gears with parameters from Table 1 and the loading torque of 100 N∙m was applied. Since the plastic properties of the material were not considered in the performed simulations, after exceeding the yield strength, the material continued to behave elastically (linearly). However, this is not very significant in the qualitative comparison of the following analyses / modifications.
In Fig. 7(a), the tooth tip edge of the driven gear, which is subjected to the braking torque, presses on the tooth flank of the engaging driving gear. Since the entry into the engagement does not take place across the entire width of the tooth at the same time, but gradually, this edge is very short (theoretically a point). The result is a high stress concentration, which theoretically reaches 822 MPa. However, this value is not realistic, as in fact point / edge contact cannot occur. It is always a very small / narrow area. These values are affected by the fineness and topology of the mesh as well.
By applying a rounding to the tooth tip (Fig. 7(b)), the maximum stress (454 MPa) is reduced by almost half and occurs in a smaller area. However, the path of contact is shortened (Fig. 8), as the working part of the involute is shorter due to the rounding.
Long tip relief (without rounding) shown in Fig. 7(c) caused no contact between the teeth (without loading) at the theoretical beginning of the engagement. Due to the torque, deformation occurs and the gap between the teeth is just closed. The resulting stress at the tooth tip is thus only minimal. The path of contact is also shorter, which can be seen in Fig 8.
Fig. 7Teeth pretension: a) unmodified, b) tip corner rounding – R0.2 mm, c) long tip relief
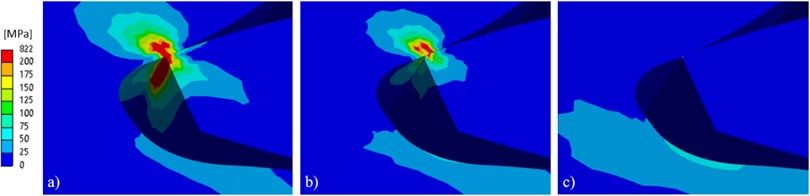
Fig. 8Maximum contact pressure as a function of the driving gear rotation
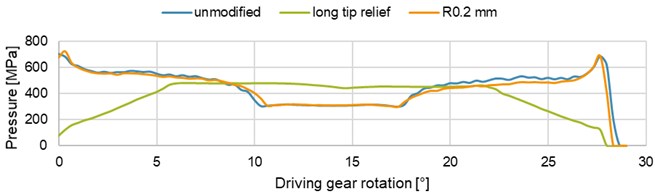
The maximum contact pressure (of the middle tooth pair, for variants from Fig. 7) as a function of driving gear rotation is shown in Fig. 8. Unmodified gears and gears with the tip corner rounding do not differ too much from this aspect. The same peak values of pressure occur when entering / exiting the engagement. The almost constant maximum pressure is observed while the teeth touch along their entire width. However, the design with the tip corner rounding is a bit more favorable.
The effect of long tip relief modification on contact pressure is more significant. There is no peak pressure, on the contrary, the entry into engagement is gradual, the increase of pressure is approximately linear and no edge contact occurs. The pressure is being increased until the modified involute in the front transverse plane disengages. Thus, the unmodified involutes are already being touched. From this moment on, the pressure remains approximately constant. When exiting the mesh, the situation is analogous.
Fig. 9Root stress: a) unmodified, b) long tip relief; contact pressure: c) unmodified, d) long tip relief
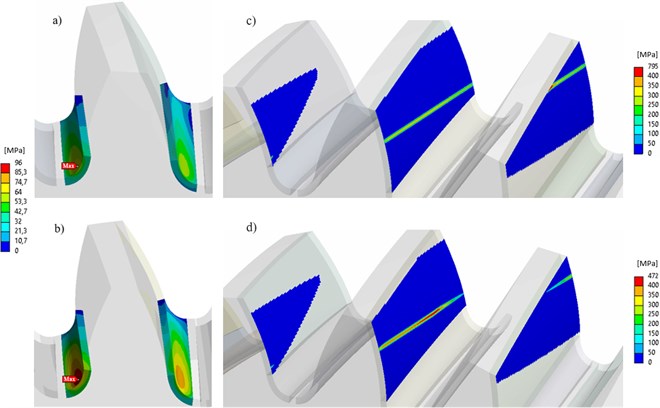
Fig. 9 shows a situation where the stress in the tooth roots is maximum for the middle tooth (of driving gear) without modification (Fig. 9(a)) and with modification long tip relief (Fig. 9(b)) and contact lines and pressure on the teeth in engagement at the corresponding moments (Fig. 9(c) and Fig. 9(d)). The maximum stress occurs in those roots where compressive stress is dominant, similar to the study in [10]. Using the modification, the stress increased from 70 MPa to 96 MPa. The reason is the different distribution of contact pressure between tooth pairs and along individual tooth pairs. It is clear from Fig. 9(d) that the middle tooth pair carries a larger load. Since between the pairs that are at the beginning, resp. at the end of the engagement, there is only partial contact in the areas of modification. The maximum pressure occurs at the edge of the tooth tip in the case of no modification, in the case of modification at the point where the modified involute meets the original one.
4.2. Static TE
The peak-to-peak values of the static TE (PTPTE) for different configurations (micro / macro geometry, boundary conditions – torque, etc.) of the finite-element model will be evaluated and compared. Unless otherwise stated, the loading torque had value of 100 N∙m. In some cases, graphs of the TE are shifted along the y-axis, as the average value of the TE has been shown to depend on the initial penetration of the contacts, which is necessary for the solver. However, the important and evaluated value is the PTPTE.
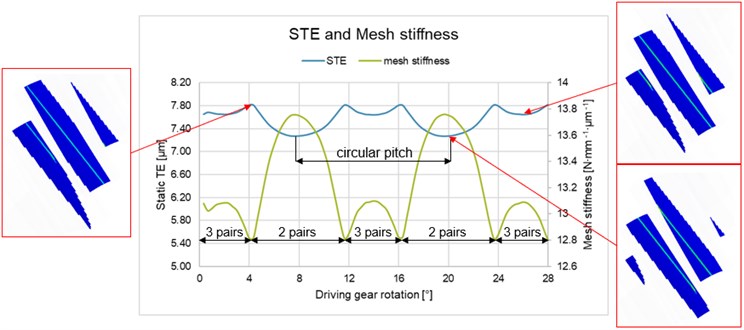
Fig. 10 shows dependence between the static TE as well as mesh stiffness (of unmodified gear from Table 1) and the driving gear rotation. Both are periodic with a period of the circular pitch – in this case 12°. The values at zero rotation (teeth pretension) are not shown, as they deviated more significantly from the expected course. Side pictures show contact lines for chosen angular displacements. Two and three pairs of teeth alternated in the gear mesh. The minimum TE occurred with two pairs in the engagement, the maximum when the number of teeth in the engagement was about to change. With three pairs in the mesh, despite the load distribution between a larger number of tooth pairs, a higher value of the TE occurred. The reason is that two marginal pairs of teeth were in contact only along short lines, where the combined stiffness of the teeth is lower. It is also clear from the graph that the static TE is inversely proportional to the mesh stiffness.
Fig. 10Static TE, mesh stiffness and contact lines
In the case of spur gears, in contrast to helical ones, one and two pairs of teeth alternate in the gear mesh. The minimum transmission error occurs with a two-pair mesh, the maximum with a single-pair mesh. The number of tooth pairs alternates in the mesh suddenly. The parameters of spur gearing were identical with the parameters of helical gearing in the transverse plane. The PTPTE value is almost 6 times higher for spur gears (3.20 μm) than for helical ones (0.54 μm). The path of contact of one pair of spur teeth is considerably shorter because there are no helix overlaps. Both types are compared in Fig. 11.
Fig. 11Graphs of the static TE of spur and helical gears
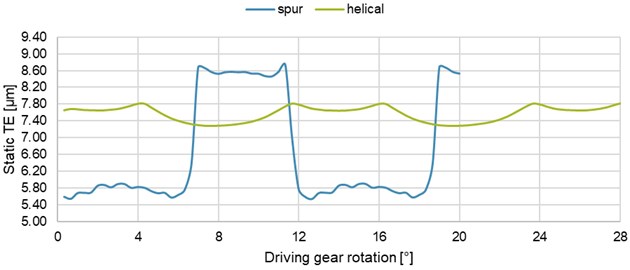
Fig. 12 shows the static TE for different loading torques, which are always applied to the same gear pair. Thus, the initial penetration was the same for all loads and mean values of the TE could be compared with each other. It is clear from the graph that with increasing load the average TE increases and the PTPTE value as well – Table 2. Dependence between the average TE as well as PTPTE and the load is in the range (10 to 150) N∙m almost linear – Fig. 13. For a small load (10 N∙m), the TE reaches negative values too. In this case, the negative value means that the driven gear is ahead (in the direction of its rotation) of its theoretical position. For a torque of 500 N∙m, the TE is even higher but the dependence is no longer linear. With the increasing load, the path of contact lengthens due to the greater teeth bending as well.
Fig. 12Effect of the loading torque on the static TE
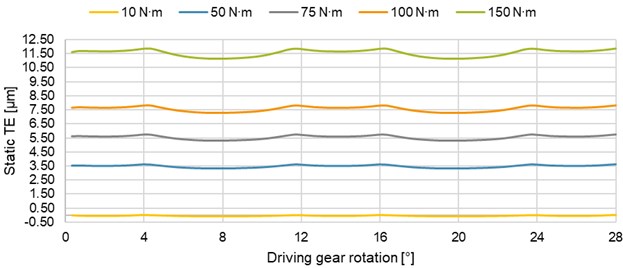
Fig. 13Mean static TE and PTPTE as a function of torque
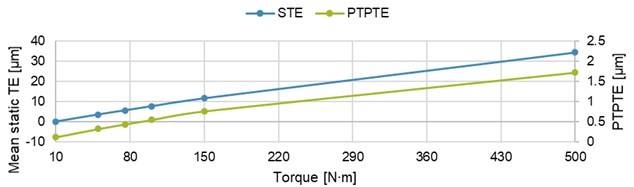
Table 2Values of the TE for different loading torques
Torque [N∙m] | 10 | 50 | 75 | 100 | 150 | 500 |
Mean static TE [μm] | –0.04 | 3.48 | 5.54 | 7.57 | 11.55 | 34.45 |
PTPTE [μm] | 0.12 | 0.32 | 0.44 | 0.54 | 0.76 | 1.72 |
The effect of transverse profile modifications on the transmission error is shown in Fig. 14. Specifically, they are tip relief, root relief and a combination of both on the driving gear, while the driven one was left unmodified – the results are very similar. The dimensions of the modifications were calculated using Eqs. (3-4). The design and maximum loads were considered identical – long modifications. The significant effect of these modifications on PTPTE values is obvious – a severalfold decrease. The two-pair area of the engagement has expanded slightly at the expense of the three-pair area. The effect of too long tip relief with the beginning of modification on the pitch diameter was also analyzed. In this case, the improvement was less significant, so long modifications seem more appropriate.
Modifications also include tip corner rounding. For a larger radius of curvature, the PTPTE value is slightly higher – Table 3. The reason is probably the shorter active profile of the teeth. However, rounding / chamfering is always necessary, despite the higher TE. Furthermore, it can be observed that the maximum values of the TE are, in contrast to the configuration without rounding, slightly shifted to the areas of three-pair engagements. The application of rounding (R0.2 mm) to the modified gearing (tip relief) did not lead to significant changes.
Fig. 14Effect of Transverse profile modifications on the static TE
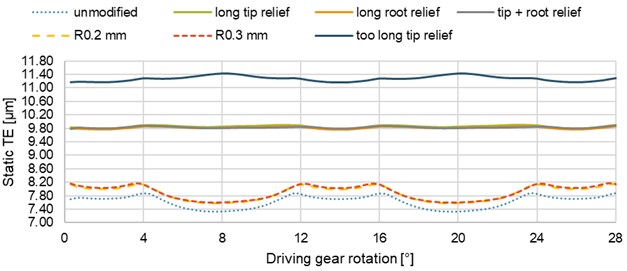
Table 3PTPTE values for different gear teeth modifications
Type of modification | None | Tip relief | Root relief | Tip + root relief | Too long tip relief | R0.2 mm | R0.3 mm | Tip relief + rounding |
PTPTE [μm] | 0.54 | 0.12 | 0.11 | 0.10 | 0.26 | 0.57 | 0.59 | 0.11 |
Next, two other design loads of 75 N∙m and 50 N∙m and their corresponding dimensions of tip relief modification were analyzed. The applied load and the maximum permissible load varied. In both cases, the equality of design, maximum and applied load proved to be the most favorable – long tip relief. The PTPTE values were comparable to the case where the applied load reached 100 N∙m as well as the design and maximum load.
Subsequently, the maximum loads were set to the value of 100 N∙m. In one case the applied load was equal to the design load and in the other case to the maximum one – in both cases it is the so-called intermediate tip relief. It has turned out that the smaller difference between the design and maximum load, the more favorable effect of the modification. The most favorable effect is for the design load. However, for the maximum load, the PTPTE is smaller than for the unmodified gear (at the same load). Furthermore, the gear pair was designed for a torque of 75 N∙m and loaded with a torque of 10 N∙m. In this case, it has turned out that the modification made the situation worse and the PTPTE value was higher than for the configuration without modification. All mentioned combinations are given in Table 4.
Overlap ratio is another parameter which has significant influence on the peak-to-peak values of the TE and mesh stiffness. The overlap ratio can be changed primarily in two ways – by changing the helix angle or the tooth width. In addition, the first option changes the overall dimensions of the gear, including the shape of teeth and the transverse contact ratio. Fig. 15 shows a graph of the TE for different values of the overlap ratio, with a constant tooth width (24 mm) and different helix angles. The specific values are given in Table 5. The PTPTE reaches the lowest value of the analyzed designs, according to theoretical assumptions, just for the overlap ratio being equal to one (or to an integer in general). The variable TE still occurs despite the constant total length of the contact lines, as the variable stiffness of the teeth along their height and the combined stiffness of the teeth are still present. However, using the long tip relief modification on this gear (with overlap ratio being equal to one) did not bring as much percentage improvement as the default configuration with the same modification. By further increasing the overlap ratio above one (1.25), the PTPTE increases again. However, the increase is less significant than by decreasing from one down (0.75).
Table 4PTPTE values for various tip relief modifications and loads
Unmodified | 75 N∙m | 50 N∙m | |||||||||
[N∙m] | 100 | 75 | 50 | 10 | 100 | 75 | 75 | 10 | 100 | 50 | 50 |
[N∙m] | – | – | – | – | 100 | 100 | 75 | 75 | 100 | 100 | 50 |
PTPTE [μm] | 0.54 | 0.44 | 0.32 | 0.12 | 0.22 | 0.18 | 0.10 | 0.22 | 0.40 | 0.28 | 0.10 |
Fig. 15Effect of the overlap ratio on the static TE
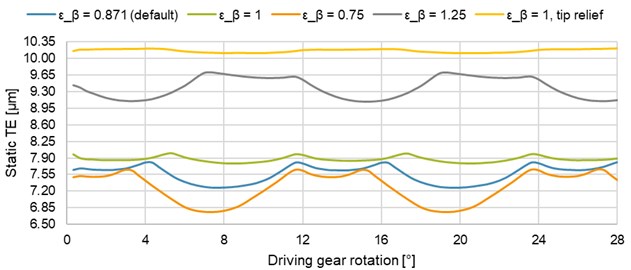
Table 5PTPTE values for different overlap ratio values
Overlap ratio [–] | 0.871 (default) | 1 | 0.75 | 1.25 | 1, tip relief |
Helix angle [°] | 20 | 23.123 | 17.129 | 29.398 | 23.123 |
PTPTE [μm] | 0.54 | 0.24 | 0.91 | 0.62 | 0.09 |
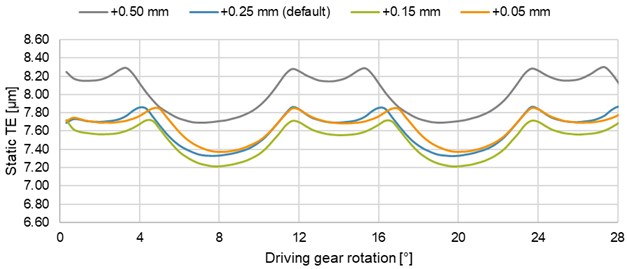
One of the advantages of involute gears is that the transmission ratio is not depended on the working center distance. This is particularly suitable in terms of mounting dimensions, assembly/manufacturing inaccuracies and backlash. However, it has turned out that changing of the working center distance also affects the transmission error – Fig. 16. Decreasing the center distance closer to the theoretical value resulted in decreasing the PTPTE value – Table 6. The cause is probably in the transverse contact ratio, which decreases with the increasing working center distance.
In Fig. 16, it is also possible to observe an extension of the three-pair engagement with decreasing center distance. The third pair of teeth always enters the engagement at the same moments but remains engaged for different time, depending on the working center distance, resp. transverse contact ratio.
Table 6PTPTE values for various working center distances
Center distance increment (to the theoretical value) [mm] | +0.50 | +0.25 | +0.15 | +0.05 |
PTPTE [μm] | 0.61 | 0.54 | 0.50 | 0.48 |
In terms of reducing the transmission error and NVH, special gear designs for low or very low noise can be used. Both types of gears have a smaller normal pressure angle, which is calculated from the transverse pressure angle of 18.5° for low noise, resp. 17.5° for very low noise, and from the helix angle [23]. In addition, the gears for very low noise has longer teeth compared to the standard ones, expressed by the following equations [23]:
where is addendum height, is dedendum height and is normal module.
Fig. 16Effect of the change in working center distance on the static TE
Results are shown in Fig. 17 and Table 7, the values in italic correspond to configurations with the long tip relief modification. The low noise configuration shows only a slightly lower PTPTE value than the default one. A more significant decrease in the PTPTE was observed in the very low noise configuration. An almost constant TE corresponds to the three-pair engagement. The maximum occurred by entering/exiting of the third pair of teeth into/out of the engagement. In both cases, the longer path of contact was caused by a smaller pressure angle, and thus by a larger transverse contact ratio.
Fig. 17Effect of special gears for (very) low noise on the static TE
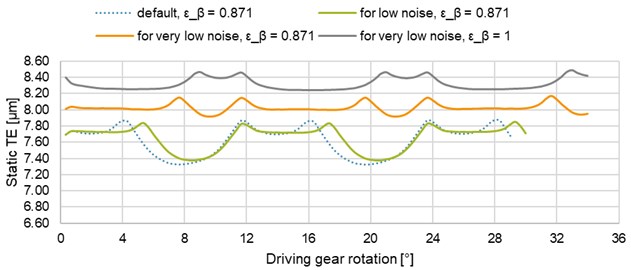
Table 7PTPTE values of special gears
Configuration | Default | For low noise | For very low noise | ||||
PTPTE [μm] | 0.54 | 0.12 | 0.46 | 0.24 | 0.10 | 0.22 | 0.07 |
Overlap ratio [–] | 0.871 | 1 | |||||
In addition, the very low noise configuration was analyzed with the overlap ratio being equal to one (the same width, larger helix angle). In this case, the PTPTE decreased only very slightly. By adding the modification, the more significant decrease was achieved.
Analogously, the same types of gears were subjected to simulations, but for the helix angle of 15° and 30° – Table 8. For the 15° angle, the relative decreases in PTPTE values compared to the default configuration are similar to those for 20°. However, increasing the helix angle to 30° does not significantly reduce the PTPTE of gears for low noise and very low noise.
Table 8Another PTPTE values of special gears
Configuration | Default | For low noise | For very low noise | |||
PTPTE [μm] | 1.23 | 0.67 | 1.08 | 0.63 | 0.45 | 0.64 |
Helix angle [°] | 15 | 30 | 15 | 30 | 15 | 30 |
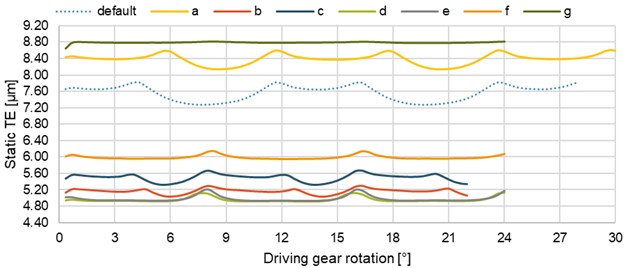
Finally, the influence of different gear parameters on the static TE was analyzed – Table 9 and Fig. 18. Configurations (a-g) had longer teeth as well – Eqs. (5-6). Longer teeth resulted in an increase in the transverse contact ratio and a decrease in the PTPTE. The increase in the number of teeth (b) caused an increase in the transverse contact ratio too. With an appropriate increase in the working center distance, this ratio decreased to the value as in (a). By comparing (a) and (c), a decrease in the PTPTE with the increase in the number of teeth can be observed.
In order to achieve the transverse contact ratio being equal to two (or more), the normal pressure angle was decreased (d-g). The integer value of the transverse contact ratio caused a further decrease in the PTPTE (d). By decreasing the working center distance, the ratio was increased above two, but the PTPTE increased (e). Thus, the working center distance has only an indirect effect on the TE through a change in the transverse contact ratio.
The configuration with integer transverse contact ratio and overlap ratio (f) proved to be the best variant. in combination with the long tip relief modification, the PTPTE dropped to a very low value (g). The static transmission error is therefore almost constant in this case.
Table 9PTPTE values and parameters of different gear configurations
Configuration | Default | a | b | c | d | e | f | g |
PTPTE [μm] | 0.54 | 0.47 | 0.27 | 0.34 | 0.23 | 0.28 | 0.18 | 0.035 |
Number of teeth | 30 | 44 | ||||||
Transmission ratio [–] | 1 | |||||||
Normal pressure angle [°] | 20 | 14.5 | ||||||
Transverse contact ratio [–] | 1.446 | 1.579 | 1.652 | 1.579 | 2 | 2.061 | 2 | |
Center distance increment (to the theoretical value) [mm] | +0.25 | +0.50 | +0.19 | +0.035 | ||||
Overlap ratio [–] | 0.871 | 1 | ||||||
Helix angle [°] | 20 | 23.1 | ||||||
Modification | – | Long tip relief | ||||||
Fig. 18Effect of various gear parameters on the static TE
5. Conclusions
In this paper, the computational approach by using the finite element method was used to determine the static transmission error. a relatively large number of configurations was analyzed in order to determine and verify the influence of various factors on the transmission error. Emphasis was placed on the successive change of gear parameters, micro-modifications and boundary conditions so that it was possible to assess the individual effects independently and as clearly as possible. It has been shown that a relatively low PTPTE value can be achieved already in the design of gear macro-geometry by a suitable combination of gear input parameters. However, this is not always possible with regard to other gear properties (strength, etc.). in this case, it is possible to apply gear modifications that have been able to reduce the PTPTE very effectively, especially for the loads which they have been designed for. In addition, the combination of suitable macro and microgeometry can theoretically achieve almost zero TE. in practice, however, this does not have to be that case, as other factors will also come into consideration (manufacturing (in)accuracy, lubrication, etc.). For this reason, a test rig will be designed and constructed in the near future. the rig will be placed in an anechoic chamber so that NVH parameters can also be evaluated, which are directly connected to the TE. The effect of the lubrication will be included too. the resulting database of the transmission error will be compared with numerical simulations, which will be supplemented by shafts. 3D geometry will be extended with flank line modifications and profile shift.
References
-
Bartošová D. Transmission Error in Spur Gears. Brno, 2018, (in Czech).
-
Kučera P., Píštěk V., Prokop A., Řehák K. Transmission error analysis for heavy-duty gearbox. Vibroengineering Procedia, Vol. 18, 2018, p. 113-116.
-
Palermo A., Britte L., Janssens K., Mundo D., Desmet W. the measurement of gear transmission error as an NVH indicator: theoretical discussion and industrial application via low-cost digital encoders to an all-electric vehicle gearbox. Mechanical Systems and Signal Processing, Vol. 110, 2018, p. 368-389.
-
Smith J. D. Gear Noise and Vibration. Second Edition, Marcel Dekker Inc., New York, 2003.
-
Bartošová D., Otipka V., Řehák K. Determination of transmission error in spur gear by numerical approach. Vibroengineering Procedia, Vol. 19, 2018, p. 284-288.
-
Yin J. Analysis of gear static transmission error and mesh stiffness. Applied Mechanics and Materials, Vols. 365-366, 2013, p. 327-330.
-
Yılmaz T. G., Doğan O., Karpat F. A comparative numerical study of forged bi-metal gears: bending strength and dynamic response. Mechanism and Machine Theory, Vol. 141, 2019, p. 117-135.
-
Cirelli M., Giannini O., Valentini P. P., Pennestrì E. Influence of tip relief in spur gears dynamic using multibody models with movable teeth. Mechanism and Machine Theory, Vol. 152, 2019, p. 59-73.
-
Shweiki S., Rezayat A., Tamarozzi T., Mundo D. Transmission error and strain analysis of lightweight gears by using a hybrid FE-analytical gear contact model. Mechanical Systems and Signal Processing, Vol. 123, 2019, p. 573-590.
-
Khosroshah M. Gh., Fattahi A. M. Three dimensional stress analysis of a helical gear drive with finite element method. Mechanika, Vol. 23, Issue 5, 2017, p. 630-638.
-
Patil S. S., Karuppanan S., Atanasovska I., Wahab A. A. Contact stress analysis of helical gear pairs, including frictional coefficients. International Journal of Mechanical Sciences, Vol. 85, 2014, p. 205-211.
-
Barbieri M., Zippo A., Pellicano F. Adaptive grid-size finite element modeling of helical gear pairs. Mechanism and Machine Theory, Vol. 82, 2014, p. 17-32.
-
Wang G., Chen L., Yu L., Zou S. Research on the dynamic transmission error of a spur gear pair with eccentricities by finite element method. Mechanism and Machine Theory, Vol. 109, 2017, p. 1-13.
-
Fraňová Z. Determination of Transmission Error at Bevel Gear. Brno, 2020, (in Slovak).
-
Vivet M., Mundo D., Tamarozzi T., Desmet W. An analytical model for accurate and numerically efficient tooth contact analysis under load, applied to face-milled spiral bevel gears. Mechanism and Machine Theory, Vol. 130, 2018, p. 137-156.
-
Zhuo Y., Xiang X., Zhou X., et al. Quasi-static tooth contact analysis of hypoid gear drive with coaxiality deviations. Journal of the Brazilian Society of Mechanical Sciences and Engineering, Vol. 40, Issue 7, 2018, p. 328.
-
Sánchez A. R. Gearbox Transmission Error study using Multi Body Analysis software MSC Adams. Sevilla, 2018.
-
Prokop A. Powertrain Vibration Modelling Using Virtual Prototypes. Brno, 2016, (in Czech).
-
Trochta M. Transmission Error of Involute Gars, its Measurement and its Relation to Noise and Vibrations of Gearboxes. Ostrava, 2019.
-
Jelaska D. Gears and Gear Drives. Wiley, Chichester, 2012.
-
Doležal M., Sychrovský M. Gear Teeth Modifications. Czech Raildays, 2010, (in Czech).
-
Palmer D., Fish M. Evaluation of methods for calculating effects of tip relief on transmission error, noise and stress in loaded spur gears. GearTechnology, 2012, p. 56-67.
-
Radzevich S. P. Dudley’s Handbook of Practical Gear Design and Manufacture. Second Edition, Taylor and Francis, Boca Raton, 2012.
Cited by
About this article

The research leading to these results has received funding from the project Specific research on BUT FSI-S-20-6267 and project TN01000026 granted by Technology Agency of the Czech Republic. The authors gratefully acknowledge this support.
