Abstract
The paper describes a constructive system parameter – Bending shape curvature, as a dynamic criterion for assessing the technical state of structures. Previous studies of various dynamic criteria for structural health control have revealed a lack of accuracy. Analysis of a constructive system dynamic work based on internal response only is limited by a variety of external force factors, the determination of which is difficult. A constructive system can be deformed due to a change in cross-section stiffness at one of its elements because of a defect or damage and that affects displacements at its control points. It makes it difficult to determine bending stiffness only by constructive system displacements. As a result, the development of structure test methods with a control impact force is relevant. The article presents the methods of calculating bending shape curvature over controlled displacements. It is suggested to use an artificial impact on a structural system for getting the elements response to the bending moment. The advantage of bending shape curvature calculating for assessing the stiffness of a structure system is explained. It is shown the results of defect size influence on bending shape curvature during static tests and stiffness assessment results of the metal frame during dynamic tests. The necessity of taking into account the stiffness of structures joints has been revealed, as well as a high dependence of method’s relative error on the value of dynamic shaker force and the distance between registration sensors.
1. Introduction
Throughout development of construction industry, there are discussions about the need to conduct various tests of buildings and structures. There is an opinion that visual inspection and measurements by non-destructive testing methods are enough to assess the technical condition of a construction object [1-2]. However, many accidents both on newly mounted buildings and those in operation indicate the lack of these measures. Force tests for current bearing capacity would reduce their number. There is a worldwide tendency to increase the material efficiency of construction due to modern design and calculation tools, which can significantly reduce the reserve of strength and stiffness [3]. This lowers the cost of construction but leads to an increase in the value of installation errors and expert control. There are many studies connected to searching the criteria for assessing buildings technical condition [4-9]. The main conclusion is that expert tests are necessary and relevant. They can increase the reliability and efficiency of the construction of buildings and structures.
Determining dynamic criteria for assessing structural health is a critical and difficult task since many factors are affecting the system dynamics in various conditions [9]. Recently, a large number of works have appeared on structure dynamics separately and the entire building as a whole. The criterion for assessing the technical condition in these methods are natural frequencies [6, 8, 10-12], logarithmic damping decrement, nonlinear distortion and amplitude modulation coefficients [7]. These criteria give a general integral assessment of the entire structure as a whole. Still, they are not aimed at monitoring a separate structure of an operating building. Low accuracy and resolution of dynamic methods remain a problem.
During dynamic tests, the parameters of a system, reflecting its internal properties, can be determined at various control points. Such parameters are resonance frequency, damping decrement, amplitude. Amplitude itself does not allow calculating stiffness of a specific building’s element as well as a control section of this element. To improve the accuracy of determining stiffness at a required section of the structural system element, it is proposed to consider the bending shape curvature as a dynamic criterion. This parameter can be used in a matching method by calculating it for a reference system from a priori design data and an actual system from measured data. The main difficulty is associated with obtaining a response to structural elements bending of the surveyed building. Thus, it is convenient to use dynamic tests [13], during which the constructive system is unbalanced using a modular shaker. In this case, the bending shape curvature is considered within an area of a specific size. The size is determined based on characteristics of the excitation mechanical vibrations system and registration system.
2. Relevance of dynamic tests
Dynamic tests can be defined as experiments on building constructive systems associated with simulation of a working time-varying load [14]. The main technical devices for dynamic testing are forced vibration excitation system and a registration system (Fig. 1).
Fig. 1Conceptual scheme of dynamic tests
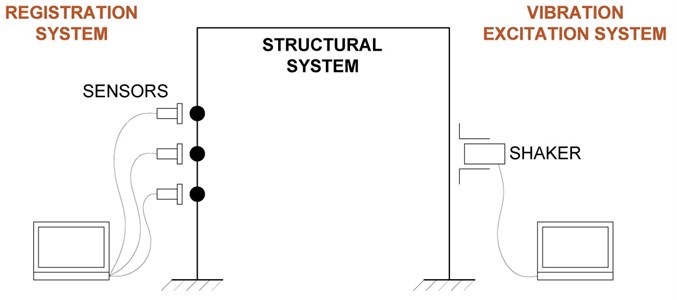
In this experience, the main advantages of dynamic tests over static ones:
1. Compactness of dynamic equipment.
Due to the dynamic effect, shaker’s eccentric weight can be significantly lower than weight of loading elements during static tests. Depending on the version, the modern modular electrodynamic shakers have a maximum sinusoidal force of 75-2700 N with a relatively small mass of 0.1-3.4 kg of the internal moving element.
2. Wide range of uses for various loading schemes.
Due to their compactness, modular shakers can be installed in various required directions, allowing to set an experimental dynamic load.
3. Transportation convenience of dynamic technical devices.
Disadvantages of dynamic tests over static ones:
(a) Lower measurement accuracy in comparison with static tests. For registration of mechanical vibrations sensors such as capacitive or piezoelectric accelerometers, electromechanical or electron-molecular velocimeters are used. These instruments relative error in measuring amplitude is on average 5 %, while the error of static deflectometers is 0.1 %. It is worth noting that the technology and manufacture of vibration and seismometric equipment are rapidly developing with continuous improvement in measurement accuracy.
(b) Lower accuracy of load simulation in comparison with static tests. The relative error of modular shakers sinusoidal force is about 3 %, which is higher than the static counterparts.
Thus, dynamic tests have certain advantages over static ones. In particular, it is time-consuming and often impossible to conduct static tests with appropriate measurements on constructed and operated buildings.
3. Criteria for technical condition assessing during dynamic tests
A number of dynamic parameters of a constructive system are known. The most researched one from a dynamic monitoring point of view is an oscillation frequency. A large number of studies [6, 8, 11, 12, 15] aimed at analyzing the vibrations of buildings and structures in relation to rigidity and reliability. These studies are about the convenience of determining common integrity and bearing capacity of a constructive system by frequency analysis. The analysis is especially convenient for monitoring the technical condition because the vibration frequency determination is not very time-consuming. However, for a detailed analysis of each element or joint of a constructive building system, frequency analysis is not effective due to interconnection of all structures in one single system. Therefore, resonant frequencies are the result of only the common work of all building structures. For this reason, we focus on considering building constructive system and its dynamic parameters in our work. At the same time, for element-by-element precise observation, it is necessary to analyze the vibration modes and amplitudes in different structures.
The most intense vibrations in structures are transverse because they are associated with bending deformations. The bending shape depends on structure stiffness which can be significantly be affected by defects. Under the same boundary conditions and loading, with the same bending moment diagrams, two identical structures will have the same bending shape curvature, while a pair of defective and intact structures will show different curvature of bending axis [16]. Defects and damages significantly influence the bending stiffness of structures. Having determined the stiffness in a given section of a structure, it is possible to draw a conclusion about its actual bearing capacity, residual resource and technical condition [16].
Fig. 2a) Influence of low stiffness area on displacement and curvature radius: 1) defect downstairs; 2) defect at the center; 3) some defects; b) rods bending shapes: 1) theoretical; 2) factual
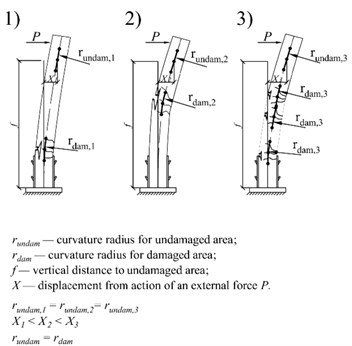
a)
b)
Stiffness assessment of a system can be carried out on the basis of amplitudes analysis for certain vibration modes [17]. Information about the displacement of a constructive system element at one point is not sufficient to assess the stiffness. The resulting displacements at a control point are influenced by displacements of adjacent points along the element’s length (Fig. 2(a)). Accordingly, the change in cross-section stiffness at one point leads to the change in displacements at all points of a structure. This factor can be eliminated by considering the bending shape curvature of a constructive element. Numerical and field experiments confirm the following: the curvature of a bent section does not depend on stiffness of adjacent sections along the length of constructive element [17]. In the current research the bending properties of rods and plates were considered as the most common elementary structural elements.
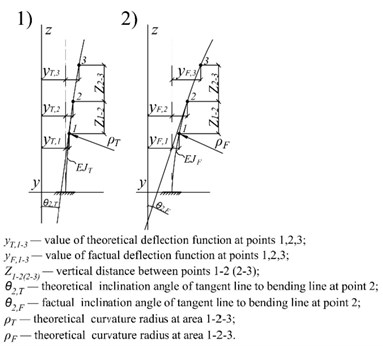
For beam structures, the Bernoulli-Euler beam model (Fig. 2(b)) and the well-known differential equation of a rod curved axis are suitable [18]:
where – inclination angle of a tangent line to bending line and -axis; – the second derivative of function with respect to increment at the point, – the bending moment; – the product of elastic modulus () and moment of inertia (), reflecting the bending stiffness of an element.
Using the matching method, we can compare the results of solving the equation for theoretical and actual bending forms, as well as for vibration modes. At the same bending moment from the external load, the bending shapes of rods will differ only due to change in bending stiffness Eq. (2) [17]:
where – the theoretical bending stiffness of a rod; – the factual bending stiffness of a rod; – the theoretical curvature radius; – the factual curvature radius.
Thus, the ratio of bending stiffness for theoretical and actual rods is directly proportional to their curvature radius ratio. To obtain the value of curvature radius, it is necessary to solve the differential Eq. (1) in vibration amplitudes. To do this, we define the derivatives of displacement function of a rod along its length (Fig. 2(b)). Due to the smallness of transverse displacements in comparison with the distance between calculation points, the change in the distance during bending can be neglected.
The first derivatives and at points 1 and 2 can be defined [16]:
where – inclination angle of a tangent line to bending line and -axis at point 1; – inclination angle of a tangent to bending line and -axis at point 2; – value of a deflection function depending on the displacement along -axis at point 1; – value of a deflection function depending on the displacement along -axis at point 2; – value of a deflection function depending on the displacement along -axis at point 3.
The second derivative at point 1:
Then the bending shape radius of a rod at point 1 will be equal to:
Thus, to calculate the curvature at a required section of a structure, it is necessary to measure displacements or amplitudes at three points of the section. In turn, to calculate the curvature radius at the controlled point, it’s needed to measure the displacements or amplitudes at three adjacent points.
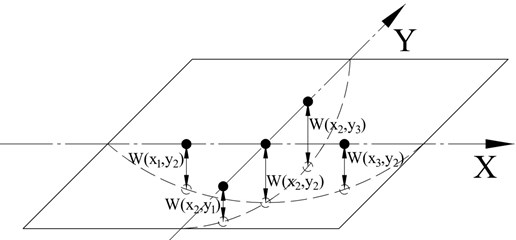
For the case of studying bending shape curvature of plates, a coordinate system is adopted in which () axes lie in an undeformed median plane of the plate, and a -axis is directed perpendicular to this median plane. That is, plate deformation is considered along the axes, but characterized by two deflections. Its median plane turns into a curved surface with the main curvature radius (in section by a plane parallel to ) and (in section by a plane parallel to ). The corresponding major curvatures of the median plane are:
Accordingly, the curvature radius:
Let’s consider the solution of these differential equations for the case of measured displacements or amplitudes in three adjacent points (Fig. 3). The first derivatives of a plate deflection function with respect to at points and will be equal:
where – value of plate deflection at the point ; – value of plate deflection at the point ; – value of plate deflection at the point ; – distance between points and ; – distance between points and .
The first derivatives of a plate deflection function with respect to at the points and will be:
where – value of plate deflection at the point ; – value of plate deflection at the point ; – distance between points and ; – distance between points and .
Further, the second derivative of a plate deflection function with respect to at the point :
Fig. 3Measuring scheme for curvature radius of a plate in two mutually perpendicular directions
The second derivative of a plate deflection function with respect to at the point :
Then the curvature radius of a plate along and axes will have the form:
According to the method for rods described above the curvature radius of plates are calculated for their theoretical and actual states. Next, their ratio is compiled to calculate the actual bending stiffness of a cross section of a plate in two mutually perpendicular directions. At the same bending moment from an external load, bending shapes axes of plates, constructed according to theoretical and experimental data, will differ only due to a change in bending stiffness. Then the stiffness ratio will look like [16]:
It should be noted that with this method of determining structural elements stiffness, actual stiffness of constructive system joints is required. This is a task for further research.
4. Approbation of the stiffness evaluating method by bending shape curvature during static tests with imitation of a structural defect
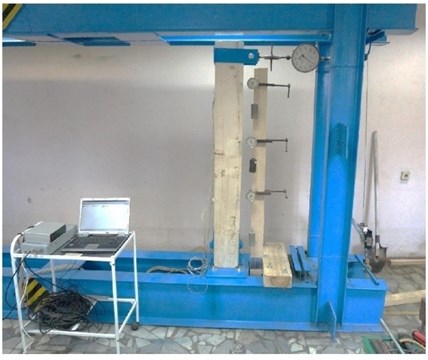
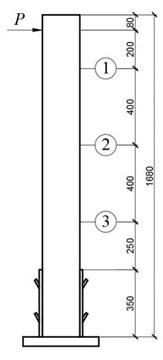
To investigate the bending shape curvature and assess its sensitivity for determining structural system stiffness, the experiment with wooden rack and a rigidly restrained joint was carried out by static tests (Fig. 4(a)) [17]. A constructive defect was simulated with control of its size (cutouts 20×20, 20×40, 20×60, 20×80 mm). Measurements of load displacements created by a ratchet winch were made at three adjacent points at a distance of 400 mm from each other using dial deflectometers located at the control area (Fig. 4(b)). Bending curvature was calculated from the measurements. Also, to compare the results, the rack tests were simulated in a computational complex with a simulation of the experimental parameters [17].
Fig. 4Laboratory setup: a) photo and b) a scheme of wooden rack. Legend: 1, 2, 3 in a circle – control points, indicator numbers; P – direction and point of force action
a)
b)
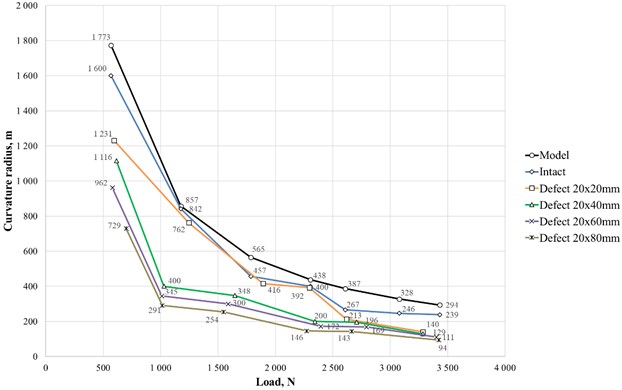
As expected, with load rise it’s observed the bending increase and the curvature radius decrease. The shape of all curves is hyperbola. The largest curvature radius is observed at the model rack, constructed at a computational complex, at all stages of loading (Fig. 5, black line). The radius value graph for the intact rack (Fig. 5, blue line) is close to the model’s value. The smallest radius value was shown by a rack with a defect of 20×80 mm. That is, the element with the lowest stiffness in a control area has the greatest deformability. It is important to note that with an increase in a defect size, bending curvature in the adjacent section remains at values of the first stage of loading.
Fig. 5Bending curvature radius of the rack calculated within the area of simulated defects for model rack, intact rack and one with defects of various sizes
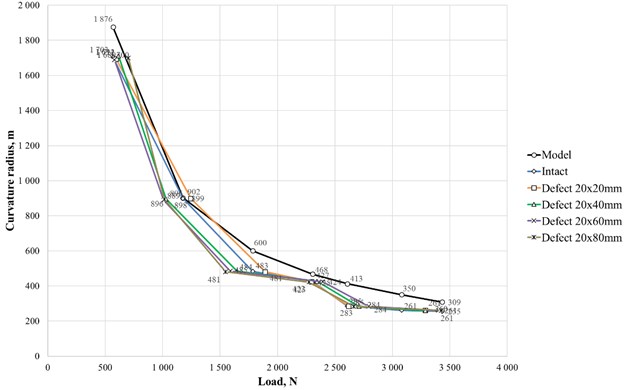
The curvature radius graphs remain close located and similar in shape at all defect sizes; the radius values do not decrease (Fig. 6). When processing the results, a possible decrease in rack timber deformation modulus was not taken into account. Under these conditions, stiffness determining has a relative error of 12 % to the calculated values, taking into account the defect size. Thus, the accuracy of the method in static tests is 88 % [17].
Fig. 6Bending curvature radius of the rack calculated within the area adjacent to simulated defects for model rack, intact rack and one with defects of various sizes
5. Approbation of the stiffness evaluating method by bending shape curvature during dynamic tests
As mentioned above, dynamic tests have significant advantages over static ones in the case of health monitoring of object as a whole. Therefore, it is important to evaluate the proposed method for determining stiffness in dynamic tests.
When conducting dynamic tests, test equipment selection is required, taking into account particular qualities of an inspected object [16]. Typically, the equipment for dynamic testing consists of a recording system and a mechanical vibration excitation system. The main parameters of these systems [16]:
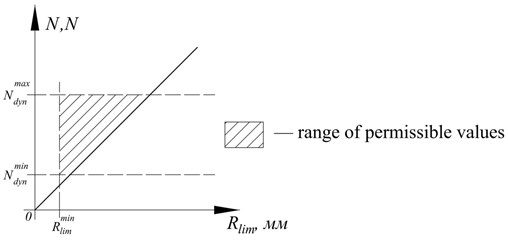
1. The recording ability. When planning dynamic tests, the most important characteristic is the minimum recorded vibration amplitude (mm, m/sec, m/sec2), or sensitivity threshold [16]. Mechanical vibrations are determined by dynamic shaker force characteristics (N). Accordingly, the higher the shaker power, the lower the required sensitivity threshold. Modeling a constructive system of a building being monitored makes it possible to estimate the expected amplitude for a given power of the shaker. The power can be limited by the minimum and the maximum allowable dynamic shaker force (Fig. 7). is determined by level of natural seismic and vibration noise. should not exceed design load with taking into account dynamic effect of a shaker (Fig. 7). Thus, selection condition of dynamic shaker power [16]:
where – the design value of the external load on a constructive system of a building in a given direction; – dynamic factor.
The initial value of the registration threshold can be taken as the amplitude at the point of a constructive system with the highest by value stiffness. Thus, dynamic equipment sensitivity can be understood as the ratio of dynamic force to the minimum recorded signal [16]. The approximate recording ability graph is linear and is shown in Fig. 7. Determination of the exact dependence of threshold registration on a dynamic force is a task for further research.
Fig. 7Approximate sensitivity plot for dynamic tests equipment
2. The frequency range of a registration system. The range should lie within the first five natural vibrations frequencies of a monitored building. The frequency band 0.1-300 Hz, as a rule, covers most of the design solutions of buildings and structures [16].
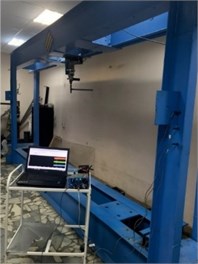
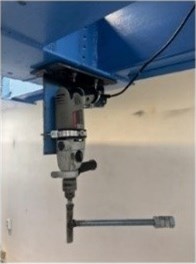
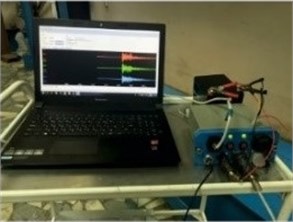
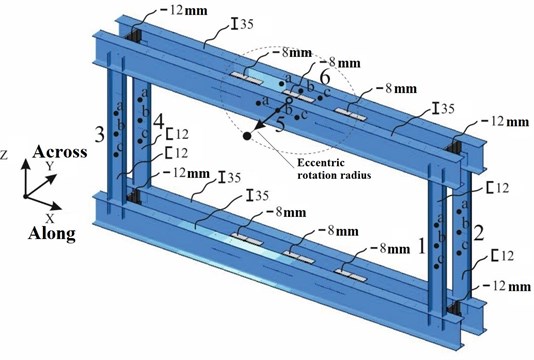
To investigate the bending shape curvature as a dynamic criterion, the experimental setup was made, which consisted of an experimental spatial metal frame and dynamic test equipment. The setup is shown in Fig. 8 which include the general view of the test frame (a), the self-made modular shaker that excites force vibration with a constant frequency and sinusoidal force (b), the registration system (c) and the sensors (d-e). Frame elements include crossbars of an I-beam 35 section, racks of channels 120 section, rigidity diaphragms of sheet steel with a thickness of 8 mm and 12 mm. The stiffness of all four racks and two crossbars were analyzed. Control points with sensors located on them were at a distance of 100 mm from each other.
Fig. 8Experimental setup: a) general view of the test frame; b) modular shaker; c) registration system; d) placement of vibration sensors on the frame rack; e) placement of vibration sensors on the frame crossbar
a)
b)
c)

d)

e)
The parameters of dynamic and measurement test equipment are shown in Tables 1-2. The test and measurement scheme is shown at Fig. 9.
Table 1Modular shaker characteristics
Characteristic | Unit measurements | Value |
Peak sinusoidal force | N | 604.4 |
Frequency width | Hz | 0-25 |
Linear eccentric frequency | Hz | 6.58 |
Eccentric mass | kg | 0.885 |
Eccentric rotation radius | m | 0.4 |
Table 2Registration system characteristics
Characteristic | Unit measurements | Value |
Frequency range of VS 201 accelerometers | Hz | 0.1-500 |
The minimum value of measured vibration acceleration | mm/sec2 | 20 |
Relative error of vibration acceleration measurement | % | 5 |
The bit width of the amplitude-frequency converter | Unit | 24 |
Frequency width | Hz | 0-1680 |
Sampling frequency | Samples/sec | 1000 |
Amplification factor | Unit | 1 |
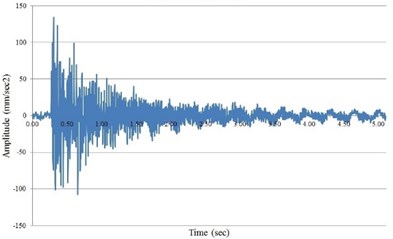
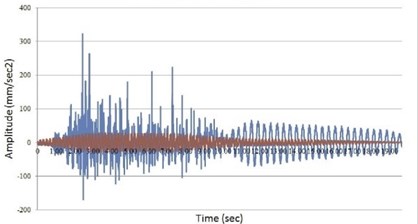
The dynamic parameters of the frame are determined first; including natural oscillations frequencies and logarithmic damping decrement. For this, the frame was hit several times with a sledgehammer to unbalance it, which excites mechanical vibrations (the vibrogram sample with an impact is shown in Fig. 10). In this case, the vibration sensors are installed at the center of the frame on rigidity diaphragm between the upper crossbars (Fig. 8(e)). This arrangement of accelerometers allows to record the most intense movements in the upper points of an object.
Fig. 9Test frame model indicating the cross-sections, measurement axes, eccentric movement trajectory (dashed line), measurement points (a, b, c)
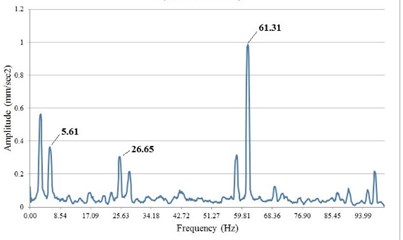
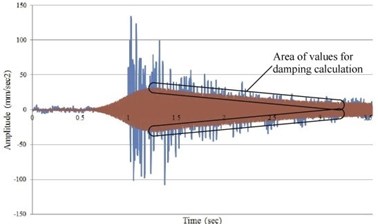
Resonant frequencies and damping decrement are determined according to known methods [7, 16] through peaks selection in an DFT amplitude spectrum of vibrogram samples (Fig. 10). Criteria for selecting frequencies: values repetition in all samples, non-coincidence of values with the ratio 50/ ( is an integer) to exclude the influence of machine operation. The oscillations logarithmic decrement is defined as an average of ratios of two adjacent critical (with zero derivative) points on a vibrogram [19] (Fig. 11(a)). Vibrogram with impact time history was filtered by a Butterworth bandpass filter with a width ( is duration of a recording sample, sec) with a central resonant frequency. The root means square value (RMS) is taken as a true.
Next, there is a vibrations generation excited by a modular shaker (Fig. 11(b)). The duration of exposure is 10 seconds with a constant frequency of oscillator rotation. A series of shaker starts is conducted with a parallel vibrations registration along and across the frame. Vibrogram processing was carried out in the Windows Seismic Grafer (WSG) software. Fig. 11(b) shows that filtered shaker time history with a filter’s width 0.2 Hz is much less intense than unfiltered one. While filter’s width 1.0 Hz increases vibrogram values up to 50 % that accordingly affect the curvature radius.
Fig. 10a) Impact time history; b) DFT of Impact time history with resonant frequencies
a)
b)
Fig. 11a) Scheme for logarithmic decrement calculation; b) shaker operation history with initial vibrogram (blue) and filtered (red)
a)
b)
Integrating of accelerogram numerical series results in displacement diagram. Then a root mean square value of displacements under shaker load is calculated. For simulating shaker’s dynamic load dynamic coefficient is calculating by the formula [20]:
where – forced vibration frequency; – resonant frequency; – damping logarithmic decrement. After determine of dynamic parameters, bending shape curvature radius of an elastic line for selected elements of the frame is calculated.
Next, the model of a frame constructive system is composed in a computational complex (Fig. 9). The joints of the model elements are assumed to be rigid; the connections of supporting bottom crossbars are also rigid. The steel grade of all frame elements according to processing data from a hardness tester is C345 (S355JR – analogue by EN-10025 standard). Nominal axes were set along which vibration was recorded. Theoretical resonant frequencies are calculated in the complex (Table 3). Then to compare the actual system operation with the theoretical model, the load from a shaker is set similar to the dynamic test, taking into account the calculated dynamic coefficient.
Table 3Comparison of theoretical and experimental resonant frequencies
Frequency number | Theoretical (model), Hz (rad/sec) | Experimental, Hz (rad/sec) |
1 | 8.81 (55.33) | 5.61 (35.23) |
2 | 28.07 (176.28) | 26.65 (167.36) |
3 | 63.31 (397.59) | 61.31 (385.03) |
Forced vibrations frequency 6.67 Hz (41.89 rad/sec).
Logarithmic damping decrement at first resonant frequency 0.183.
Dynamic force 141.35 N.
Dynamic coefficient 2.334.
Static force with a dynamic factor 336.98 N.
Further consider an example of calculating the radius of bending shape curvature from the experimental measured amplitudes (mm):
In a similar way, the calculation for all controlled elements is performed according to the model and experimental data. The calculation results are shown in Table 4.
Table 4Calculating results of frame elements bending stiffness in control sections by dynamic tests
Area number | Model curvature radius , m | Experiment curvature radius , m | Model bending stiffness, N·m2 | , % | Experiment bending stiffness, N·m2 |
Front right rack | |||||
Across | 4 000 | 3 984 | 3 131 200 | –0.41 | 3 118 414 |
Along | 25 000 | 21 958 | 232 780 | –13.85 | 200 532 |
Back right rack | |||||
Across | 1 460 | 1 238 | 3 131 200 | –17.94 | 2 569 607 |
Along | 7 692 | 9 852 | 232 780 | +21.92 | 283 808 |
Front left rack | |||||
Across | 1 449 | 2 063 | 3 131 200 | +29.74 | 4 062 457 |
Along | 7 837 | 10 895 | 232 780 | +28.07 | 298 116 |
Back left rack | |||||
Across | 1 449 | 1 479 | 3 131 200 | +2.00 | 3 193 888 |
Along | 7 692 | 6 871 | 232 780 | –11.96 | 204 948 |
Front crossbar | |||||
Across | 769 | 1 106 | 109 098 000 | +30.48 | 142 347 110 |
Back crossbar | |||||
Across | 769 | 993 | 109 098 000 | +22.55 | 133 698 246 |
The processing results of experimental data show the discrepancy between bending stiffness values of the model frame and the actual experimental one. The difference is within the range of 0.4-30.5 %. There is a values deviation from the theoretical ones, which may indicate an abnormal elasticity modulus, as well as a non-standard design of the frame structures joints. In the experiment, material and conditions for frame fixing are taken as reference undamaged. In our opinion, it is necessary to experimentally determine the actual joints stiffness of a structure before conducting tests. In described conditions, after statistical processing the relative error of stiffness values was about 21 %. This is lower than the values obtained during static tests, which can be caused by an error in accelerometers operation and a low ratio of a shaker dynamic force to a minimum recorded signal. It is also worth noting that the distance between vibration sensors is 200 mm. With this placement scheme, the difference in acceleration values at adjacent control points is 30-50 mm/sec2, which, with taking into account an error of 5 %, is close to the sensitivity threshold of the applied capacitive accelerometer. Thus, in dynamic tests it is beneficial to increase distance between sensors, which raises the difference in values during vibrations, but reduces the control area. Also, more powerful shaker can provide the values difference, which leads to more intense vibrations and more bending of elements. In this case, it is necessary to consider the hazards of damaging a monitored structure.
6. Conclusions
Testing of buildings and structures is necessary and relevant from their reliability and material efficiency point of view. There is a worldwide trend towards a decrease in strength and stiffness reserve for lowering the construction costs. One of the problems for non-destructive monitoring of structure’s technical condition is complexity of element-by-element control. To solve this problem, dynamic tests of structures can be used. The relevance of these tests is shown in the work. Also, bending shape curvature is proposed to use as a criterion for assessing the bending stiffness of a controlled element of a structure. The main advantage of this parameter is shown, that is independence of the control section bending shape of the stiffness of adjacent ones. The calculation method of bending shape curvature over displacements or amplitudes at three adjacent points within a control section is considered for rods and plates.
However, the bending curvature directly depends on the bending moment diagram and therefore on the actual stiffness of structural joints.
The article also provides a study of the bending shape curvature under dynamic load. The algorithm for processing vibration data is shown, which aims initial data for calculating the bending shape curvature. The paper uses the matching method with a reference model of a structure to estimate the actual bending stiffness of controlled elements.
The further research agenda is to study the possibility of assessing the actual stiffness of structural joints during dynamic tests and development these methods. Also, it is actual to estimate the accuracy of the proposed method and processing vibration data.
References
-
Agdas D., Rice J., Martinez J., Lasa I. Comparison of visual inspection and structural-health monitoring as bridge condition assessment methods. Journal of Performance of Constructed Facilities, Vol. 30, Issue 3, 2015, p. 04015049.
-
Hellier Ch. Handbook of Nondestructive Evaluation. McGraw-Hill, 2003, p. 594.
-
McCartney L. Can safety factors be reduced safely when designing against fatigue. Fatigue of Engineering Materials and Structures, Vol. 2, 1980, p. 387-400.
-
Kostrzewski M. Securing of safety by monitoring of technical parameters in warehouse racks, in high-bay warehouses and high storage warehouses – literature review of the problem. LogForum, Vol. 13, Issue 2, 2017, p. 125-134.
-
Fidali M. Thermographic criteria of evaluation of technical condition of machinery and equipment. Measurement Automation Monitoring, Vol. 61, Issue 6, 2015, p. 245-248.
-
Yudakhin F., Kapustyan N., Antonovskaya G. Engineering and Seismic Studies of the Geological Environment and Building Structures Using Wind Vibrations of Buildings. Ural Branch of the Russian Academy of Sciences, Yekaterinburg, 2007, p. 153.
-
Korobko V., Kalashnikov M., Kalashnikova O. Stiffness control of reinforced concrete bridges using a dynamic criterion - coefficient of nonlinear distortions. Fundamental and Applied Problems of Engineering and Technology, Vol. 6, Issue 314, 2015, p. 130-135.
-
Volkovas V., Petkevičius K., Eidukevičiütė M., Akinci T. C. Diagnostics of construction defects in a building by using time-frequency analysis. Mechanika, Vol. 18, Issue 4, 2012, p. 432-437.
-
Morgantini M., Betti R. The inner product vector as an output-only cross-correlation-based feature to structural damage assessment. Journal of Vibroengineering, Vol. 22, Issue 6, 2020, p. 1373-1398.
-
Nesterenko A., Stolpovsky G., Nesterenko M. Method of calculation flexural stiffness over natural oscillations frequencies. Archives of Civil Engineering, Vol. 64, Issue 4, 2018, p. 89-103.
-
Kamgar R., Rahgozar R. A simple approximate method for free vibration analysis of framed tube structures. The Structural Design of Tall and Special Buildings, Vol. 22, Issue 2, 2013, p. 217-234.
-
Crainic L., Munteanu M. Seismic performance of Concrete Buildings. Structures and Infrastructures Book Series, Vol. 9, 2019, p. 260.
-
Rainer J. Dynamic testing of civil engineering structures. Proceedings of the Third Canadian Conference on Earthquake Engineering held in Montreal, Vol. 1, 1979, p. 551-574.
-
Williams M., Blakeborough A. Laboratory testing of structures under dynamic loads: an introductory review. Philosophical Transactions of The Royal Society A: Mathematical, Physical and Engineering Sciences, Vol. 359, Issue 1786, 2001, p. 1651-1669.
-
Kotlyarevsky V. Diagnostics of hidden defects of seismic resistant structures by changing the frequency spectrum. Earthquake-resistant construction. Safety of Structures, Vol. 4, 2014, p. 36-42.
-
Nesterenko A., Zhadanov V., Stolpovsky G., Nesterenko M. Stiffness evaluation of a metal frame by the method of dynamic tests. Proceedings of the International Symposium Engineering and Earth Sciences: Applied and Fundamental Research, 2019, p. 595-600.
-
Nesterenko A., Nesterenko M., Stolpovsky G. Approach to the solution of a bending inverse problem for the example of a wooden rack. Electronic Journal Bulletin of the Orenburg Scientific Center, 2019.
-
Euler Leonhard The Method of Finding Curved Lines That Have the Properties of a Maximum or Minimum, Or the Solution of an Isoperimetric Problem, Taken in the Broadest Sense. Gostekhizdat, 1934, p. 600.
-
Zhadanov V., Nesterenko A., Nesterenko M., Stolpovsky G. Study of the absorbing properties of the material of building structures on the example of a reinforced concrete bulkhead. News of Higher Educational Institutions. Construction, Vol. 9, Issue 693, 2016, p. 76-86.
-
Clough Ray W., Penzien Joseph Dynamics of Structures. New York, 1975, p. 643.
About this article

