Abstract
The use of protective clothing under extreme conditions leads to heat stress with undesired consequences on human physiology. As a prevention measure, thermal indices and thermophysiological models have been developed. Based on these models and indices, it is possible to estimate the time limits for staying under risky conditions, e.g., by the predicted rectal temperature whose value is one of the most important parameters used for assessing the heat stress. This article is focused on the comparison of rectal and mean skin temperature prediction realized by the Fiala-based thermophysiological model (FMTK) and Predicted heat strain (PHS) index with results from the real experiment for normal and protective clothing. Three types of ensembles were tested and simulated as follows: Klimatex underwear, air-permeable military NBC suit M2000 (FOP), and impermeable chemical protective clothing Tychem-F. The real experiments of thermal strain were performed with one male participant (80 kg, 1.75 m) walking on the treadmill located in the climate chamber. The temperature range for neutral and hot tests was set from 25 °C to 40 °C. The rectal temperature, skin temperatures, and heart rate were measured. The results showed that PHS index is well usable for normal clothing (Klimatex underwear) and air-permeable protective clothing (FOP) under various ambient temperatures, and it is able to give results similar to FMTK model and experiment, the mean absolute error MAE for rectal temperature prediction was for all ambient temperatures lower than 0.5 °C. FMTK model demonstrated good predictability for impermeable protective clothing Tychem-F, the maximum value of MAE 0.69 °C. Whereas PHS index showed several times larger error, the maximum value higher than 1.8 °C, in the prediction for this type of clothing. The performed simulations showed that the accuracy of the prediction by the PHS index is not so strongly dependent on the value of the overall clothing resistance, but it depends on the value of the moisture permeability index (permeable vs impermeable clothing) which is connected with the water vapor partial pressure under the clothing.
1. Introduction
Even today, when automation and robotics affect almost all human activities, areas where the machine cannot completely replace humans remain. In some of these cases, humans can be exposed to extreme temperatures and associated dangerous conditions. Exposition to extreme temperatures or hazardous materials (chemicals, biological agents, or radioactive materials) is a possible risk, e.g., first responders, soldiers, or firefighters, and can negatively affect their health or even life. In such cases, the use of protective clothing is necessary, however, wearing such type of protection is connected with the risk of high thermal stress. To predict the risk of human exposure to overheating, models and indexes intended for predicting human thermal stress are widely used. Based on these models and indexes, it is possible to estimate the time limits for staying in these protective clothing under risky conditions or to propose preventive measures while using the protective clothing.
The models and indexes differ in their complexity and have limitations and validity range [1]. A lot of authors published articles in this context. In 2011, Foda et al. [2] published an article focused on testing and comparing results from the Fiala model, model UCB [3] (the University of California, Berkeley thermoregulation model), and MS-Pierce model [4]. In this study, the prediction of the skin temperature and thermal sensation from the individual models was compared. Results from the MS-Pierce model reported the lowest absolute deviation from the measured data in steady-state. For the dynamic case of ambient conditions, the MS-Pierce model along with the Fiala model showed better predictability than the UCB model.
Brode et al. [5] published in 2017 the study focused on the estimation of workability in warm outdoor environments based on three different thermal indexes: WBGT index [6], PHS index [7], and UTCI-Fiala index [8]. Whole-day shifts with varying workloads were simulated using as input meteorological records for the hottest month from four cities with prevailing hot (Dallas, New Delhi) or warm-humid conditions (Managua, Osaka). WBGT index showed greater constraints for moderate workload, but on the other hand, it was less strict for high workload in comparison with UTCI-Fiala and PHS index. The PHS index showed that it is not suitable for evaluating thermal stress during the rest from the work, because it gives an unrealistic dynamic response in comparison with UTCI-Fiala.
The article published by Kownacki et al. [9] is focused on the comparison of the Fiala model and PHS index with experimental data for ambient temperature 34 °C and relative humidity 40 %. The test took 3 hours and it was performed for different metabolic rates. The rectal temperature, sweating, mean, and local skin temperature were evaluated. Moreover, the article provides a comparison of physiological behaviour between men and women. Fiala model predicted the rectal temperature more precisely in comparison with the PHS index, but it is necessary to consider that the PHS index is weakly verified for rest situations. Both models predicted simulated temperatures more accurately for males than females. The measured mean skin temperature fluctuated because of the changes in the individual activity phases, neither of these models reflected its behaviour, but the temperature fluctuation was more obvious in the PHS simulation than in Fiala.
The study provided by Koelblen et al. [10] compared models for the prediction of thermal sensation. This article points out the fact that individual models for the prediction of thermal sensation can be affected by the accuracy of the results from the thermal models and indexes because the values of these results are inputs into the thermal sensation models.
Fiala-based Human Thermophysiological model FMTK (as a direct translation from the Czech language – Physiological Model of Thermal Comfort) was developed at the Department of Thermodynamics and Environmental Engineering (FME BUT) and was verified for a wide range of ambient temperature and used for testing of protective clothing [11]. Moreover, the module “Bodybuilder” was created and implemented into this model to enter individual characteristics as input into the passive system of the model [12].
As described above, the models and indexes used for the prediction of the thermal stress can provide different results for the same test cases. The aim of this study is a comparison of two models: Predicted Heat strain [7] (PHS) based on the analytical approach and Fiala-based Human Thermophysiological model [11] (FMTK) with results from real experiments and determining the conditions of their applicability.
2. Methods
2.1. Description of the experimental study
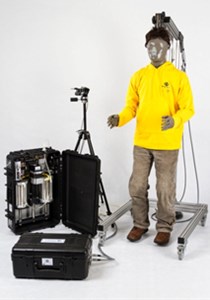
Three types of ensembles were tested and simulated as follows: Klimatex underwear, air-permeable military NBC suit M2000 (referred as FOP, i.e., Filtration Protective Overall), and impermeable chemical protective clothing Tychem® F (DuPont), see Fig. 1. The protective suits were completed with a protective face mask CM6, underwear cotton gloves, protective rubber gloves, and CBRN protective overboots. For the basic clothing parameters see Table 1, detailed clothing parameters are in [11].
Table 1Clothing parameters of tested clothing
Clothing | Overall clothing resistance | Moisture permeability index |
[clo] | [–] | |
Klimatex underwear | 0.37 | 0.4 |
FOP | 1.08 | 0.34 |
Tychem-F | 1.06 | 0.03 |
Fig. 1Tested clothing: Klimatex underwear, FOP, Tychem-F. Adopted from [11]
![Tested clothing: Klimatex underwear, FOP, Tychem-F. Adopted from [11]](https://static-01.extrica.com/articles/21795/21795-img1.jpg)
The thermal resistance of clothing has units [m2.K.W-1], but very often the unit [clo] is used. For the naked man is applied the value 0. Values of the thermal resistance for individual clothing or a combination of different layers of clothing are set by the thermal manikin measurement, see Fig. 2. The conversion of units from [clo] to [m2.K.W-1] is given in Eq. (1):
Moisture permeability index is more related to the permeability of the clothing than to the thermal insulation itself. Moreover, it depends on the cut around the neck, sleeves, etc., and the size of the holes. For the naked person, the value of the is 0.5, for normal clothing, its value is around 0.4, and for the non-permeability clothing, is close to zero [13]. Table 1 shows that value of the two tested types of protective suits is very close (FOP 1.08 clo and Tychem-F 1.06 clo). On the other hand, despite the close value, the value of for these two clothing differs by an order of magnitude (FOP 0.34 and Tychem-F 0.03).
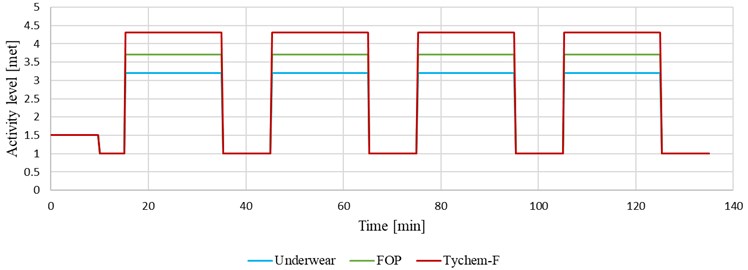
The real experiments of thermal strain were performed with one male participant (80 kg, 1.75 m) walking on a treadmill located in the climate chamber. The temperature range for neutral and hot test conditions was from 25 °C to 40 °C. The period of every test was from 55 to 125 min, see Table 2. The test procedure included the following steps: For neutral and hot conditions, firstly, the preconditioned phase was 10 minutes at room temperature 23 °C with only underwear shorts dressed up. The skin/rectal temperature sensors were then installed followed by donning of the protective ensemble and entry into the climate chamber. After 5 min acclimatization rest, the test procedure started: 20 min exercise (walking on the treadmill, velocity 4 km/h, slope 10 %), then 10 min rest, and repeating the regime 20 min exercise + 10 min rest until the end of the test. The limit criterion for the test termination was the time limit (max. 95 or 125 min) or achieving the limit of the rectal temperature 38.5 °C, the limit of heart rate (220 – age), or on proband request. The metabolic rate during the whole tests is described in Fig. 3.
Fig. 2a) Thermal manikin newton, b) measurement of clothing parameters with thermal manikin Newton
a)
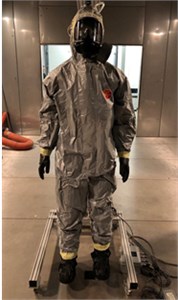
b)
Table 2Test scenarios
Scenario | Number of tests | Ambient and radiant temperature | Metabolic production | Time |
[°C] | [met] | [min] | ||
Klimatex underwear | 2 | 25, 30 | 3.2 | 125, 95 |
FOP | 2 | 35, 40 | 3.7 | 83, 125 |
Tychem-F | 2 | 30, 40 | 4.3 | 75, 55 |
The rectal temperature and surface temperatures were measured every minute. For the measurement of rectal temperature and heartbeat, the MEDIPORT-system was used. The metabolic rate was measured by using spirometric-telemetric device Oxycon Mobile measuring oxygen consumption in previous coincident tests with the same proband, clothing, and conditions.
Fig. 3Metabolic rate during the neutral and hot tests for individual clothing ensembles
2.2. Simulations and comparison procedure
Results from simulations provided by the FMTK model and PHS index were compared with the experimental data. FMTK model was widely validated, ranges see Table 3 [11].
Table 3Range of validity of FMTK model [11]
Parameters | Minimum | Maximum |
[°C] | 5 | 48 |
[met] | 0.8 | 9 |
[clo] | 0.01 | 1.08 |
In order to be able to enter individual characteristics as input into this model, the module named “Bodybuilder” was created [12]. Due to the incorporation of this module to the passive system of the FMTK model, the individual anthropometric data (mass, skin area, body fat) can be considered in the prediction of the physiological response of the human body. FMTK provides the prediction of the mean skin temperature, rectal temperature, and the prediction of local skin temperatures. This model is based on the numerical solution of heat transfer in the human body with a resolution of 19 human body segments, see Fig. 4(a). Moreover, the FMTK model and Bodybuilder module were implemented in software MATLAB and a simple GUI was created, see Fig. 4(b).
Fig. 4a) Model of the human body with a resolution of 19 segments, b) the GUI of FMTK model

a)
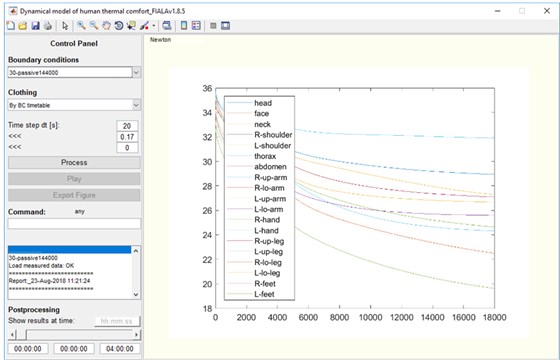
b)
Predicted Heat Strain index (PHS) based on the analytical approach is intended for the prediction of core temperature, mean skin temperature, and intensity of sweating. Like the previous models, it is implemented in MATLAB based on the publication [7] coming from the standard ISO 7933. Calculation of the PHS index is much simpler and less time-consuming than the FMTK model, but on the other hand, it has narrower ranges of validity, see Table 4.
Table 4Range of validity of PHS model [7]
Parameters | Minimum | Maximum |
[°C] | 15 | 50 |
[kPa] | 0 | 4.5 |
[°C] | 0 | 60 |
[ms-1] | 0 | 3 |
[W] | 100 | 450 |
[clo] | 0.1 | 1.0 |
For comparison of simulated data with the real experiment, the mean absolute error (MAE) was used. It was calculated in the Excel program according to the following formula:
where the difference between the measured and simulated value is in absolute brackets and is the number of measurements. For evaluation of the accuracy of predicted parameters, it is also possible to use, for example, the value of root mean square deviation (RMSD) and bias, see [14], or the value of the mean absolute deviation (MAD), see [11].
3. Results
Results are presented for each individual clothing set. The following graphs show the results for individually selected scenarios (clothing and ambient temperature).
The following graphs (Figs. 5-10) show the predicted rectal and mean skin temperature compared to real data measured experimentally. The rectal temperature is one of the most important parameters used for assessing the heat stress and its value (38.5 °C) is used as one of the limit criteria for the termination of these types of tests. The mean skin temperature is often used as an indicator of sweating effectiveness.
3.1. Klimatex underwear
For the scenario with Klimatex underwear, it is possible to see that although the PHS index is much simpler than the FMTK model, it can generally predict accurately both rectal and mean skin temperature as observed for both tested air temperatures (Fig. 5 for 25 °C and Fig. 6 for 30 °C). The minor inaccuracy of the PHS index can be observed in Fig. 5 for the prediction of the mean skin temperature, where the PHS index a little overestimated its value.
Fig. 5Comparison of simulated rectal temperature and mean skin temperature with experimental data (Klimatex, Ta= 25 °C)
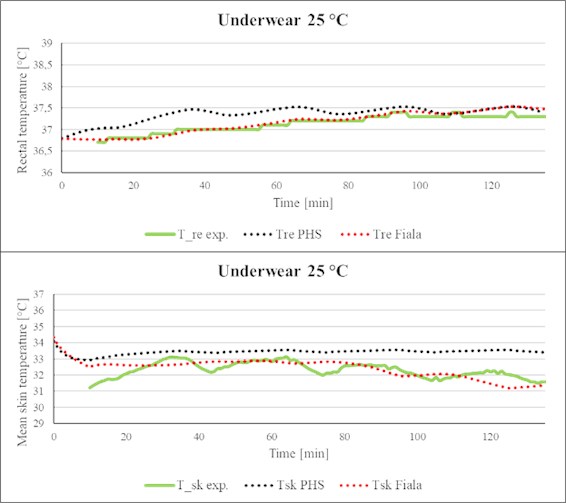
Fig. 6Comparison of simulated rectal temperature and mean skin temperature with experimental data (Klimatex, Ta= 30 °C)
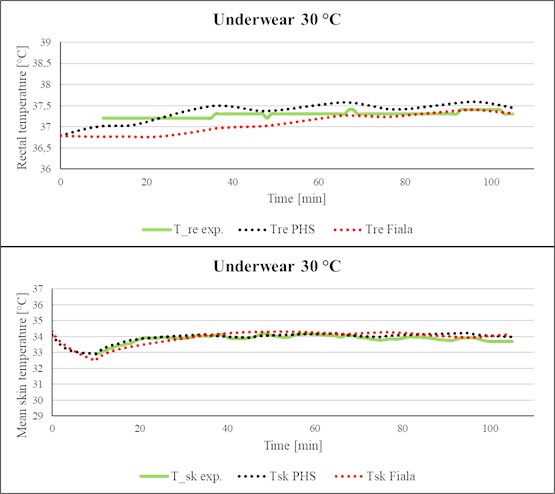
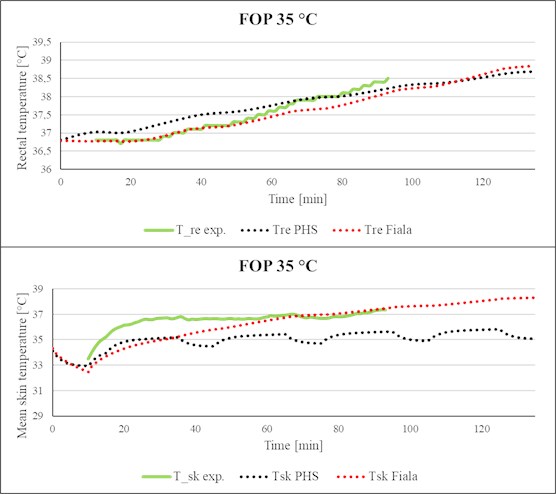
Fig. 7Comparison of simulated rectal temperature and mean skin temperature with experimental data (FOP, Ta= 35 °C)
3.2. Air-permeable NBC protective suit M2000
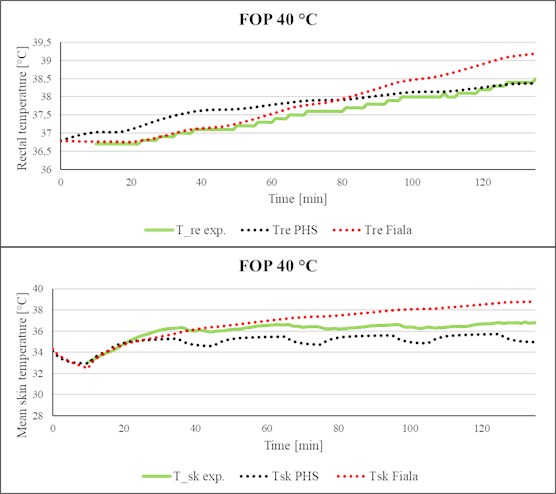
The same comes for the scenario with air-permeable NBC protective suit M2000 (FOP, Fig. 7-8), however, unlike the previous case (Klimatex underwear), the PHS index in this scenario slightly underestimated the mean skin temperature for both air temperatures (35 °C and 40 °C). However, it is necessary to point out that the values of measured mean skin temperature lie between the predicted values of both used models (FMTK, PHS) as shown in Fig. 8. As for the test in protective clothing FOP represented by graphs of the rectal temperature (Fig. 7-8), the real measured values correspond to the prediction of the model FMTK at the beginning of the test, but from the middle of the test, the PHS index provides a better prediction of the progress of rectal temperature in time.
Fig. 8Comparison of simulated rectal temperature and mean skin temperature with experimental data (FOP, Ta= 40 °C)
3.3. Impermeable protective suit Tychem-F
For the protective suit Tychem-F (Fig. 9-10), the PHS index also underestimated the mean skin temperature for both tested temperatures (30 °C and 40 °C), but the main problem comes with the prediction of the rectal temperature by the PHS index. From the graphs of rectal temperature (Fig. 9-10), it is possible to observe that the PHS index predicts unrealistic values in comparison with the data from real measurements as well as with the data predicted by the FMTK model. The increase of the value of the predicted rectal temperature by the PHS index is much faster compared to the real measurement and prediction given by the FMTK model. Moreover, the final value of the rectal temperature predicted by this index is close to the 42 °C compared to the 38 °C measured in the real test and predicted by the FMTK model.
3.4. Mean absolute error for rectal temperature prediction
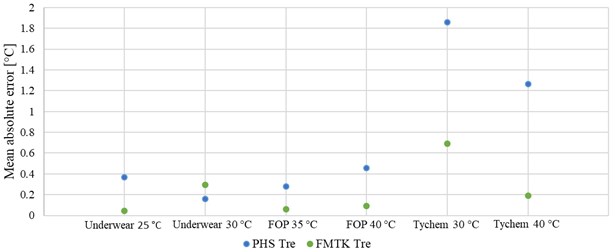
The mean absolute error (MAE) was preferably calculated for the prediction of the rectal temperature, as this temperature is a significant parameter for the evaluation of the health risk related to overheating. Fig. 11 shows the calculated MAEs for the individual clothing ensembles and ambient temperatures. For the purpose of data consistency, the experimental and predicted data was cut according to the shortest test case (Tychem-F 40 °C – 55 minutes of measurement) for the calculation of MAE.
The value of MAE for the Klimatex underwear and for the FOP is for all ambient temperatures lower than 0.5 °C. In addition, it is possible to see that there is no significant difference between the rectal temperature prediction by the FMTK model or by the PHS index. Furthermore, the FMTK model demonstrates good predictability for the suit Tychem-F with the value of mean absolute error 0.69 °C for ambient temperature 30 °C and 0.19 °C for ambient temperature 40 °C. Whereas for this type of clothing, the PHS index shows several times larger error in predictability than the model FMTK. However, in test cases for Tychem-F, both models provide the lower MAE value for the higher ambient temperature.
Fig. 9Comparison of simulated rectal temperature and mean skin temperature with experimental data (Tychem-F, Ta= 30 °C).
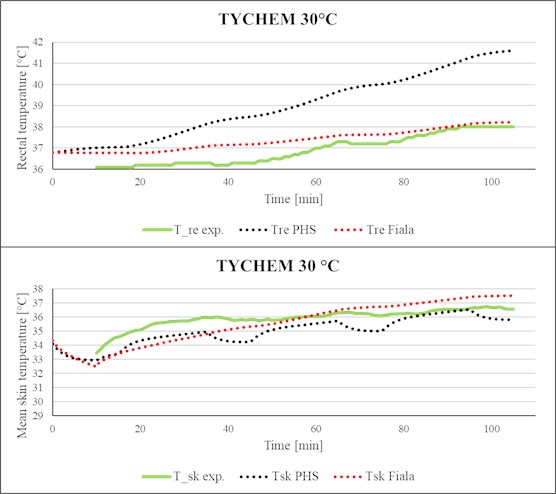
Fig. 10Comparison of simulated rectal temperature and mean skin temperature with experimental data (Tychem-F, Ta= 40 °C).
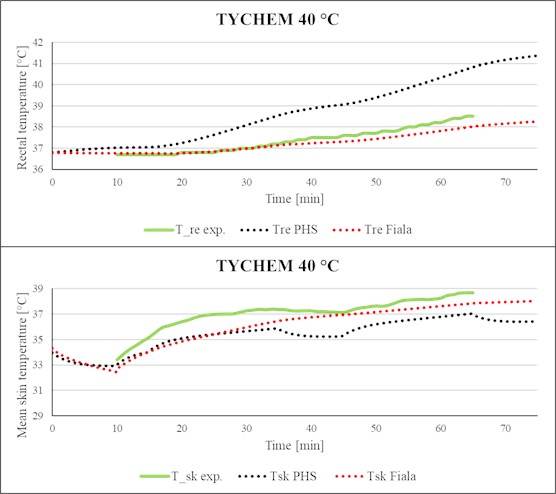
Fig. 11Mean absolute error of the rectal temperature prediction
4. Discussion
In the case of a comparison of the predictions given by the PHS index and FMTK model, it is necessary to take into account their approach to the predicted heat stress. PHS index is based on the analytical approach, mainly on the heat balance equation, while the FMTK model is based on the Fiala approach which is constructed on the incorporation of the passive and of the active system into the prediction of the heat stress.
The results showed that for normal conditions and for clothing with the value of within the range of validity, see Table 4, the PHS index is well usable for the prediction of rectal temperature and mean skin temperature with sufficient accuracy. Moreover, the PHS index is much simpler compared to the FMTK model and the calculation of the predictions provided by this index is less time-consuming. Besides, the PHS index can be used for the prediction of the heat stress for air-permeable protective clothing FOP with clothing insulation a little higher than 1 clo (1.08 clo), which is the maximum value in the standard for using the PHS index.
The problem comes for the prediction of the rectal temperature for the impermeable protective suit Tychem-F, where the PHS index overestimated the value of this temperature in comparison with real data from the experiment. The value of MAE for the predicted rectal temperature by this index is much higher, see Fig. 11, in comparison with the MAE value for predicted rectal temperature by the FMTK model. The probable explanation of this behavior is possible to find in Table 1. Compared to the other ensembles, the Tychem-F has a very low value of the moisture permeability index 0.03. Moreover, Table 1. shows that although Tychem-F and FOP have a very close value of (FOP 1.08 clo and Tychem-F 1.06 clo), the value of for these two clothing differs even by an order of magnitude (Tychem-F 0.03 and FOP 0.34). As was mentioned, the index is more related to the permeability of the clothing than to the thermal insulation itself and for the impermeable clothing is close to zero, based on this fact the protective clothing Tychem-F is classified as impermeable.
Another fact contributing to the increased error in rectal temperature prediction for the Tychem-F suit can be the question of water vapor partial pressure under clothing, as the value of is closely connected with this parameter. The PHS index is validated for a maximum of 4.5 kPa in partial vapor pressure, what is the saturation pressure at the temperature corresponding to 31 °C. However, the test cases for Tychem-F were carried out in ambient temperature 30 °C and 40 °C, which indicates that at least in the latter case (ambient temperature 40 °C) the temperature under suit was higher than 31 °C.
Thus, the results indicate that the additional development of the PHS index is necessary in order to simulate the heat stress more precisely for the impermeable clothing with a low value of the .
5. Conclusions
The aim of this paper was to compare the simulation model Predicted Heat Strain (PHS) and Fiala-based thermophysiological model (FMTK) against experimental data for three types of ensembles: Klimatex underwear, air-permeable military NBC suit M2000 (FOP), and impermeable chemical protective clothing Tychem-F. The analysis focused on the clothing factors which affect the accuracy of the prediction of both models. Results showed that the simpler PHS index is well usable for normal clothing under various ambient temperatures and it is able to give satisfactory results similar to FMTK model and experiments. For protective clothing (FOP, Tychem-F), the accuracy of the prediction results did not strongly depend on the value of the Icl, whose value is similar for these two suits, but mostly on the value of the moisture permeability index which is connected with the water vapor partial pressure under the clothing. For lower values of (impermeable suit Tychem-F), the PHS index gave an unrealistic prediction of the rectal temperature (overestimated). It may pose a problem in situations where impermeable protective clothing is demanded while performing work tasks and when the prediction of the rectal temperature is used as the stop criterion. In such cases, the predicted time of allowable work time is very underestimated, and it may lead to increased time consumption in vain due to ordered safety break time to prevent overheating during planned individual tasks.
In conclusion, the PHS index showed limitations of use for protective clothing with a low value of moisture permeability index (impermeable suits). On the other hand, although the PHS index is simpler in comparison with the FMTK model, it was able to predict the rectal temperature for air-permeable protective suits with sufficient accuracy. A more complex physiological model FMTK predicted the response of rectal temperature with sufficient accuracy for all three types of ensembles, but it is necessary to consider its higher computational complexity compared to the PHS index.
The study will continue in two steps, firstly with a detailed sensitivity study of the PHS index, followed by verification of the theory presented in this article (influence of the value on the accuracy of rectal temperature prediction using the PHS index) on a higher sample of human subjects and with more various samples of protective clothing.
References
-
Havenith G., Fiala D. Vibrations thermal indices and thermophysiological modeling for heat stress of shells and plates. Compehensive Physiology, Vol. 6, Issue 1, 2016, p. 255-302.
-
Foda E., Almesri I., Awbi B. H., Sirén K. Models of human thermoregulation and the prediction of local and overall thermal sensations. Building and Environment, Vol. 46, Issue 40, 2011, p. 2023-2032.
-
Huizenga Ch., Hui Z., Arens E. A model of human physiology and comfort for assessing complex thermal environments. Building and Environment, Vol. 36, Issue 6, 2001, p. 691-699.
-
Foda E., Siren K. A new approach using the Pierce two-node model for different body parts. International Journal of Biometeorology, Vol. 55, Issue 4, 2011, p. 519-532.
-
Bröde P., Fiala D., Lemke B., Kjellstrom T. Estimated work ability in warm outdoor environments depends on the chosen heat. International Journal of Biometeorology, Vol. 62, Issue 3, 2018, p. 331-345.
-
SN ISO 7243: Hot Environments – Estimation of the Heat Stress on Working Man, Based on the WGBT Index (Wet Bulb Globe Temperature), 1993.
-
Malchaire J. Ergonomics of the Thermal Environment – Analytical Determination and Interpretation of Heat Stress Using Calculation of the Predicted Heat Strain, 2004.
-
UTCI COST 730. UTCI-Universal Thermal Climate Index, http://www.utci.org/.
-
Lundgren-Kownacki K., Martinez N., Johansson B., Psikuta A., Annaheim S., Kuklane K. Human responses in heat - comparison of the Predicted Heat Strain and the Fiala multi-node model for a case of intermittent work. Journal of Thermal Biology, Vol. 70, 2017, p. 45-52.
-
Koelblen B., Psikuta A., Bogdan A., Annaheim S., Rossi R. M. Thermal sensation models: Validation and sensitivity towards thermo-physiological parameters. Building and Environment, Vol. 130, 2018, p. 200-211.
-
Pokorný J., Fišer J., Fojtlín M., Kopečková B., Toma R., Slabotínský J., Jícha M. Verification of Fiala-based human thermophysiological model and its application to protective clothing under high metabolic rates. Building and Environment, Vol. 126, 2017, p. 13-26.
-
Kopečková B., Pokorný J., Jícha M. Study of the individualization of the passive system Fiala‐based human thermophysiological model. 12th International Manikin and Modelling Meeting, 2018.
-
Slabotínský J., Lunerová K. Physiological Stress of Man at Work in Protective Clothing in a Contaminated Environment. 1st edition, Association of Fire and Safety Engineering, Ostrava, 2017.
-
Fojtlín M., Psikuta A., Fišer J., Pokorný J., Toma R., Annaheim S., Jícha M., Rossi R. M. Thermal model of an unconditioned, heated and ventilated seat to predict human thermophysiological response and local thermal sensation. Building and Environment, Vol. 169, 2020, p. 106571.
Cited by
About this article

This work was supported by the project „Modern Methods of Detection and Identification of Dangerous CBRN Agents and Materials and Their Decontamination, and Modern Means for Personal Protection” No. VH 20182021036 covered by Safety Research Programme of the Czech Republic. The authors thank to colleagues from the Laboratory for monitoring of persons in extreme climatic conditions, National Institute for NBC protection, Kamenna, Czech Republic for cooperation in real experiments.
