Abstract
NPP (Neighborhood Preserving Projections) is an incremental subspace learning methods which has a nature of maintaining the data local neighborhood geometry constant. To improve the discriminatory power of NPP, NPD (Neighborhood Preserving Discrimination) algorithm was proposed to be used for the rotor system fault data set feature dimensionality reduction. Floyd algorithm based on graph theory and MMC (Maximum Margin Criterion) were introduced in the NPP which makes NPD avoid the short-circuit problem that occurs in the high curvature high dimensional space data sets, while enhancing data discrimination information during the dimensionality reduction. In addition, NPD can maintain the manifold of data set unchanged. At last, the rotor-bearing experiment has been made to verify the effectiveness of the NPD method.
1. Introduction
There are significant differences between the data dimensionality reduction techniques used to describe data characteristics and those used for discriminative classification. The former aims to minimize information loss before and after dimensionality reduction. For example, the PCA tries to find a linear projection direction that can best represent the original data structure [1]. The direction matrix is composed of m orthogonal directions that can have as much data variance as possible, and some important discrimination information may be ignored [2, 3]. Considering that the dimensionality reduction method used to describe the characteristics of the data does not reveal the category information suitable for classification, discriminant analysis emphasizes the following problems [4]: Given a two-category data set, find the optimal feature or feature set that can distinguish the two types of data . LDA and its improved version-Maximum Edge Criterion (MMC) belong to this type of method [5]. It tries to find a projection direction that can achieve the dual purposes of reducing the number of variables and extracting discriminant information, but its projection direction may not fully express the sample data. Internal structure. Different data types, or the same data type under different circumstances, will highlight different data information. Some data types contain relatively more global structure information, and some data types contain more discriminative classification information [6, 7]. Therefore, it is necessary to find a new method to make the discriminant information prominent under the premise of retaining the maximum data information before and after the dimensionality reduction, so as to facilitate the failure mode identification.
Neighborhood Preserving Projection (NPP) is an approximate incremental expression of the LLE algorithm. It is an incremental subspace learning meth-od to describe the characteristics of data and reduce the dimension. It has the property of keeping the local neighborhood geometry of the data unchanged. In order to improve the discrimination ability of NPP, this chapter proposes the NPD (Neighborhood Preserving Discrimination) algorithm, which is used to reduce the dimension of the fault feature data set of the rotor system. Introduced the Floyd and Maximum Spacing (MMC) criteria based on graph theory into NPP, which makes NPD avoid the short-circuit problem of high-dimensional space and high-curvature data set while enhancing the discriminative information of the reduced-dimensional data while maintaining manifold information. Finally, the method was validated with the data of a two-span rotor test bench.
2. Method of NPP
The NPP method solves the out-of-sample problem of the LLE (Local Linear Embedding) method, and approximates LLE through a linear transformation. The data set () is obtained through the projection matrix to obtain a low-dimensional feature data set (). The key step to implement this method is to solve the projection matrix that can maximize the characteristics of the original data set under the premise of the minimum reconstruction error before and after dimensionality reduction. The calculation formula is as follows:
where is the reconstruction weight coefficient matrix:
because , Eq. (1) can be changed to:
From Eqs. (1-3), the Lagrange extreme method is used to solve and simplify as Eq. (5):
According to Eq. (5), it can be known that the projection matrix is a generalized eigenvector of .
3. Derivation of NPD data dimension reduction formula
The basic idea of NPD is that if the linear transformation obtained by NPP satisfies Eq. (1) at the same time, the discriminability of the data will be greatly improved. This problem can be expressed as a multi-objective optimization problem:
Then translated into a Constrained Optimization Problem:
Using Lagrange multiplier method to solve this problem, we have:
Further derivation yields:
The projection matrix is ’s Eigenvector.
The calculation steps of this method are as follows:
Input: matrix , number of neighbor points , connection distance , low-dimensional embedding dimension ();
Output: low-dimensional matrix .
Step 1. Calculate the Euclidean distance ( 1, 2,…, , 1, 2,…, ) between the points in the matrix;
Step 2. Set the connection threshold , determine the weight of each point, calculate the distance from to the remaining points, and construct a weighting map;
Step 3. Using the Floyd search algorithm based on graph theory, select the first minimum distances as the neighborhood of points;
Step 4. Calculate the reconstruction weight matrix ;
Step 5. Calculate according;
Step 6. Calculate the projection matrix according to Eq. (13), .
4. Design of dimension reduction method for LLD fault feature dataset
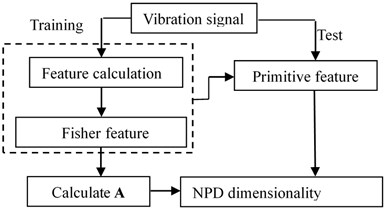
Based on the above analysis, the LLD dimension reduction process of the rotor system fault data set is shown in Fig. 1.
The implementation steps of this process are as follows:
Step 1. Collect vibration signals of typical faults of the rotor system, and divide them into training and test sets;
Step 2. Calculate the time and frequency domain characteristics of each data acquisition channel;
Step 3. Use the Fisher feature selection algorithm for the features of each data collection channel, arrange the obtained Fisher values in descending order and select the statistical features with larger values to form the original training feature data set;
Step 4. Use the NPD algorithm to reduce the dimensions of the original training feature data set to obtain the projection matrix ;
Step 5. Quantitatively extract the features of the test set according to the recorded best features of each channel, and use the formula for dimension reduction.
Fig. 1Dimension reduction flowchart of rotor system fault data set
5. Dimension reduction and classification of NPD fault feature dataset
5.1. Rotor system’s original fault characteristic data set construction
In order to verify the effectiveness of the NPD method, normal, inner fault, rolling fault and race fault experiments were performed on the test bench. The sampling frequency is 5000 Hz, and the vibration signals of the above four operating states of the bearing at 3000 r/min are collected. Select 13 frequency domain features, and 17 time domain features(mean, square root amplitude, standard deviation, variance, absolute mean, skewness, kurtosis, peak-to-peak, peak index, pulse index, margin index, waveform index, C factor, root mean square value, L factor, S factor, I factor), which are mean, square root amplitude, standard deviation, variance, absolute mean, skewness, kurtosis, peak-to-peak, peak index, pulse index, margin index, waveform index, C factor, root mean square value, L factor, S factor, I factor, a total of 30 statistical characteristics. Calculate the time-domain and frequency-domain eigenvalues of each channel separately (Table 3 is the calculation results).
For each state, 40 sample points are taken to form a 360×160 matrix . Feature selection is performed for each feature of , and the Fisher value of each feature is calculated separately. Each feature is arranged in descending order of Fisher value, and the first 100 features are taken as the original feature training set . According to the selected channel and statistical characteristics, the original feature space is constructed for the signals collected again. Each state takes 40 sample points to form a 100×160 matrix as the test set.
Table 1Original characteristic data set of rotor fault (Unit: mm)
Inner fault | Outer fault | |||||||||||
Feature | No. | X1 | X2 | … | X40 | … | X121 | X122 | … | X160 | ||
Ch1 | Time domain | T1 | 1 | 0.5529 | 0.6559 | … | 0.3382 | … | 0.8020 | 0.8743 | … | 1 |
… | … | … | … | … | … | … | … | … | … | … | ||
T17 | 17 | 0.2851 | 0.2708 | … | 0.2555 | … | 0.2675 | 0.2667 | … | 0.2655 | ||
Frequency domain | F1 | 18 | 0.0021 | 0.0000 | … | 0.0065 | … | 0.8620 | 0.7797 | … | 0.6921 | |
… | … | … | … | … | … | … | … | … | … | |||
F13 | 30 | 0.0089 | 0.0000 | … | 0.0183 | … | 0.8415 | 0.8341 | … | 0.7463 | ||
… | … | … | … | … | … | … | … | … | … | … | … | … |
Ch12 | Time domain | T1 | 331 | 0.8528 | 0.8562 | 0.6843 | 0.1540 | 0.0497 | 0.2138 | |||
… | … | … | … | … | … | … | … | … | … | … | ||
Frequency domain | … | … | … | … | … | … | … | … | … | … | … | |
F13 | 360 | 0.4805 | 0.3331 | … | 0.8458 | … | 0.1804 | 0.1237 | … | 0.1181 | ||
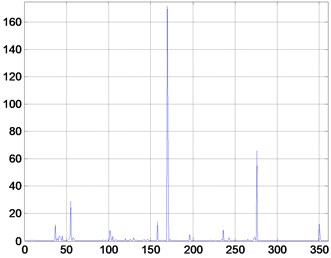
Fig. 2Fisher value for each feature
5.2. NPD dimension reduction of rotor system fault data set
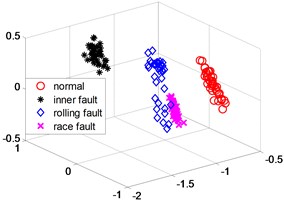
The NPD algorithm is implemented on the above matrix, and the calculation results are shown in Fig. 3.
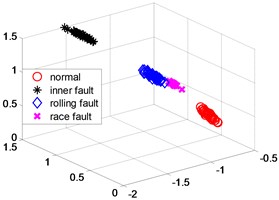
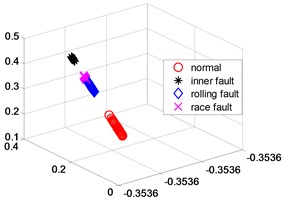
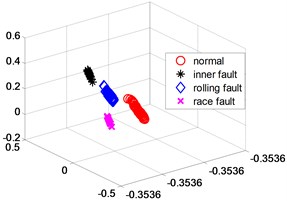
Fig. 3(a) is a three-dimensional scatter plot obtained by implementing the NPD algorithm. Record the channel numbers and statistical characteristics of the first 100 features, and calculate the test set according to the recorded channel numbers and statistical characteristics to form the original spatial high-dimensional data set of the test set. The low-dimensional embedding matrix can be obtained for this test set according to Step 5 in Section 4. Fig. 3(b) is a scatter plot of this matrix.
Fig. 3NPD dimensionality reduction scatter plot
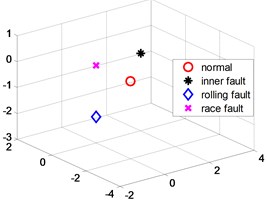
a) Training
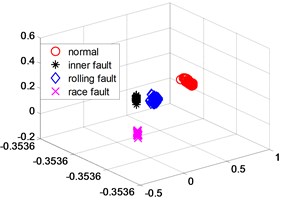
b) Test
Fig. 4KPCA dimensionality reduction scatter plot
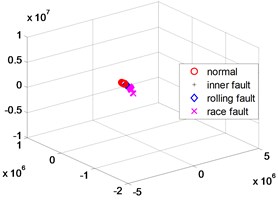
a) Training
b) Test
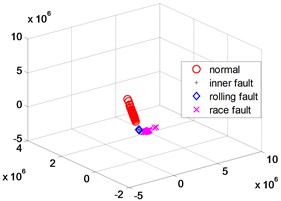
Fig. 5NPP dimensionality reduction scatter plot
a) Training
b) Test
Fig. 6LLD dimensionality reduction scatter plot
a) Training
b) Test
In order to further verify the dimensionality reduction effect of NPD, the classic KPCA, NPP and LLD algorithm was used to reduce the dimensionality of samples and test data sets, and a polynomial kernel function 5 was selected. Figs. 4-6 are three-dimensional scatter plot obtained by KPCA, NPP and LLD.
Table 2 is the statistical result of the inner distance in the low-dimensional feature component classes extracted by the NPP algorithm and KPCA, NPP and LLD method. It can be seen from the table that the features extracted by the NPP algorithm have smaller class inner distances.
Table 2Low-dimensional space inner distance (unit: mm)
Normal | Inner fault | Rolling fault | Race fault | |
NPD training | 1.1×10⁻² | 1.3×10⁻² | 1.1×10⁻² | 1.0×10⁻² |
KPCA training | 8.0 | 12.5 | 18.9 | 18.0 |
NPP training | 5.14×10⁻² | 5.03×10⁻⁴ | 1.42×10⁻³ | 1.68×10⁻³ |
LLD training | 1.84×10⁻³ | 5.98×10⁻⁴ | 1.81×10⁻³ | 3.28×10⁻³ |
NPD test | 1.3×10⁻² | 8.1×10⁻⁴ | 2.9×10⁻⁴ | 4.7×10⁻⁴ |
KPCA test | 1.5×10⁷ | 8.1×10⁶ | 1.2×10⁸ | 1.2×10⁷ |
NPP test | 7.01×10⁻² | 2.64×10⁻² | 2.08×10⁻² | 1.53×10⁻² |
LLD test | 2.91×10⁻² | 1.61×10⁻² | 9.31×10⁻² | 7.58×10⁻² |
6. Conclusions
The training and test sample set of the four running state sample points of the bearing, the class distance calculated by the NPD algorithm is much smaller than the result calculated by the KPCA algorithm. Compared with KPCA, NPP and LLD algorithm, the results calculated by NPD algorithm have better clustering. The analysis results show that the NPD algorithm after adding the NPP algorithm to the MMC criterion with discriminative performance can ensure that the discriminant information is extracted after dimensionality reduction, which is more conducive to the classifier’s fault pattern recognition.
References
-
Deepak Ranjan Nayak, Ratnakar Dash, Banshidhar Majhi An improved pathological brain detection system based on two-dimensional PCA and evolutionary extreme learning machine. Journal of Medical Systems, Vol. 42, Issue 19, 2018, p. 19-28.
-
Zhao Yue, You Xinge, Yu Shujian, Xu Chang, Tao Dacheng Multi-view manifold learning with locality alignment. Pattern Recognition, Vol. 78, Issue 2018, 2018, p. 154-166.
-
Zhang Yongli, Christoph Eick F. Tracking events in twitter by combining an lda-based approach and a density–contour clustering approach. International Journal of Semantic Computing, Vol. 13, Issue 1, 2019, p. 87-110.
-
Liu Jin, Pengren A., Ge Qianqian, Zhao Hang Gabor tensor based face recognition using the boosted nonparametric maximum margin criterion. Multimedia Tools and Applications, Vol. 7, Issue 17, 2018, p. 9055-9069.
-
Yu Xuelian, Wang Xuegang, Liu Benyong Supervised kernel neighborhood preserving projections for radar target recognition. Signal Processing, Vol. 88, Issue 19, 2018, p. 2335-2339.
-
Zou X., Liu Y., Zou L., Zheng Z. Improved discriminant sparseity preserving projecting face recognition algorithm. Huazhong Keji Daxue Xuebao (Ziran Kexue Ban)/Journal of Huazhong University of Science and Technology (Natural Science Edition), Vol. 46, Issue 11, 2018, p. 53-57.
-
Ma Jiayi, Jiang Junjun, Zhou Huabing, Zhao Ji, Guo Xiaojie Guided locality preserving feature matching for remote sensing image registration. IEEE Transactions on Geoscience and Remote Sensing, Vol. 56, Issue 8, 2018, p. 4435-4447.
About this article

This work is partially supported by Plateau Discipline Foundation Project of School of Mechanical Engineering, Shanghai Dianji University The authors also gratefully acknowledge the helpful comments and suggestions of the reviewers, which have improved the presentation.
