Abstract
The dewatering performance of geotubes is affected by the silt content of filling sand, which limits the construction speed of geotubes. In order to evaluate the effect of silt content of filling sand on the dewatering performance of geotubes, a series of hanging bag tests were carried-out by varying filling sand with five different silt content. In the tests, the variation of the water loss, soil loss and soil particles grading with time were studied. And the relationship between the silt content and the rate of water loss was analyzed. The research results show that the dewatering process could be divided into three stages, when the powder content is more than 20 %. Otherwise, the dewatering process only includes two stages. Three different bell-shaped function relationships exist between the percentage content of silt particles, median particle size and non-uniformity coefficient with the rate of water loss respectively. Furthermore, the different relationships were simplified into 3 different linear functions correspondingly. The research results could be used as a reference for geotubes engineering practice.
Highlights
- The effect of siltcontent on dewatering performance of geotubes was considered.
- A series of hanging bag tests were carried out by varying filling sand with five different silt content to evaluate the effect of silt content of filling sand on the dewatering performance of geotubes
- The dewatering process of hanging bags filled with different filling sand was explored.
- The effects of filling sand parameters including the percentage content of silt particles, non-uniformity coefficient and median particle sizeon dewatering rate was analyzed.
1. Introduction
Geotube dams began to be used in the 1950s. With the characteristics of high adaptability to soft foundation and local materials, fast construction speed and low cost, geotube dams have been widely used in the construction of estuarine and coastal engineering [1, 2]. Geotube dams are formed with the dewatered geotubes on both sides and the soil in the middle. According to the construction requirements, the construction of the geotube should be started after the consolidation degree of the geotube in the lower layer reaching about 70 % [3]. Therefore, the construction period of the geotube dams is closely related to the dewatering and consolidation rate of the geotubes. Hence, the research on dewatering and consolidation of geotubes has important significance to engineering practice of geotube dams.
Koerner et al. [4] proposed that the test results of the hanging bag dewatering test method could be used as the prediction performance index of the field test. The effect of the water content of the filling soil, the particle grading of the bag material on the geotubes dewatering performance was studied through hanging bag tests by Muthukumaran et al. [5]. Furthermore, Malik et al. [6] studied the influence of the filling sand density on the dewatering performance of the geotubes. With the results of the hanging bag tests, Weggel et al. [7-9] analyzed the dewatering process of the geotubes, and established the analytical model of geotubes dewatering.
However, there is a lack of sandy soil with low clay (silt) content and good permeability in many areas, such as the southeast coast of China and some inland areas. Filling sand with more fine particles, causing the slow dewatering and consolidation rate of geotubes, has become one of the key problems limiting the application of geotube dams in these areas. Hence, the research on the dewatering performance of geotubes filling with high clay content soil has gradually emerged.
Chang et al. [10] studied the influence of the clay particles content of the filling sand, the equivalent pore size of the geotextile, and the flapping disturbance to the geotubes on the dewatering efficiency through hanging bag tests. According to the test results, a construction method for efficient dewatering was proposed when the clay particles content of filling sand was high. And the dewatering effect of this method has been verified in the indoor geotube dewatering model tests [11]. Subsequently, Wu et al. [12] verified this method with field dewatering model tests on large-scale geotubes. The results showed similarly that the method could accelerate the geotubes dewatering.
The above studies are all conducted on the effect of clay particles that have the greatest impact on the dewatering and consolidation rate of geotubes. Conversely, there is very little research on the impact of silt particles on the dewatering rate. However, the silt content of soil in coastal area is relatively high. For example, the silt content in the soil in the coastal areas of China is as high as 60 %. Therefore, it is necessary to study the effect of silt content on the dewatering rate of geotubes.
In this paper, the hanging bag test method is used to investigate the dewatering characteristics of geotubes under different silt content. With the test results, the effect of the silt content of the filling soil on the dewatering rate of geotubes is clarified.
2. Materials and methods
2.1. Test material
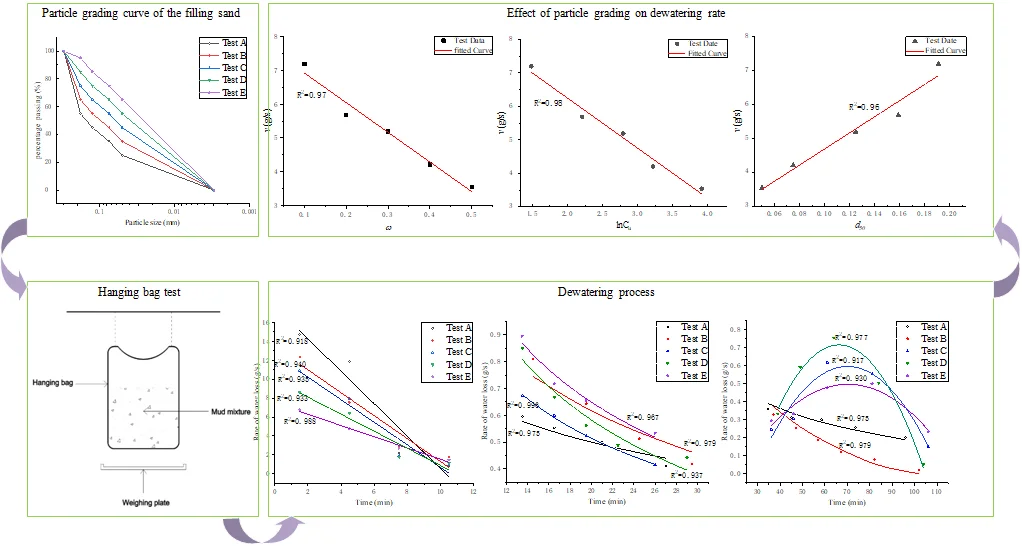
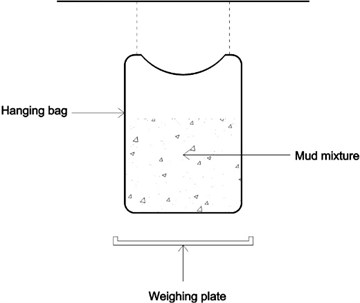
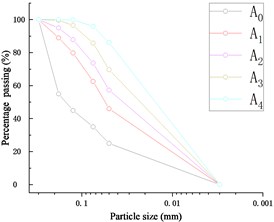
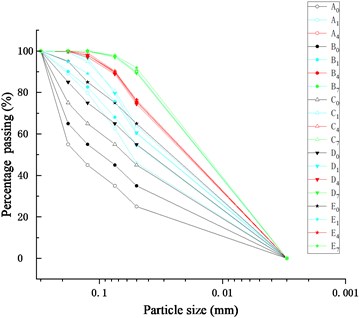
Five different filling sands were prepared by controlling the content of silt particles to be 10 %, 20 %, 30 %, 40 %, and 50 %. In order to reduce the influence of other particle size changes on the dewatering rate, only the maximum particles (particle size between 0.18-0.3 mm) content was adjusted with the change of silt content. The particle grading curve of filling sand in each test are shown in Fig. 1.
Fig. 1Particle grading curve of the filling sand
And the other parameters of filling sand are shown in Table 1.
Table 1ω, Cu and d50 in Test A~E
Test | Parameter | ||
Content of silt particles (%) | Non-uniformity coefficient | Median particle size | |
Test A | 10 | 4.4 | 0.191 |
Test B | 20 | 9.1 | 0.159 |
Test C | 30 | 16.4 | 0.125 |
Test D | 40 | 25.0 | 0.075 |
Test E | 50 | 50.0 | 0.050 |
The geotextile used for the hanging bag is commonly used for geotubes, with a surface density of 200 g/m2, a thickness of 1.7 mm, and an equivalent aperture of 0.3 mm.
2.2. Test scheme
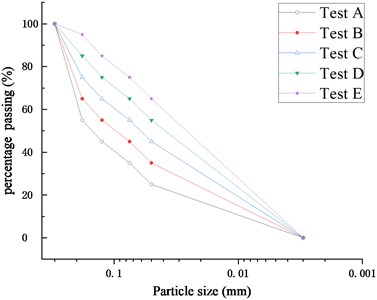
As shown in Fig. 2, a hanging bag is with a diameter of 30 cm and a height of 50 cm are sewn with geotextiles. When the mud mixture is poured into the hanging bag, water and some fine particles will seep out of the bag. And the weighing plate is placed under the bag to collect the water and fine particles from the hanging bag.
Fig. 2Hanging bag test
The process of hanging bag test could be summarized as follows. Firstly, 10 kg of soil and 10 kg of water were mixed into a mud mixture. Secondly, the mud mixture was poured into the hanging bag at a uniform speed. Thirdly, a weighing plate was placed under the hanging bag to receive exudate, and the weighing plate should be replaced and weighed at regular intervals until there was no liquid exudation coming out of the hanging bag. Finally, the received exudate at each interval was weighed again after drying. The mass of soil loss and water loss in each period of time could be analyzed according to the mass of exudate weighed before and after drying.
3. Results
3.1. Dewatering process
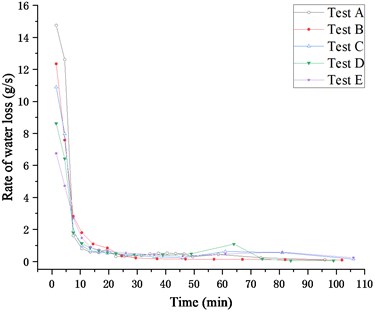
As shown in Fig. 3, the rate of water loss changes in each group of tests are basically the same. And they could be roughly divided into three stages including quick dewatering, slow dewatering, and rebounding dewatering.
Fig. 3Rate of water loss in Test A~E
In order to distinguish the three stages more clearly, the sections in Fig. 3 are cut out and enlarged respectively, wherein the rate of water loss within 0-12 minutes is shown in Fig. 4.
Fig. 4Rate of water loss in 0-12 min
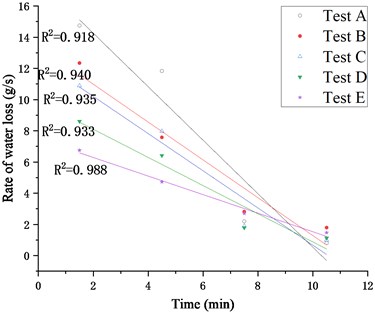
According to Fig. 4, in the first 12 minutes of the tests, the change trend of the rate of water loss in each group is almost the same. In this stage, the rate of water loss decreases linearly with time. And Eq. (1) which can describe this change trend is obtained through fitting:
Meanwhile, the parameters and in the formula of each test are shown in Table 2.
Table 2Parameter values of Eq. (1) in Test A~E
Test | ||
Test A | –1.716 | 17.692 |
Test B | –1.213 | 13.416 |
Test C | –1.193 | 12.597 |
Test D | –0.903 | 9.909 |
Test E | –0.595 | 7.483 |
The rates of water loss within 12-30 minutes in Test A~E are shown in Fig. 5.
Fig. 5Rate of water loss in 12-30 min
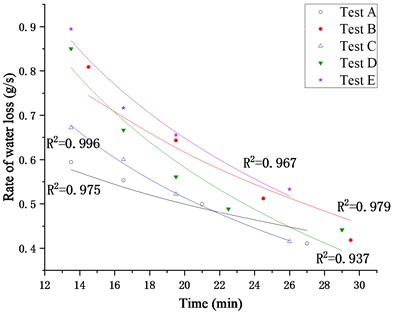
In this stage, the rate of water loss still decreases with time, but the rate of decline slows down. Similarly, Eq. (2) is used to describe this change trend through fitting:
And the parameters c and d in the formula of each test are shown in Table 3.
Table 3Parameter values of Eq. (2) in Test A~E
Test | ||
Test A | –0.198 | 1.093 |
Test B | –0.397 | 1.806 |
Test C | –0.397 | 1.707 |
Test D | –0.533 | 2.186 |
Test E | –0.530 | 2.242 |
The rate of water loss in the remaining stage is shown in Fig. 6. It can be clearly seen that the rates of water loss in Test C~E increase firstly and then decrease, while the rates in Test A and Test B only decrease continuously.
Fig. 6Rate of water loss in 30-110 min
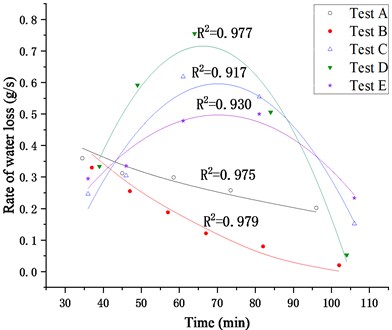
According to the fitting analysis of the rate of water loss in this stage, when the silt content less than 20 %, the relationship between the rate of water loss and the time still satisfies Eq. (2) obtained in the second stage. However, when the powder content is higher than 20 %, the relationship between the rate of water loss and the time becomes a quadratic function of Eq. (3):
And the parameters , and of this formula in Test C~E are shown in Table 4.
Table 4Parameter values of Eq. (3) in Test C~E
Test | (×10-5) | (×10-5) | |
Test C | –34.11 | 478.2 | –1.080 |
Test D | –48.06 | 637.0 | –1.395 |
Test E | –19.84 | 278.7 | –0.482 |
In order to analyze the rate of soil loss and particle grading of the seepage soil, the weighing pan under the hanging bag was changed every three minutes during the test. The seepage of soil lasted for 12 minutes in test A, and there were four groups of seepage soil time. The seepage of soil lasted for 21 minutes in Test B~E and there are seven groups of seepage soil in each.
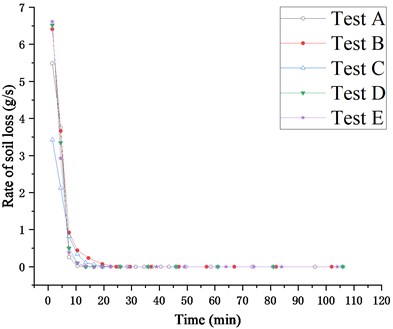
As shown in Fig. 7, the rate of soil loss changes in each group of tests are basically the same. All of them decrease linearly with time, and then the rate of decline slows down until no more soil seepage occurs. Although there is rebounding dewatering stage in the process of dewatering, there is no rebounding of the soil loss rate. This is because the peak value of the water loss rate in the rebounding stage does not exceed the value when the soil seepage stops.
Fig. 7Rate of soil loss in Test A~E
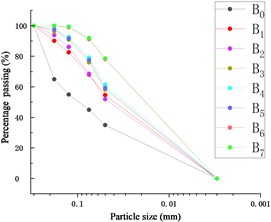
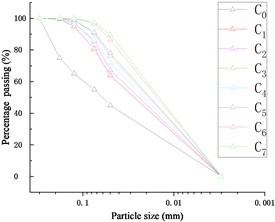
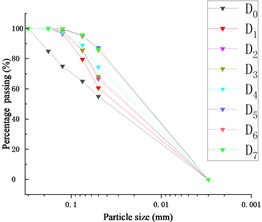
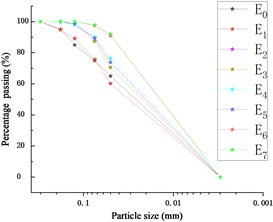
After the seepage soil dried, the grading of seepage soil was tested with a BT-9300H laser particle size distribution analyzer. As shown in Fig. 8, , , and respectively represent the grading of original soil grading in Test A, the first group (0-3 min) seepage soil grading in Test A and the first group (0-3 min) seepage soil in Test B. And the rest number codes could be introduced in the same way.
Fig. 8Particle grading curve of exuded soil in Test A~E
a) Test A
b) Test B
c) Test C
d) Test D
e) Test E
As shown in Fig. 8, the seepage soil of each test becomes finer as the dewatering process proceeds. The horizontal comparison of the seepage soil grading curve in the initial stage of the dewatering process (0-3 min), final phase of quick dewatering stage (9-12 min) and the stage of soil seepage to be completed (18-21 min) is shown in Fig. 9.
In the initial stage of the dewatering process, the particle grading of the seepage soil in each test is related to the original grading of the filling soil. The coarser the particle size of filling soil is, the coarser the particle size of seepage soil is. In final phase of quick dewatering stage, the particle grading of the seepage soil in each test is basically the same, which indicates that a similar infiltration structure is formed in the hanging bag in this stage. Therefore, even if the rate of water loss in each test is different, the particle grading of the seepage soil in the subsequent stages is basically the same.
Fig. 9Particle grading curve comparison of exuded soil in Test A~E
From the above, when the silt content of the filling soil exceeds 20 %, the dewatering process of the hanging bag can be divided into three stages including quick dewatering, slow dewatering, and rebounding dewatering.
I. Quick dewatering stage.
In this stage, the rate of water loss is fast, and it decreases linearly with time. The soil seepage during the dewatering process also mainly occurs at this stage. And in the final phase of this stage, a filter structure is formed in the hanging bag.
II. Slow dewatering stage.
In this stage, the rate of water loss slows down, and the relationship between the rate of water loss and time becomes a concave function. Meanwhile, the particle grading of the seepage soil is basically the same.
III. Rebounding dewatering stage.
During this stage, there is a phenomenon of the dewatering rebound. The rate of water loss rises and then falls. However, despite the rebounding of dewatering rate, soil seepage does not occur.
Therefore, the functional relationship between the rate of water loss and time is:
When the silt content is less than 20 %, there is no rebounding dewatering stage in the dewatering process. Hence, the functional relationship between the rate of water loss and time becomes:
3.2. Effect on dewatering rate
As shown in Fig. 3, the faster rate of water loss is concentrated in the quick dewatering stage. Therefore, the average rate of water loss in the quick dewatering stage could be used as an index to evaluate the rate of water loss. Furthermore, based on the analysis of the relationship between and its influence factors, including the percentage content of silt particles , the coefficient of nonuniformity , and the median particle size , the influence of each factor on the dewatering rate was studied. Firstly, Fig. 10 shows the variation of with in Test A~E.
Fig. 10Relationship between v and ω
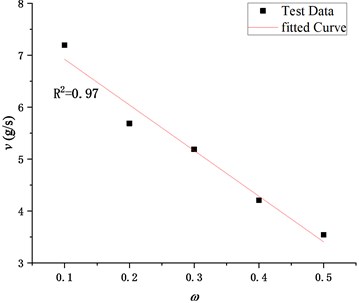
It can be seen from Fig. 10 that the average rate of water loss in the quick dewatering stage gradually decreases with the increase of the percentage content of silt particles, which indicates that the excessive content of the silt particles in the filling soil is not conducive to the dewatering of the hanging bag. In addition, the relationship curve between and is highly similar to the right half of a bell-shaped function curve. Considering that the bell function is complex, and the relationship between and is close to the linear relationship, the linear fitting is carried out, as shown in Eq. (6):
The determination coefficient of Eq. (6) is 0.97, which indicates that the formula is accurate when used to analyze the rate of water loss of the filling soil with a silt content of 10 %-50 %.
Through data pre-processing, it was found that the relationship between v and the logarithm of the non-uniformity coefficient also conformed to a bell-shaped function relationship, as shown in Fig. 11.
Fig. 11Relationship between v and lnCu
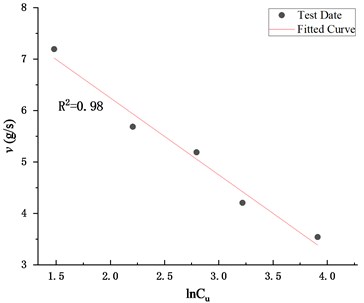
Similarly, the primary function is selected for fitting, and the Eq. (7) is obtained:
The determination coefficient of Eq. (7) is 0.98, which indicates that the formula could accurately reflect the relationship between and .
In addition, the variation of with in Test A~E is shown in Fig. 12.
Fig. 12Relationship between v and d50
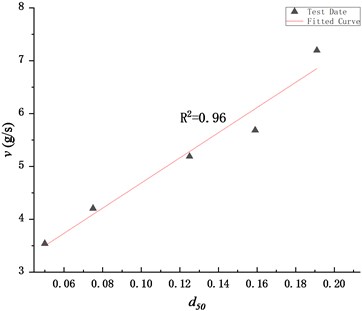
According to Fig. 12, the average rate of water loss has a positive linear relationship with the median particle size of the filling soil. After regression analysis, the Eq. (8) is obtained:
The determination coefficient of Eq. (8) is 0.97, indicating that the formula could be used to analyze the influence of the median particle size on the dewatering rate.
4. Conclusions
When the silt content of the filling soil exceeds 20 %, the dewatering process of the hanging bag can be divided into three stages including quick dewatering, slow dewatering and rebounding dewatering. And the functional relationship between the rate of water loss and time satisfies the Eq. (4). When the silt content is less than 20 %, the dewatering process only contains quick dewatering and slow dewatering two stages, excluding the rebounding dewatering stage. Meanwhile, Eq. (5) could be used to describe the relationship between the rate of water loss and time.
The loss of water and soil mainly occurs in the quick dewatering stage. After the filter structure is formed in the hanging bag, the dewatering process enters the slow dewatering stage from the quick dewatering stage. And in the rebounding dewatering stage, the rate of water loss rebounds without soil seeping.
The average rate of water loss in the quick dewatering stage could be used as an index to evaluate the dewatering rate of the hanging bag. The functional relationship between this average rate and the percentage content of silt particles, the non-uniformity coefficient and the median particle size of the filling soil is summarized by the Eq. (6), Eq. (7) and Eq. (8) respectively.
References
-
Shu Y. M. Engineering technology progress of geotube dams in China. Advances in Science and Technology of Water Resources, Vol. 38, 2018, p. 4-14, (in Chinese).
-
Man X. L., Shu Y. M., Yu C. L., et al. Effect of cyclic wave loading on scouring stability of geotube dams. Ocean Engineering, Vol. 152, 2018, p. 1-5, (in Chinese).
-
Wu H. M., Shu Y. M., Chang G. P., et al. High efficient dewatering technology of filling geotube with soil material containing high viscosity clay (silt). Advances in Science and Technology of Water Resources, Vol. 38, 2018, p. 19-27, (in Chinese).
-
Koerner G. R., Koerner R. M. Geotextile tube assessment using a hanging bag test. Geotextiles and Geomembranes, Vol. 24, 2006, p. 129-137.
-
Muthukumaran A. E., Iamparuthi K. Laboratory studies on geotextile filters as used in geotextile tube dewatering. Geotextiles and Geomembranes, Vol. 24, 2006, p. 210-219.
-
Malik J., Sysala S. Analysis of geosynthetic tubes filled with several liquids with different densities. Geotextiles and Geomembranes, Vol. 29, 2011, p. 249-256.
-
Weggel J. R., Dortch J., Gaffney D. Analysis of fluid discharge from a hanging geotextile bag. Geotextiles and Geomembranes, Vol. 29, 2011, p. 65-73.
-
Weggel J. R., Ward N. D. A model for filter cake formation on geotextiles: theory. Geotextiles and Geomembranes, Vol. 31, 2012, p. 51-61.
-
Weggel J. R., Dortch J. A model for filter cake formation on geotextiles: Experiments. Geotextiles and Geomembranes, Vol. 31, 2012, p. 62-68.
-
Chang G. P., Shu Y. M., Yin J. C., et al. Efficient dewatering method for filling geotube with high viscosity slurry. Science of Hydropower and Energy, Vol. 3, 2014, p. 129-133, (in Chinese).
-
Chang G. P., Wu X. N., Shu Y. M., et al. Experimental study of efficient consolidation drainage for tubes filling with soil material of fine particles. South-to-North Water Transfers and Water Science and Technology, Vol. 5, 2015, p. 901-904, (in Chinese).
-
Wu H. M., Shu Y. M., Chang G. P., et al. Field model test of high efficiency dewatering process of filling geotube with soil materials containing high viscosity clay (silt). Journal of Geotechnical Engineering, Vol. 38, 2016, p. 209-215, (in Chinese).
About this article

This research was funded by the Key Research Project of Natural Science in Colleges and Universities of Anhui Province (KJ2019A0640).
