Abstract
The torsional vibration of Harmonic reducer is concerned with the positioning accuracy and trajectory accuracy of industrial robots. A study on the parametric torsional vibration based on time-varying stiffness will improve the mechanical performance of Harmonic reducer. In this paper, the phenomenon of time-varying stiffness caused by manufacturing error is investigated on a Harmonic driver through mechanism analysis and experimental investigation. Meanwhile, a model of forced parametric vibration is set up for the Harmonic driver transmission system with an inertia load. The parametric vibration response is simulated by the Runge-Kutta method, and the issue of bi-spectra, combined harmonic group, and the envelope of system sweeping frequency response are analyzed in detail. The influence of double periodic time-varying stiffness on vibration is emphasized with simulation data. To observe the characteristic of parametric vibration in Harmonic driver, a test device has been developed for the measurement of torsional vibration. The dynamic characteristics can be confirmed through signal processing on torsional vibration. An engineering example is given to illustrate that the manufacturing defect can be on-line diagnosed in Harmonic driver by using the characteristic of bi-spectra. As a result, the magnitude of torsional vibration is eliminated to one half of the original case through the reassembly process, and one of the mechanical performances, i.e., the property of torsional vibration-speed, is improved obviously. The dynamic characteristics caused by time-varying stiffness, i.e., bi-spectra, can be used as a new clue of manufacturing quality assurance for Harmonic driver.
1. Introduction
The dynamic characteristics of a Harmonic driver are very important for a transmission system, and they directly affect the positioning accuracy and trajectory accuracy of an industrial robot.
To estimate the frequency response in the axial and radial direction, Cheong Yoo [1], In-Gyu Park [2] applied a force impulse to study the structural vibration of Harmonic driver in the static state. A model of nonlinear torsional vibration for Harmonic driver was set up by Tuttle T. D., [3], in which the transmission error, nonlinear stiffness, and friction were considered. The effect of these factors on the torsional vibration was investigated by simulation technology. Based on the effect of friction and hysteresis in the gear meshing, a FEM model of cylindrical shell was set up by Leniowski [4] to develop the variant of MRAC-type controllers for vibration cancellation. Lizhong Xu [5] presented a parametric radial vibration for Harmonic driver with electromechanical integration, and analyzed the nature frequency under considering the ring contacting with the stator and electromechanical coupling. Using the difference between the motor and load speeds, Hongbo Liao [6] introduced a feedback control to suppress the resonance of the harmonic gear train, and simulation results validated the control algorithm. Makoto Iwasaki [7] presented the vibration suppression approach for harmonic drive gearing with the aid of a variable notch filter. The study has been applied to motion control of an actual industrial 6-axis robot. In recent years [8-10], some experimental investigations on dynamic characteristics of Harmonic driver and RV reducer were extended to the area of fault diagnosis, and research work tried to improve the mechanical performance of industrial robot joint.
The less overlapping coefficient in the gear meshing will inevitably cause the time -varying stiffness that is related to the meshing frequency, which has been discussed in the majority literature [11-13]. Due to at least 1/4 teeth of flexible teeth meshed in the transmission of Harmonic driver, the phenomenon of less overlapping coefficient will not appear in the transmission of Harmonic driver. However, another factor is the manufacturing error [14] in the flex spline or fixed gear, and its action can also result in the time -varying stiffness. It can be not ignored in the dynamic analysis of Harmonic driver. So, the experimental investigation and theoretical modeling need to be carried out.
To study torsional vibration of a Harmonic driver based on time-varying stiffness caused by manufacturing error, the content of the manuscript is arranged as follows: (1) investigate the mechanism of time-varying torsional stiffness caused by the manufacturing error in the flex spline or fixed gear in the transmission of Harmonic driver; (2) set up a dynamic model for Harmonic driver transmission; (3) analyze the dynamic phenomenon of parametric vibration with double parameters; (4) develop a torsional vibration test rig for a Harmonic driver with an inertia load; (5) confirm the dynamic characteristics on signal processing; (6) eliminate torsional vibration of a Harmonic driver through the improvement of the torsional stiffness.
2. Time-varying torsional stiffness
Torsional stiffness is one of the important mechanical performance for Harmonic driver, and it can be expressed as a differential of torque to rotation angle:
where is torsional stiffness (unit: N⋅m/rad), torque (unit: N⋅m), rotation angle (unit:).
The ideal state of Harmonic driver possesses a property of constant torsional stiffness, it assures the excellent performance of mechanical transmission. But, the fluctuation will be induced in the torsional stiffness by several factors, such as design, manufacturing and assembly problems. In this manuscript, we will focus on the stiffness fluctuation caused by manufacturing error.
2.1. Mechanism of time-varying torsional stiffness
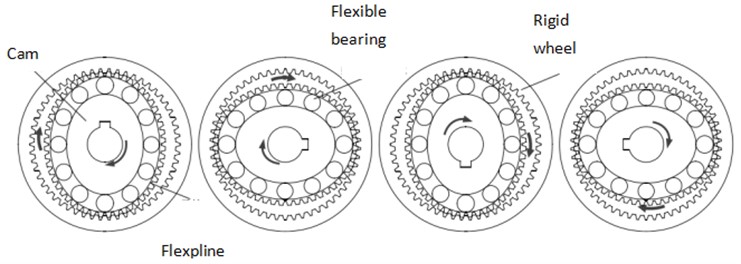
As shown in Fig. 1, the numbers of fixed rigid gear teeth are 2 more than that of flex spline teeth in a Harmonic driver. If the camshaft drives the flex spline to rotate and move, the flex spline will mesh with the rigid gear. Based on meshing engagement between a flex spline and a rigid gear, we study a phenomenon of time-varying torsional stiffness in the output end of a Harmonic driver when it is driven by a camshaft.
Fig. 1Transmission principle of Harmonic driver
If the flex spline meshes with the rigid gear on the verge of the position of A-A’ as shown in Fig. 2, the regular teeth deforming will be very small under the ideal meshing state.
It is inevitable that an accumulated error is reflected in a flex spline and a rigid gear because a geometric eccentricity exists in a workpiece during the manufacturing process. That will change the state of regular teeth deforming in the meshing process.
Fig. 2Sketch of meshing engagement between flex spline and rigid gear
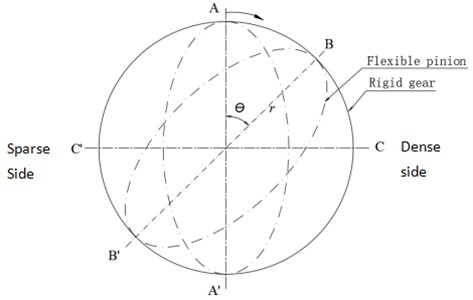
Case 1: Assume that a flex spline is in the ideal state, i.e., no accumulated error in its teeth; only a fixed rigid gear brings with the accumulated error.
As shown in Fig. 2, let the left side teeth of rigid gear be sparse a little and the right side teeth of rigid gear be dense a little. Due to the difference among the circular pitches, the phenomenon of interference (part of dot line) will happen among the meshing teeth, as shown in Fig. 3. It will result in the extra elastic deforming in both teeth when they mesh with each other. Thus, the camshaft drives from the position A-A’ to the position of B-B’, besides for the regular teeth deforming, extra teeth deforming will be added because of the teeth interference, and the extra elastic energy is stored. The extra elastic deforming will attain the maximum value in the position of C-C’. When the camshaft rotates continuously and the flex spline meshes with the rigid gear in the position of A’-A, the extra elastic deforming will be clear away or the extra elastic energy will be released, and only the regular deforming will be kept.
If the camshaft drives one cycle, the extra elastic deforming will vary two times. For the given rotating angle, the extra elastic deforming need an extra torque force imposed on a driving shaft. Based on Eq. (1), the torsional stiffness will change as the camshaft driving, and it varies in the position periodicity. When the camshaft rotates one cycle, the torsional stiffness will fluctuate two times.
Fig. 3Meshing interference status in the position of B-B’
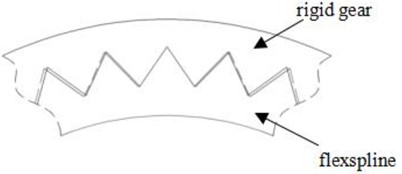
a) Meshing in B point with sparse teeth in a rigid gear
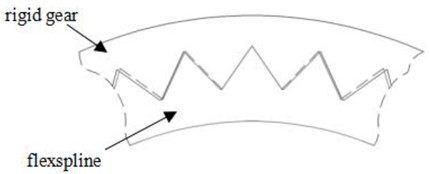
b) Meshing in B’ point with dense teeth in a rigid gear
Case 2: Assume that the accumulated error or eccentricity occurs in a flex spline, and a fixed rigid gear is in the ideal state.
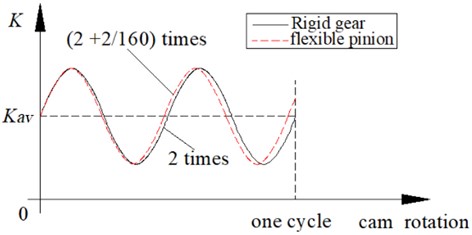
The torsional stiffness also varies in the position periodicity when the camshaft drives one cycle. However, the periodicity of torsional stiffness is slightly different from Case 1, and it will be two times and two teeth correspond to the camshaft driving cycle. The difference in stiffness varying periodicity is schematically described in Fig. 4.
In fact, two situations will exist in the meshing process simultaneously, which makes the time-varying torsional stiffness complicated.
Fig. 4Sketch of periodic time-varying torsional stiffness (flex spline z1 = 160, rigid gear z2 = 162)
2.2. Experimental data
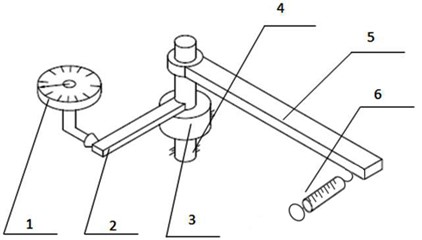
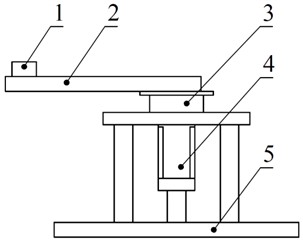
To confirm the phenomenon of stiffness varying, a measuring device of static torsional stiffness is set up for several Harmonic drivers. As shown in Fig. 5, it is a picture of test bed for measuring torsional stiffness on a Harmonic driver, where 3 is a Harmonic driver, the camshaft 4 is fixed at the initial position, and the force is imposed on the force rod 5 in the output of the Harmonic driver. The imposed force and the displacement of rod 2 end are recorded with a force gauge 6 and a dial indicator 1, and they are transferred into the corresponding torsion and rotating angle based on geometry size of rod 2 and rod 5.
The 1st measurement has been carried out, and the torsional stiffness is estimated from the measured value. After that, the camshaft rotates to 30 degrees and it stops again. Then, the 2nd measurement of torsional stiffness goes on. Such measurement is carried out once every 30 degrees. Measurement position of static torsional stiffness in the output of Harmonic driver is shown in Fig. 6.
Fig. 5Static torsional stiffness measuring rig: 1 – dial indicator, 2 – output rod, 3 – harmonic driver, 4 – camshaft, 5 – force rod, 6 – force gauge
a) Principle of static torsional stiffness measurement
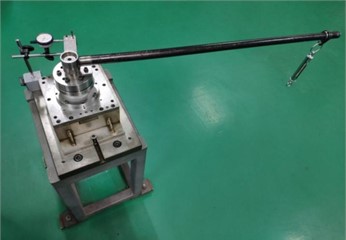
b) Picture of static torsional stiffness measuring rig
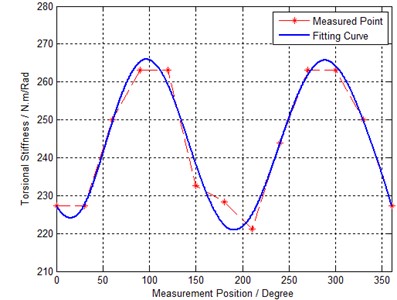
Fig. 7 presents a measured result of a model ZKSHG-20-80 Harmonic driver on 40 N⋅m loading, where the dotted line with “*” is the experimental data and the real line is the fitting curve. The torsional stiffness fluctuates in the position periodicity. When the Harmonic driver rotates at a constant speed, the torsional stiffness of Harmonic driver can be seen as the time-dependent periodicity.
From the experimental data, the index of torsional stiffness fluctuation of Harmonic driver is estimated by , where 243.5 N⋅m/rad is an average value of torsional stiffness; is a fluctuation value of torsional stiffness.
Fig. 6Camshaft position when the torsional stiffness measured
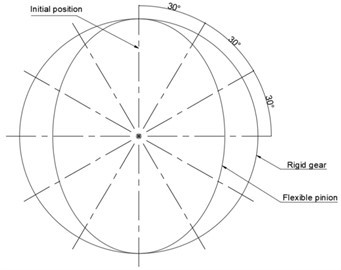
Fig. 7Experimental data of torsional stiffness varying with rotating position (while torque M= 40 N⋅m)
3. Parametric torsional vibration
3.1. Parametric vibration
Based on the experimental data in Fig. 7, the time-varying torsional stiffness can be divided into average torsional stiffness and the torsional stiffness fluctuation. Meanwhile, the high order harmonic fluctuations are considered. Thus, the time-varying torsional stiffness can be simply written as follows:
where is an average torsional stiffness, and indexes of stiffness fluctuation, and foundational fluctuation frequencies in the flex spline and fixed rigid gear.
A Harmonic driver is driven by a servo motor, and it usually loaded by a moment of inertia in the output end. So, the motion equation for a Harmonic driver transmission system can be mathematically described as:
where is a moment of inertia, damping coefficient, oscillation response, the exciting torque.
External excitation torque includes a driving torque , a camshaft drive torque fluctuation , and a load torque fluctuation , which can be described as:
where the camshaft driving torque fluctuation frequency is 2 times of motor driving frequency; is the load torque fluctuation frequency.
3.2. Bi-spectra
Based on the model of parametric vibration listed in Eq. (3), considering small damp, time-varying stiffness, and external excitation, the steady-state vibration is simulated by the Runge-Kutta method. In the computation, the dynamic parameters are set:
– the natural frequency , 55 Hz;
– the damping ratio 0.023;
– the fluctuation frequency caused by a flex spline × 25.3125 rad/s;
– the fluctuation frequency caused by a rigid gear 2 × 25 rad/s;
– the driving torque 10 N⋅m;
– the camshaft drive torque fluctuation 0;
– the load torque fluctuation 0;
– the indexes of stiffness fluctuation listed in Table 1.
Table 1Index value of stiffness fluctuation
Index | |||
Value | 0.05 | 0.03 | 0.02 |
Index | |||
Value | 0.06 | 0.04 | 0.02 |
The spectrum of forced parametric vibration is shown in Fig. 8, where several bi-spectra can be observed. Due to the characteristic frequencies of the rigid gear and flex spline are very close, it can be clearly observed through zoom spectrum technology or spectrum estimation with longer time record.
Frequency resolution of the bi-spectra line is estimated by:
where is the driving speed.
The dominant reason of left peak in bi-spectra is caused by the manufacturing defect of fixed rigid gear (including cam or driving shaft), and the right peak of bi-spectra reflects the manufacturing defect of a flex spline.
The bi-spectra is a special characteristic to identify the manufacture defect for a Harmonic driver, and it is different from the characteristics of other mechanical components. It can be used as a key characteristic to monitor the health condition of Harmonic driver.
3.3. Combined harmonic group
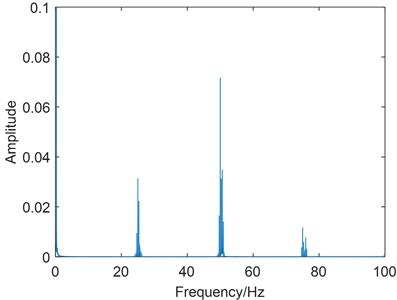
If the load torque fluctuation is considered in a Harmonic driver, for example, the amplitude and frequency of are 5 N⋅m and 0.3125 rad/s, the phenomenon of combined harmonic group will appear in the vibration spectrum.
As shown in Fig. 9, the first combined harmonic group contains , , and , and the second combined harmonic group contains , , and .
Fig. 8The bi-spectra in the spectrum of forced parametric vibration
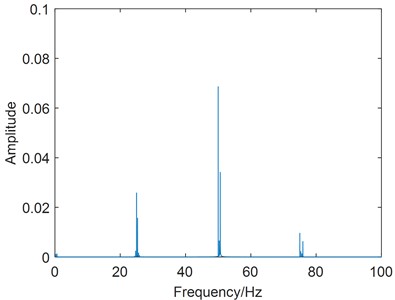
Fig. 9The combined harmonic group in the spectrum of forced parametric vibration
3.4. Sweeping frequency response
To illustrate the effect of double time-varying stiffness fluctuation on the response stability, only consider the case of 0.14 and 0.10 in the vibration response simulation. Using the technology of sweeping frequency, the time history of vibration response is obtained, and the envelope of vibration response is estimated. Through analysis of the response of sweeping frequency, the nonlinear characteristics of Harmonic driver can be explored.
3.4.1. Single time-varying stiffness
Fig. 10(a) is the envelope of vibration response in the case of single time-varying stiffness, i.e., 0 and 0.023. There are three convex peaks in the frequency range of 0-120 Hz, which are corresponding to principal instability, resonance, and 1/2 harmonic resonance, respectively. The convex peak value of principal instability is below 1.
Fig. 10Response envelope of a parametric system with single time-varying stiffness (the case of β11= 0.14 and β21= 0)
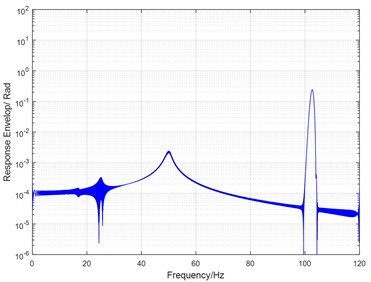
a) 0.023
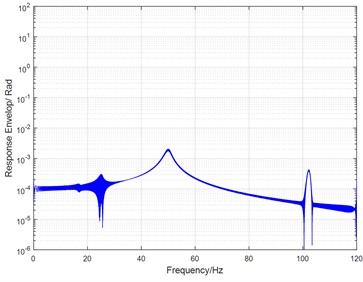
b) 0.027
If the damp ratio is raised to 0.027 in the above case, the convex peak value of principal instability will be reduced under 1e-3, as shown in Fig. 10(b), and the magnitude of frequency response is very sensitive to damp ratio varying.
3.4.2. Double time-varying stiffness
However, if the double time-varying stiffness is involved in the parametric vibration, the convex peak value of principal instability will exceed 1e1, and the frequency response will be rapidly raised. As shown in Fig. 11(a), the strength of vibration is greatly sensitive to double time-varying stiffness variation. It means that the torsional vibration will become much stronger under the coupling action of the manufacturing defects in the flex spline and rigid gear.
Fig. 11Response envelope of a parametric system with double time-varying stiffness (the case of β11= 0.14 and β21= 0.10)
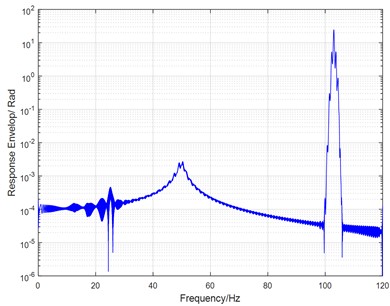
a) 0.023
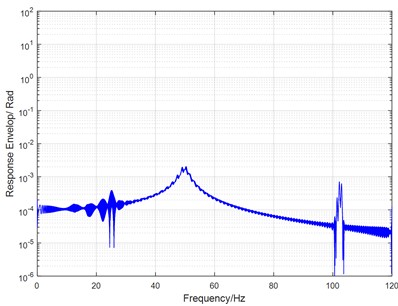
b) 0.027
4. Test rig
To verify the dynamic characteristics of parametric vibration in Harmonic driver, a test rig is set up for the measurement of torsional vibration. Fig. 12 shows a torsional vibration experimental device for Harmonic driver, which includes a model SHG-20-80 Harmonic driver (a flex spline with 160 teeth, a rigid gear with 162 teeth), frame, a model MHMJ082G1U motor, and 0.29 kgm2 moment of inertia.
Fig. 12Torsional test for Harmonic driver: 1 – wireless vibration sensor, 2 – asymmetric moment of inertia, 3 – harmonic driver, 4 – servo motor, 5 – bases
a) Sketch of a harmonic driver test device
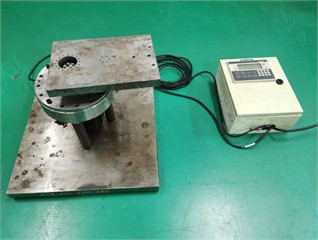
b) Picture of a harmonic driver test device
The vibration detection is carried out by MTE-T8 wireless vibration sensor which is located 0.55 m away from the rotating center. When the servo motor drives the Harmonic driver, the circumferential vibration is picked up by the sensor, and it is used as a measure of the torsional vibration in the transmission system. But, its unit is still kept as (9.8 m/s2). After the vibration signal is collected in a chip of sensor, it is remotely sent to a computer for signal processing.
5. Vibration analysis
Several Harmonic drivers with double rigid gears are involved in the test of torsional vibration. The time record samples of torsional vibration are collected, and some typical characteristics of parametric vibration can be illustrated.
Fig. 13Torsional vibration in a Harmonic driver at a speed of 850 rpm
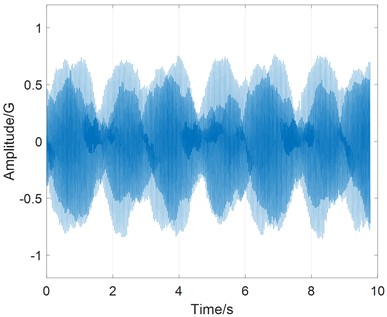
a) Time history of torsional vibration
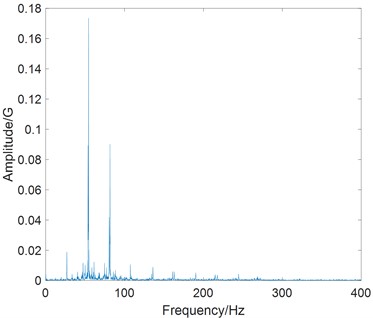
b) Spectrum of torsional vibration
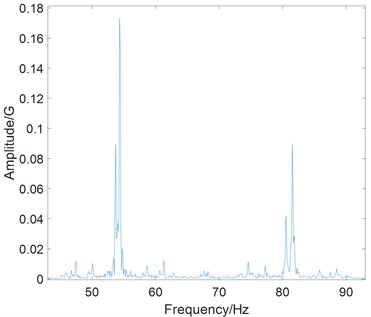
c) Zoom spectrum
Fig. 13(a) shows the time history of torsional vibration of Harmonic driver at speed of 850 rpm. It is obvious that a phenomenon of beat appears in the vibration record, and it is caused by small frequency difference between spectra lines, i.e., bi-spectra.
As shown in Fig. 13(b), several bi-spectra distribute in the vibration spectrum. The bi-spectra characteristics can be seen through zoom technology in Fig. 13(c). The right peak of bi-spectra is higher than the left one. It means that the manufacturing defect of flex spline is a dominant vibration source.
When the manufacturing defects and load fluctuation exist in a Harmonic driver simultaneously, the combined harmonic group, , would appear in the zoom spectrum.
As shown in Fig. 14, it gives the case of combined harmonic group in the zoom spectrum, where 2×16.88, ×17.01, 2×16.76, and 2×17.19 can be clearly seen. This particular phenomenon can be occasionally observed in the Harmonic driver with asymmetric moment of inertia.
From vibration tests on the Harmonic driver, the phenomenon of harmonic resonance is also observed in the vibration spectrum. Fig. 13(b) and Fig. 15 show the results of harmonic resonance, and they are corresponding to a driving speed of 850 rpm and 1700 rpm, respectively. The dominant components correspond to in Fig. 13(b) and in Fig. 15, and they are approximately 54 Hz. All dominant components are closed to the resonance frequency of the tested Harmonic driver.
The vibration test is carried out at the driving speed of 200~3000 rpm with a step of 100 rpm. The RMS values of vibration acceleration are summarized as shown in Fig. 16, where the property curve of torsional vibration-speed can be used to evaluate the dynamic mechanical performance of the Harmonic driver.
It can be seen that three convex peaks exist in the curve, and they reflect the area of instability, resonance, and 1/2 harmonic resonance in the tested Harmonic driver. Obviously, the outline of property curve is consistent with the envelope of simulated response in Fig. 10(b) or Fig. 11(b).
Fig. 14Phenomenon of Combined harmonic group in torsional vibration in a Harmonic driver
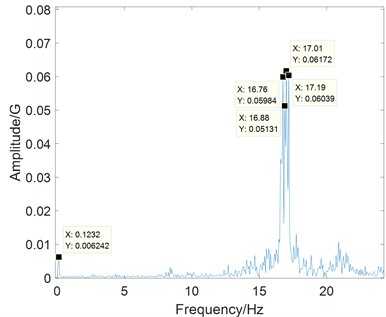
Fig. 15Spectrum of combination harmonic resonance at speed of 1700 rpm
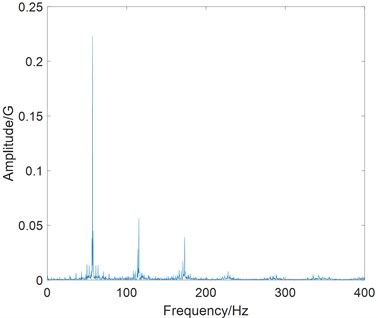
Fig. 16Property of torsional vibration-speed
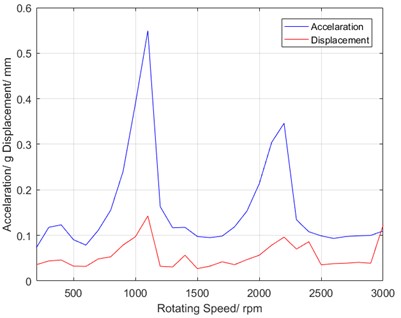
Fig. 17Phase trace at the speed of 850 rpm
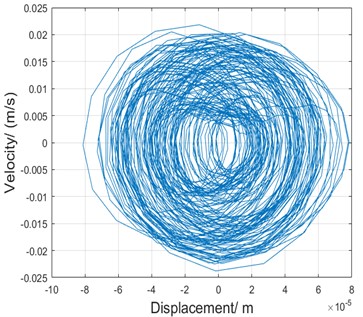
The wave of vibration displacement and vibration velocity can be used to construct a map of phase space, where the nonlinear dynamic characteristic of parametric vibration can be found in the torsional vibration of Harmonic driver.
Fig. 17 shows the phase trace of the torsional vibration at the speed of 850 rpm. Obviously, its trace is of quasi periodicity, and it matches one of nonlinear characteristics in the parametric vibration.
6. Application
Applying the characteristics of bi-spectra, the dominant manufacturing defects in the flex spline or fixed gear can be identified, and they can be eliminated through a reassembly process of Harmonic driver. As a result, the quality of products is improved and quality assurance is realized.
A test on torsional vibration is carried out in one sample of Harmonic driver with double rigid gears. The property of torsional vibration-speed is obtained on signal processing, as shown in Fig. 18(a). The maximum convex peak can be seen at the speed of 1300 rpm in the measured property curve.
Fig. 18Property curve of torsional vibration-speed
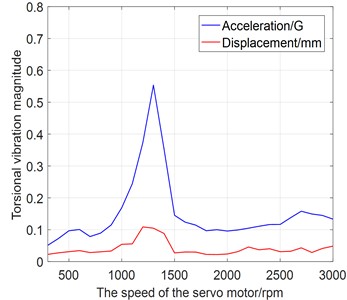
a) Original case
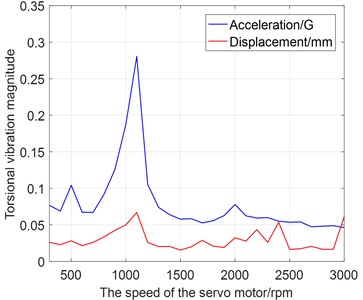
b) After change of fixed rigid gear
Fig. 19Teeth error in rigid gear measured with Zeiss instrument
a) Original fixed rigid gear
b) New fixed rigid gear
Then, the spectrum is done on the time record of torsional vibration at speed of 1300 rpm.
The dominant characteristic locates at the left peak of bi-spectra is found, and the defect source is diagnosed as the fixed rigid gear.
After measuring the size of mechanical parts with the Zeiss instrument, it is confirmed that accumulated error is beyond the manufacture tolerance in the fixed rigid gear, as shown in Fig. 19(a). Through the exchange of fixed rigid gear in the Harmonic driver, the property of torsional vibration-speed is successfully improved, and the dominant convex peak is reduced to one half of the original one (see Fig. 18(b)).
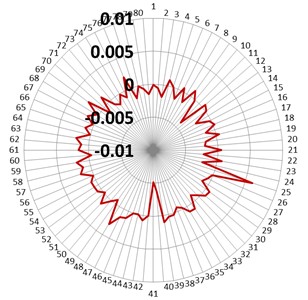
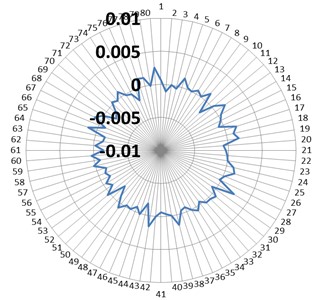
For the Harmonic driver with a new fixed rigid gear, the fluctuation of torsional stiffness has been also measured, and its value is half of original case, as shown in Fig. 20.
Fig. 20Fluctuation of torsional stiffness (40 Nm) in the tested sample of Harmonic driver
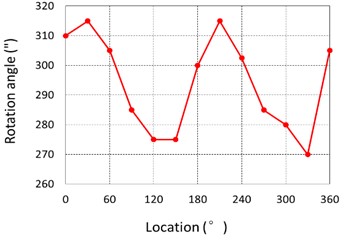
a) Original fixed rigid gear
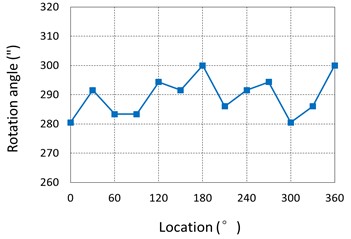
b) New fixed rigid gear
7. Conclusions
The phenomenon of time-varying torsional stiffness caused by manufacturing error has been proved according to experimental data of several Harmonic drivers. The stiffness fluctuation frequency, , is caused by the fixed rigid gear, and the stiffness fluctuation frequency, , is caused by the flex spline. The time-varying torsional stiffness will give rise to parametric vibration. The bi-spectra is presented as the dominant characteristic of torsional vibration. The dominant reason of left peak in bi-spectra corresponds to the manufacturing defect of rigid gear, and the right peak of bi-spectra reflects the manufacturing defect of flex spline.
The envelope of parametric vibration response generated by sweeping frequency is matched with the property of torsional vibration-speed in Harmonic driver. It is noted that the time-vary stiffness with double periodicity will induce a very strong torsional vibration because of coupling action.
Applying the dominant characteristic of bi-spectra in the zoom spectrum, the manufacturing defect can be easily diagnosed in Harmonic driver, and it can be excluded by exchanging the mechanical parts. As a result, the magnitude of torsional vibration is reduced, and the property of torsional vibration-speed is improved obviously. The effectiveness of characteristic identification is verified by the given example. Therefore, the study on torsional vibration on time-varying stiffness can improve the mechanical performance of Harmonic driver.
References
-
Yoo C., et al. Analysis of structural vibration characteristics of Harmonic drive. International Conference on Ubiquitous Robots and Ambient Intelligence, Kuala Lumpur, Malaysia, 2014, p. 480-483.
-
Park G., et al. Vibrational characteristics of developed harmonic reduction gear and fault diagnosis by Campbell diagram. International Conference on Control, Busan, South Korea, 2015, p. 2062-2065.
-
Tuttle T. D., Seering W. P. A nonlinear model of a harmonic drive gear transmission. IEEE Transactions on Robotics and Automation, Vol. 12, Issue 3, 1996, p. 368-374.
-
Ryszard Leniowski Modeling of torsional vibration in harmonic drives. Archives of Acoustics, Vol. 32, Issue 4, 2007, p. 923-931.
-
Li Z., et al. Parametric vibration for electromechanical integrated electrostatic harmonic drive. Mechatronics, Vol. 17, Issue 1, 2007, p. 31-43.
-
Liao H., et al. Vibration suppression in a harmonic drive system. Society of Instrument and Control Engineers of Japan, Hangzhou, China, 2015, p. 1037-1041.
-
Makoto Iwasaki, Hiroyuki Nakamura Vibration suppression for angular transmission errors in harmonic drive gearings and application to industrial robots. IFAC Proceedings Volumes, World Congress, Cape Town, South Africa, Vol. 17, 2014, p. 6831-6836.
-
Liu P., Wu Z. Resonance analysis and suppression of harmonic reducer in low speed servo system. Proceedings of the 30th Chinese Control and Decision Conference. Shenyang, China, 2018, p. 2873-2878.
-
Gu J., et al. Manufacturing quality assurance for a rotate vector reducer with vibration technology. Journal of Mechanical Science and Technology, Vol. 33, Issue 5, 2019, p. 1995-2001.
-
Huang D. Forced response approach of a parametric vibration with a trigonometric series. Mechanical Systems and Signal Processing, Vol. 52, Issue 53, 2015, p. 495-505.
-
Kahraman A., Singh R. Non-linear dynamics of a spur gear pair. Journal of Sound and Vibration, Vol. 142, Issue 1, 1990, p. 49-75.
-
Ozguven H. N., Houser D. R. Mathematical models used in gear dynamics-a review. Journal of Sound and Vibration, Vol. 121, Issue 3, 1988, p. 383-411.
-
Shen Y., Yang S., Liu X. Nonlinear dynamics of a spur gear pair with time-varying stiffness and backlash based on incremental harmonic balance method. International Journal of Mechanical Sciences, Vol. 48, Issue 11, 2006, p. 1256-1263.
-
Luo Y., Baddour N., Liang M. Effect of gear center distance variation on time varying mesh stiffness of a spur gear pair. Engineering Failure and Analysis, Vol. 75, 2017, p. 37-53.
-
Zhou X., Shao Y., Lei Y., et al. Time-varying meshing stiffness calculation and vibration analysis for a 16 DOF dynamic model with linear crack growth in a pinion. Journal of Vibration and Acoustics, Vol. 134, Issue 1, 2012, p. 011011.
About this article

The authors would like to acknowledge the financial support of the National Natural Science Foundation of China (51575330).
