Abstract
In this paper, a sensor fault diagnosis method based on KPCA and contribution graph are proposed to adapt to the nonlinear and non-Gaussian characteristics of the system. Based on the kernel function theory, this method uses SPE and T2 statistics for fault detection and contribution graph for fault location, thus completing fault diagnosis. The numerical simulation results verify that the proposed method is more effective than the traditional PCA method in detecting nonlinear faults. At the same time, the KPCA contribution map can be used to accurately locate the fault sensor, which can provide a reference value for the sensor fault diagnosis of nonlinear systems in the future.
Highlights
- Principal component analysis (PCA) is one of the most typical linear fault diagnosis methods. However, when it is applied to nonlinear systems, its diagnostic performance is greatly reduced.
- The formulas of KPCA and contribution graph method are established and deduced. The sensor with the largest cumulative mean square contribution rate is the fault sensor.
- A numerical example of a nonlinear system with seven sensors is simulated. The results show that PCA has misjudgment when it is used to detect nonlinear system, and the detection ability of KPCA is much better than PCA.
1. Introduction
The bridge health monitoring system can more comprehensively grasp the stress and damage evolution laws of the whole process of bridge structure construction and service and is one of the effective means to ensure the safety of the construction and service of large bridges [1]. At present, the three most common methods for sensor fault diagnosis are based on the analytical model, signal processing, and knowledge experience [2].
The multivariate statistical analysis method is a multivariate statistical process control method based on signal processing, which has been widely used in process performance monitoring and fault diagnosis [3]. The PCA (Principal Component Analysis) method is one of the most typical linear fault diagnosis methods [4]. However, the diagnostic performance is greatly reduced when it is applied to a non-linear system [5].
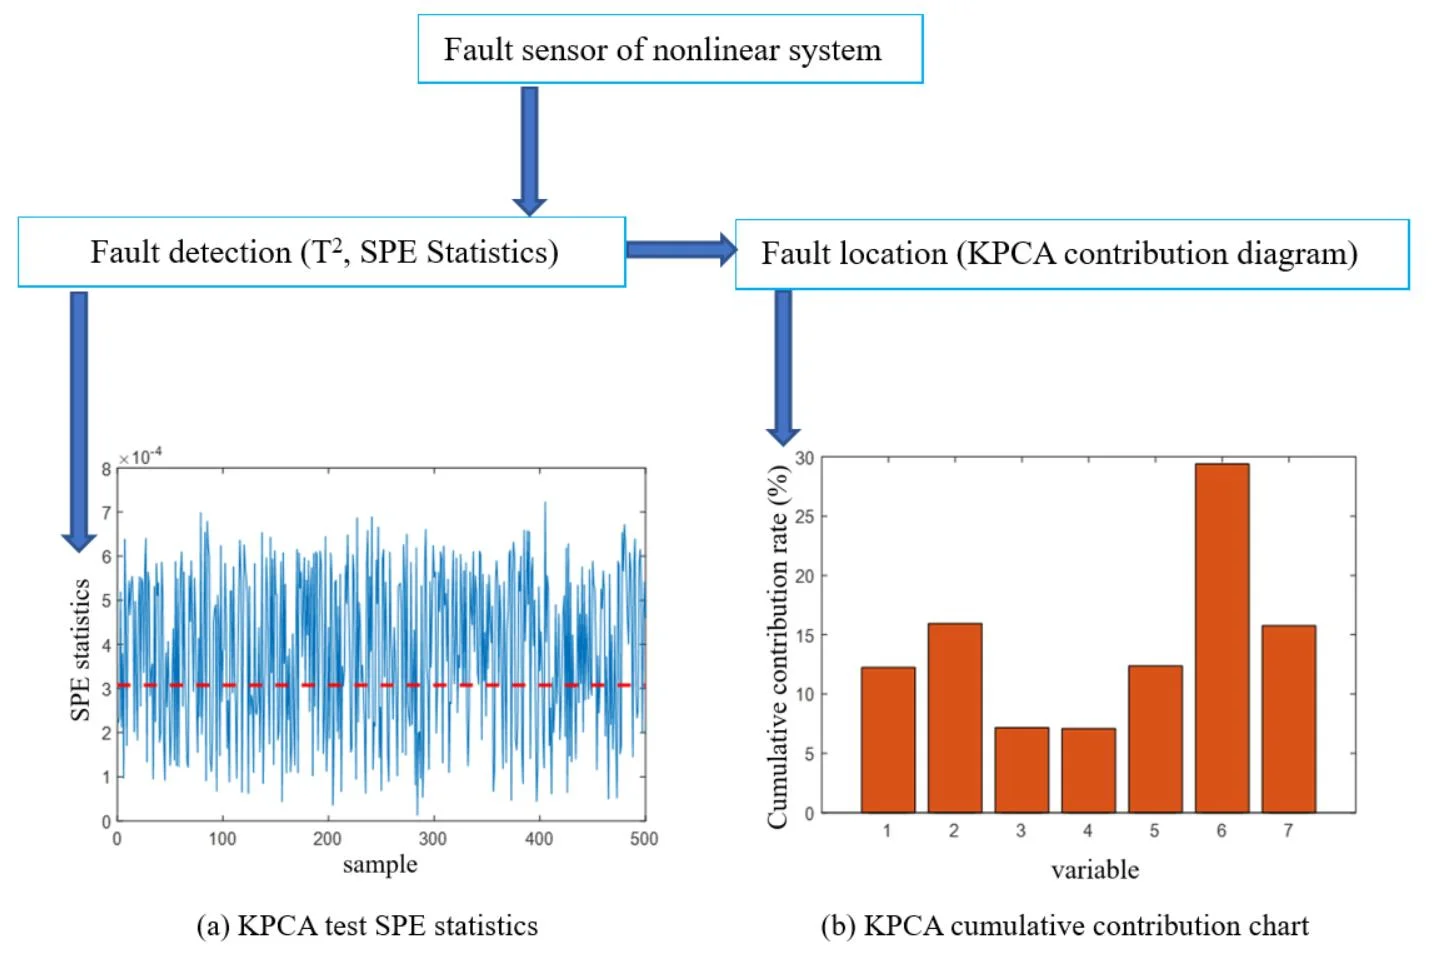
This paper proposes a new nonlinear diagnosis method based on the kernel principal component analysis (KPCA) and contribution graph. The KPCA method puts the measured data into a high-dimensional space through kernel function. In the high-dimensional space, the principal component is calculated by linear PCA method, and SPE statistics are constructed to detect whether the fault occurs or not, and then the contribution graph is drawn to locate the faulty sensor. Finally, numerical simulations are used to verify the superiority of the proposed KPCA combined with the contribution graph method in nonlinear sensor fault diagnosis than the traditional PCA method.
2. Sensor fault diagnosis method based on KPCA and contribution graph
2.1. Basic principles of KPCA
The kernel principal component analysis (KPCA) method is a nonlinear principal component analysis method. Its idea is to map the sample input space to a high-dimensional characteristic linear space through the nonlinear mapping function , so that the input data has better separability. PCA linear transformation is performed in the feature space , and then the covariance matrix of the feature space is diagonalized to obtain its eigenvalues and corresponding eigenvectors, and then the eigenvector is taken as the principal component vector. The corresponding score vector is obtained by determining the number of principal components and projection vector, to realize the principal component analysis of nonlinear input space .
2.2. KPCA-based fault detection method
The fault detection method based on KPCA usually includes two parts: the establishment of the off-line normal state principal component model and the online fault detection. As a non-linear principal component analysis method, KPCA online fault detection method still uses and SPE statistical indicators [4], the specific steps are as follows:
1) Obtain a new data set from sampling and normalize the data set using the mean and variance of the training samples in the normal state.
2) Use the kernel function to calculate the kernel matrix for the set of test data collected online;
3) Calculate to centralize the kernel matrix to get ;
4) Calculate the eigenvalue and eigenvector of , and normalize the obtained feature vector;
5) Calculate to extract non-linear principal elements for test data ;
6) Calculate the and SPE statistics of the measurement data to determine whether it exceeds and in the normal state. If it exceeds, there is a fault.
2.3. KPCA fault location method based on contribution graph
When the system fault is detected, it is necessary to analyze the cause of the fault, find out and separate the fault sensor, to ensure the normal operation of the system [5].
In the traditional PCA method, there is a certain linear relationship between the sensor and the fault monitoring amount, so it is easy to calculate the sensor contribution to draw the contribution graph, while in KPCA, the implicit nonlinear transformation function is used to transform the input space, so it is difficult to obtain the inverse mapping function from high-dimensional feature space to original space; at the same time, KPCA does not provide the corresponding relationship between the fault monitoring amount and the sensor. Therefore, the contribution graph method cannot be directly applied to the fault recognition in the KPCA model. However, by analyzing the nonlinear transformation process of the KPCA method, we can find that there is still a certain relationship between the sensor and the monitoring quantity composed of nonlinear principal component, that is, the correlation between the faulty sensor and the nonlinear principal component is large, while the correlation between the sensor in the normal state and the non-linear principal element is small [4, 5]. Therefore, the contribution of the KPCA method can be calculated according to Eq. (1):
The mean-square contribution vector is shown in Eqs. (2-3):
Let , (1, 2,…, ), then the new mean square contribution vector can be expressed as Eq. (3):
Therefore, the mean square contribution rate of the -th sensor can be expressed as:
When a total of sets of test data were collected during the period during which the fault occurred, the cumulative mean square contribution rate of the -th sensor was defined as:
After the above calculations, the sensor with the largest cumulative mean square contribution rate to the fault is the faulty sensor [4].
3. Simulation analysis of numerical examples
First, the performance of the method proposed in this paper is verified by the simulation analysis of a nonlinear system with 7 sensors. The system is composed of seven equations of Eq. (6), which embodies four typical nonlinear relationships: polynomial nonlinearity (Eqs. (1-4)), exponential nonlinearity (Eq. (5)), trigonometric function nonlinearity (Eq. (6)) and inverse function nonlinearity (Eq. (7)):
Among them, is Gaussian noise independent of each other, and all follow the normal distribution with a mean value of 0, and the variance is , ; follows the uniform distribution in the interval [–1.5, 1.5]. Besides, there is a nonlinear relationship between and , and , , and . Suppose the system generates n sets of samples, then it forms a matrix ,.
In order to compare the fault detection capabilities of KPCA and PCA for nonlinear systems, 1000 data samples are generated, and then the samples are normalized to a mean of 0 and a variance of 1, and then the data samples are trained and modeled by PCA and KPCA. The results show that the number of principal components of PCA is 2, thresholds and are 9.26 and 1.90 respectively; the number of principal components of KPCA is 16, thresholds and are 32.78 and 0.0001 respectively, the kernel function is Gaussian kernel function, and is 1.
Two types of sensor failures are analyzed below: (1) deviation failures that affect the average value; (2) gain failures that affect variance. Then three sets of 500 data test samples are generated. Among them, the first group of samples is the normal state inspection sample, which is used for the inspection under the normal state; the second group of samples is the fault 1 test sample, which is specially used to test the deviation fault, and the fixed deviation fault occurs in the manual setting sensor and the deviation amplitude is 0.5. The fault data is set according to Eq. (7):
The third group of samples is the fault 2 test sample, which is specially used to test the gain fault, and the sensor is set to have a constant gain fault, the gain amplitude is 1.5. The fault data is set according to Eq. (8):
PCA and KPCA methods are used to diagnose normal samples. The PCA test results show that both and SPE statistics are out of limits, among which the and SPE statistics are out of limit rates of 3.6 % and 1.6 %, respectively, indicating that there is a misjudgment phenomenon when PCA is used for nonlinear system testing. The KPCA diagnosis result is shown in Fig. 1. The horizontal red dotted line in the figure represents the threshold of statistics. There is no obvious overrun of the statistics (the SPE statistics overrun rate is 0.8 %), and the statistics are all below 0.1, which is far below its threshold (the threshold is close to 10). It can be considered that the sensitivity of statistics to the identified faults is low, so SPE statistics are only used in subsequent fault diagnosis.
Fig. 1Statistical diagnosis result of the normal process
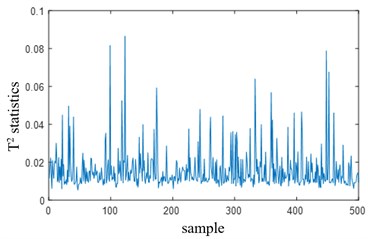
a) KPCA test T2 statistics
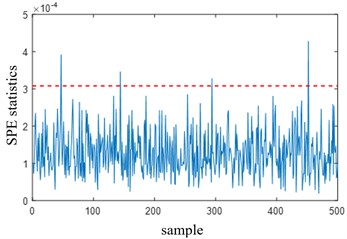
b) KPCA test SPE statistics
The PCA and KPCA methods are used to diagnose fault 1 sample. The PCA test results show that the overrun rate of PCA’s statistics is 4.4 %, and the overrun rate of SPE statistics is 3.8 %. The KPCA test results are shown in Fig. 2(a). The overrun rate of KPCA's SPE statistics is 84.8 %, which is far greater than the overrun rate of PCA, indicating that KPCA's ability to detect nonlinear sensor failure 1 is much better than PCA. Fig. 2(b) is a contribution diagram based on KPCA. From the figure, it can be found that the faulty sensor has the largest cumulative contribution rate, which is consistent with the assumed faulty sensor, indicating that the positioning is accurate.
Fig. 2Diagnosis under fault 1
a) KPCA test SPE statistics
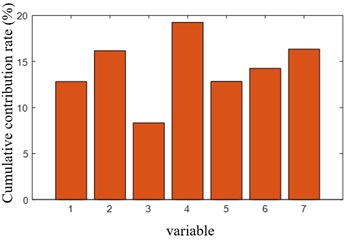
b) KPCA cumulative contribution chart
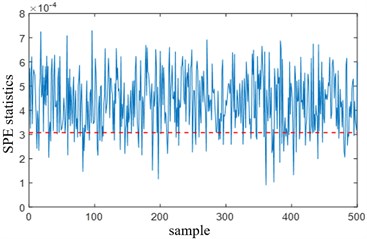
PCA and KPCA methods are used to diagnose 2 samples. PCA test results show that the overrun rates of and SPE statistics are 3.6 % and 0.8 % respectively; KPCA test results are shown in Fig. 3(a), in which the overrun rate of SPE statistics is 62.4 %, which is far greater than that of PCA, which also indicates that the ability of KPCA to detect nonlinear sensor fault 2 is far better than PCA. Then, the contribution graph based on KPCA in Fig. 3(b) shows that the fault sensor with the largest cumulative contribution rate is the fault sensor introduced artificially before, indicating that the location is accurate.
In summary, the numerical simulation of a nonlinear system with 7 sensors mentioned in this paper shows that the sensor fault diagnosis method based on KPCA and contribution graph is accurate and effective, and it is significantly better than PCA’s nonlinear sensor fault diagnosis ability, so it is more suitable for fault diagnosis of nonlinear systems.
Fig. 3Diagnosis under fault 2
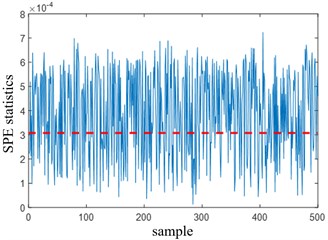
a) KPCA test SPE statistics
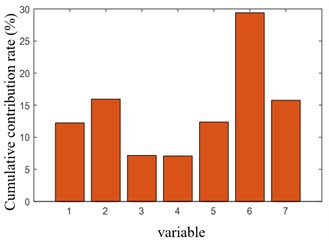
b) KPCA cumulative contribution chart
4. Conclusions
This paper proposes a sensor fault diagnosis method based on KPCA and contribution graph. It includes two parts: fault detection and fault location. The nonlinear sensor data in the original space is mapped to the linear high-dimensional feature space by the kernel function. PCA is used to calculate the principal component in the high-dimensional space, and T2 and SPE statistics are constructed to detect the occurrence of sensor fault, and then the sensor fault location is completed by drawing a contribution graph. Numerical examples of nonlinear sensor faults show that the KPCA fault detection rate is much greater than that of PCA. So in the field of nonlinear fault diagnosis, the sensor fault diagnosis method based on KPCA and contribution graph proposed in this paper has a better diagnosis effect and application prospect than traditional PCA.
References
-
Li Hui, Zhou Wensong, Ou Jinping, Yang Yongshun Research on the integrated technology of intelligent health monitoring system for large bridge structures. Journal of Civil Engineering, Vol. 39, Issue 2, 2006, p. 46-52.
-
Frank P. M. Analytical and qualitative model-based fault diagnosis – a survey and some new results. European Journal of Control, Vol. 2, Issue 1, 1996, p. 6-28.
-
Zhang Jie, Yang Xianhui Multivariate Statistical Process Control. Chemical Industry Press, Beijing, 2000.
-
An Xing Sensor Fault Diagnosis of Bridge Health Monitoring System Based on Principal Component Analysis. Chongqing University, 2018.
-
Deng Xiaogang, Tian Xuemin A nonlinear fault diagnosis method based on KPCA. Journal of Shandong University (Engineering Science Edition), Vol. 35, Issue 3, 2005, p. 103-106.
Cited by
About this article

This research was funded by the Natural Science Foundation of Chongqing, China, Grant No. cstc2018jscx-msyb1299.
