Abstract
The acoustic wave test was carried out by selecting the joints of the joint surface and the horizontal plane at 0°, 30°, 45°, 60°, 75°, and 90° phyllite samples. According to the corresponding waveform diagram, the starting point is selected, and the dynamic deformation parameters of thousands of rock samples under various angles are calculated. The results show that: The anisotropy characteristics of the dynamic deformation parameters are obvious, and the influence of the variation of the joint surface inclination on the dynamic deformation parameters is achieved by affecting the wave impedance. P-wave impedance and S-wave impedance have different effects on rock dynamic deformation parameters. Generally, P-wave and S-wave impedance should be considered comprehensively for the dynamic deformation parameters of rock samples. Acoustic waves are in the elastic deformation law of the rock sample caused by the propagation in the rock sample is similar to the elastic deformation law caused by the external load acting on the rock sample.
1. Introduction
The dynamic deformation parameters of rock mass have dynamic Poisson's ratio, dynamic shear modulus, dynamic elastic modulus, dynamic bulk modulus, and dynamic Lame coefficient. Dynamic deformation parameters are usually obtained by acoustic testing. Acoustic wave test refers to the emission of P-wave and S-wave to the rock mass, so that it propagates in the rock mass. After receiving the P-wave and the S-wave, calculate the wave velocity by taking the jump point of the received waveform, and calculate the dynamic deformation parameter according to the wave velocity. This test method is mainly based on the acoustic properties of the rock and soil.
At present, many scholars have done a lot of research on rock acoustics. Within a certain range, the degree of shear wave anisotropy of the medium increases with the density and width of the crack Chu and Zhang [1]. Zheng et al. [2] discovered that the wave velocity-stress curve increases linearly during the elastic loading stage of granite and gneiss. Nakagawa et al [3] found that the wave velocity and attenuation coefficient are quite different for CO2 flooding and brine re-displacement under the same conditions. Kurtulus et al. [4] found that the wave velocity of the acoustic wave containing the joint plane rock is significantly attenuated, and the rock sample with random joints is attenuated more than the parallel joint rock sample. Wei et al. [5] found that the torsional transverse wave with no polarization direction propagates at two different speeds in anisotropic media, and the splitting phenomenon occurs. Zhang et al. [6] gives the relationship between wavelength, elastic modulus and elastic wave velocity including detail structure scale, phase boundary scale, phase interface state and so on. Wong et al. [7] found that the values obtained by the static compression test are smaller than those obtained by the ultrasonic test and the in-situ log, and the values of the parameters obtained by the three methods are discussed, and the reasons for the difference in the parameter values are analyzed. Inigo et al. [8] studied the wave velocity variation of granite materials under freeze-thaw cycles. Renaud et al. [9] changed the propagation velocity of ultrasonic pulses in dry Berea sandstone, the change of dynamic elastic mode of the sample is measured, which provides relevant evidence for hysteresis nonlinearity under low dynamic strain conditions. Cerrillo et al. [10] used ultrasonic technology to estimate the physical and mechanical properties of granite, the linear statistical correlation between acoustic parameters and rock physical and mechanical properties is obtained. Fort et al. [11] Ultrasonic nondestructive testing was used to test the longitudinal wave velocity and porosity of granite in cultural sites. Song et al. [12] obtained dynamic elastic modulus of rock by the acoustic wave velocity test of layered rock. With the increase of confining pressure, both the longitudinal wave velocity and the transverse wave velocity increase monotonically, and the dynamic elastic modes of different rock layers are considered. Shi et al. [13, 14] found that the compaction effect of longitudinal wave time difference becomes more obvious with the increase of porosity. Fei et al. [15] combined model of the nonlinear constitutive relation of the rock and the linear tangential constitutive relation and the corresponding stress wave propagation equation of the P-wave oblique incidence joint.
In summary, at present, the research on the acoustic characteristics of rock mainly focuses on the anisotropic characteristics of acoustic wave velocity. However, there are still few studies on the anisotropic characteristics of rock mass dynamic deformation parameters through the anisotropic characteristics of acoustic wave velocity. Therefore, this paper focuses on the anisotropic characteristics of rock mass dynamic deformation parameters through the anisotropic characteristics of wave velocity.
2. Test overview
2.1. Sample overview
The author selected 35 phyllite samples with a size of Φ50 mm×L100 mm to calculate their density (). The 35 rock samples were divided into 7 groups according to the lamellar plane azimuth () 0°, 30°, 45°, 60°, 75°, 90°, as shown in Fig. 1. First, debug the instrument to get the zero-setting waveform, and select the starting point of the waveform to determine the zero delay () and () of the system. Then, P-wave and S-wave test are performed on each rock sample, the waveform chart is recorded, the jump point is reasonably selected from the waveform chart, and the time P-wave () and S-wave () corresponding to the jump point are recorded. According to the Eq. (1), the P-wave velocity () and the S-wave velocity () are calculated, and the and of each group of rock samples are averaged to obtain the corresponding and :
Calculate the dynamic Poisson’s ratio, dynamic shear modulus, dynamic Lame coefficient, dynamic bulk modulus, and dynamic elastic modulus by Eq. (2):
2.2. Overview of equipment and test principles
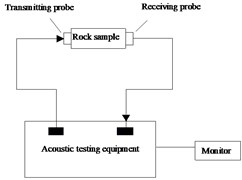
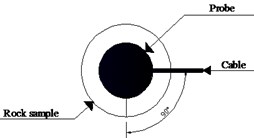
This experiment uses the probe produced by Panametrics, USA, the ultrasonic exciter produced by OLYMPUS, the TDS2012C type oscilloscope produced by Tektronix, and the display test system. As shown in Fig. 2.
Fig. 1θ is a 0°-90° rock sample photo
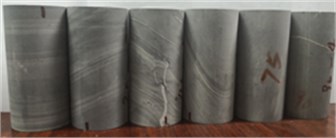
Fig. 2Schematic diagram of the experimental equipment
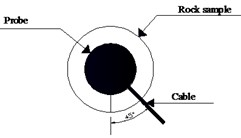
In order to avoid the splitting of the S-wave caused by the polarization angle, and thus affecting the test results, three polarization angles of 0°, 45°, and 90° were selected during the test, as shown in Fig. 3. The S-wave velocity is measured separately to obtain three different , and the three are averaged as the final .
Fig. 3Schematic diagram of the polarization angle arrangement
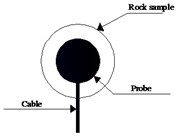
a) The polarization angle is 0°
b) The polarization angle is 45°
c) The polarization angle is 90°
3. Results and analysis
, with curve shown in Figs. 4-5.
Fig. 4 shows that as the change of occurs, the change of first decreases by 0, and then changes from stable to large. The reason for this phenomenon is that the difference of the dip angle of the joint surface leads to the rock. The impedance is different. The higher the impedance, the faster the wave velocity propagates. The smaller the impedance, the slower the wave velocity propagates. When the 90°, the stiffness of the rock sample is significantly higher than other angles due to the different deformation mechanism, so the impedance appears. The surge has caused a surge in the P wave velocity. Furthermore, due to the existence of the joint face, P wave propagation will cause reflection, refraction, etc., which will cause the formation of standing waves, which will affect theP wave velocity, so that the P wave velocity has obvious anisotropic characteristics. Fig. 5 shows that as the changes continuously, first appears at the first peak at 45°, and at 90°, increases again, similar to theP wave velocity S wave. The anisotropy of the wave velocity is also due to the change of the wave impedance and the reflection and refraction of the joint against the S wave. Figs. 6-10 shows the variation of the dynamic deformation parameters of the rock sample with .
Fig. 4VP vs. θ curve
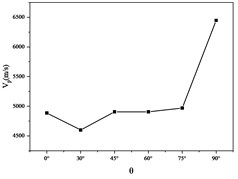
Fig. 5Vs vs. θ curve
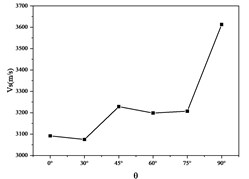
Fig. 6Dynamic Poisson’s ratio with θ curve
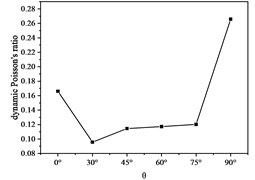
Fig. 7Dynamic elastic modulus with θ curved
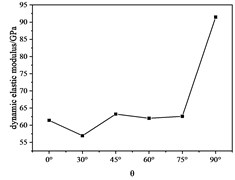
Fig. 6 shows the phenomenon that the dynamic Poisson’s ratio increases first and then increases steadily and then increases sharply. The reason for this phenomenon is that when the wave propagates in the rock sample, it will inevitably cause slight elastic deformation of the rock sample. When 0°, the axial deformation of the rock sample is mainly elastic deformation of the rock, and the joint surface is slightly compressed. Deformation, when 30°, 45°, 60°, 75°, the axial deformation of the rock sample is mainly the elastic compression of the rock, the compression deformation of the joint surface, and the sliding deformation of the rock sample along the joint surface. When 90°, the axial elastic deformation of the rock is mainly the compression of the rock mass and the buckling deformation of the joint surface. In summary, when 90°, the axial elastic deformation is small, when 30°, 45°, 60°, 75°, the axial elastic deformation is the largest, and the 0° axis the elastic deformation is in the middle, and the phenomenon shown in Fig. 6 appears according to the definition of Poisson’s ratio. Fig. 7 shows the variation of the dynamic elastic modulus with . It is observed that the variation of the dynamic elastic modulus is very similar to the variation of the S wave velocity. The reason is: The S wave velocity of the rock sample has a great relationship with the impedance. The definition of wave impedance shows that the wave impedance also reflects the ability of the material to resist elastic deformation to a certain extent. Therefore, it can be considered that the magnitude of the S wave velocity can reflect the elastic deformation ability of the rock sample.
Fig. 8Dynamic shear modulus with θ curve
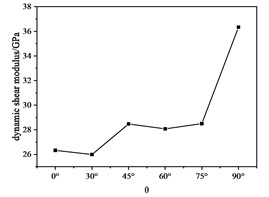
Fig. 9Dynamic bulk modulus with θ curve
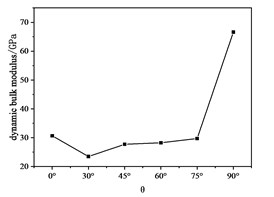
Fig. 10Curve of dynamic Lame coefficient with θ
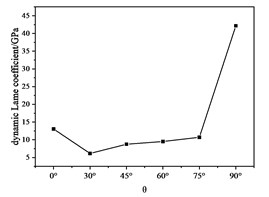
Fig. 8 shows the variation of the dynamic shear modulus with . Careful observation shows that the dynamic shear modulus and the dynamic elastic modulus change similarly. The reason for this phenomenon is that when is determined, the and of the rock sample are proportional to , and the dynamic elasticity of the rock sample can be known from Eq. (3). The modulus and dynamic shear modulus should be proportional:
Fig. 9 shows the dynamic bulk modulus as a function of . Similar to previous analysis of other dynamic deformation parameters, the dynamic bulk modulus should be positively correlated with the wave resistance of the P wave. Fig. 10 shows the law of the dynamic pull coefficient with . Here we must first explain the mechanical significance of the Lame coefficient. The physical meaning of the Lame coefficient is the magnitude of the radial stress when the unit axial strain occurs: .
From the law reflected in Fig. 9 and the mechanical significance of the Lame constant, it can be seen that the P wave impedance and the S wave impedance simultaneously affect the moving pull coefficient.
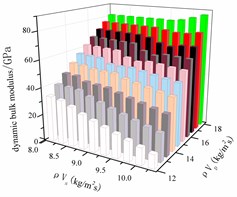
We will focus on the relationship between rock wave impedance and rock sample dynamics parameters, and use origin 8.0 software to make a three-dimensional map of P wave impedance, wave impedance and dynamic deformation parameters, as shown in Figs. 10-14.
Fig. 11 shows the variation of the dynamic Poisson’s ratio with the impedance of the P wave and the impedance of the S wave. When the P wave impedance is 12-14 kg/m2s, the dynamic Poisson’s ratio decreases with the increase of the S wave impedance. When the P wave impedance is 14-18 kg/m2s, the dynamic Poisson’s ratio with the S wave impedance. The increase shows a law of decreasing first and then increasing. Fig. 12 shows that the dynamic elastic modulus increases with the increase of the P wave impedance when the S wave impedance is 8.0-8.5 kg/m2s, and the dynamic elastic mode when the S wave impedance is 8.5-10.0 kg/m2s. The amount of P wave impedance increases with the increase: the first decrease, then the increase and then the decrease.
Fig. 13 shows that the dynamic shear modulus increases with the increase of the P wave impedance, and the S wave impedance does not have much influence on the change of the dynamic shear modulus, so the whole change law approximates a rectangular plane. Fig. 14 shows that the dynamic Lame coefficient increases linearly with the P wave impedance, and decreases linearly with the S wave impedance. Therefore, the dynamic Lame coefficient varies with the P wave impedance, and the S wave impedance changes approximately as a plane. Fig. 15 shows: when the P wave impedance is 12-16 kg/m2s, the dynamic bulk modulus decreases with the increase of S wave impedance. When the P wave impedance is 16-18 kg/m2s, the dynamic bulk modulus varies with S. The wave impedance increases as the impedance increases.
Fig. 11Dynamic Poisson’s ratio
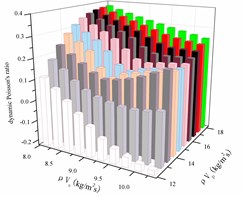
Fig. 12Dynamic elastic modulus
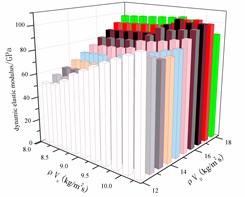
Fig. 13Dynamic shear modulus
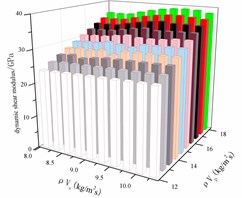
Fig. 14Dynamic Lame coefficient
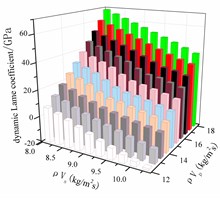
Fig. 15Dynamic shear modulus
4. Conclusions
The phyllite’s dynamic deformation parameters are closely related to the wave impedance of the rock sample. It can be considered that the anisotropic characteristics of the rock sample affect the anisotropic characteristics of the transmitted wave velocity in the rock sample, which is reflected as the anisotropic characteristics of the wave impedance, and finally the anisotropic characteristics of the dynamic deformation parameters of the rock sample. When the P wave and the S wave propagate along the joint plane, it can be considered that the wave impedance reaches the maximum value at this time, and the corresponding wave velocity and dynamic deformation parameters also reach the maximum value. While the wave impedance of the S wave is considered to be the smallest when the incident direction is perpendicular to the joint surface, but since the dynamic deformation parameter involves the P wave impedance, it cannot be simply assumed that the dynamic deformation parameter is the smallest at this time. The anisotropic characteristics between the dynamic deformation parameters of rock samples are not independent and irrelevant. When the rock sample is disturbed by elastic waves during the elastic deformation stage, the load is deformed like the elastic stage, and the elastic compression and deformation are completed in the rock sample. It is gradually transformed into shear deformation along the joint surface. The influence of the S wave impedance on the P-wave impedance on the dynamic deformation parameters of the rock sample is different, and the change of the dynamic deformation parameter of the rock sample is generated under the joint influence of the P wave impedance and the S wave impedance.
References
-
Chu Z. H., Zhang Y. Propagation of shear waves in anisotropic composite media. Journal of the University of Petroleum, Vol. 22, Issue 1, 1998, p. 22-24.
-
Zheng G. P., Zhao X. D., Liu J. P., Li Y. H. Experimental study on the variation law of acoustic wave velocity during rock loading. Journal of Northeastern University, Vol. 30, Issue 8, 2009, p. 1197-1120.
-
Nakagawa S., Kneafsey T. J., Daley T. M. Aboratory seismic monitoring of supercritical CO2 flooding in sandstone cores using the Split Hopkinson Resonant Bar technique with concurrent x-ray computed tomography imaging. Geophysical Prospecting, Vol. 61, Issue 2, 2013, p. 254-269.
-
Kurtulus C., Uckardes M., Sari U. Experimental studies in wave propagation across a jointed rock mass. Bulletin of Engineering Geology and the Environment, Vol. 71, Issue 2, 2012, p. 231-234.
-
Wei J. X., Wang C. L., Di B. R. Preliminary experimental observation of torsional wave splitting in anisotropic media. Journal of Geophysics, Vol. 49, Issue 6, 2009, p. 755-1761.
-
Zhang P. Y., Zhang X. M., Wang T. G. Relationship between elastic modulus of rock and elastic wave velocity. Journal of Rock Mechanics and Engineering, Vol. 20, Issue 6, 2001, p. 785-788.
-
Wong R. C. K., Schmitt D. R., Collis D. Inherent transversely isotropic elastic parameters of over-consolidated shale measured by ultrasonicwaves and their comparison with static and acoustic in situ long measurements. Journal of Geophysics and Engineering, Vol. 5, Issue 1, 2008, p. 103-117.
-
Ingio A. C., García Talegón J., Vicente Tavera S. Colour and ultrasound propagation speed changes by different ageing of freezing/thawing and cooling/heating in granitic materials. Cold Regions Science and Technology, Vol. 85, 2013, p. 71-78.
-
Renaud G., Riviere J., Le Bas P. Y. Hysteretic nonlinear elasticity of Berea sandstone at low-vibrational strain revealed by dynamic acousto-elastic testing. Geophysical Research Letters, Vol. 40, Issue 4, 2013, p. 715-719.
-
Cerrllio C., Jimenez A., Rufo M. New contributions to granite characterization by ultrasonic testing. Ultrasonics, Vol. 54, 2014, p. 156-167.
-
Fort R., Buergo M. A. D., Perez Monserrat E.-M. Non-destructive testing for the assessment of granite decay in heritage structures compared to quarry stone. International Journal of Rock and Mining Sciences, Vol. 61, 2013, p. 296-305.
-
Song I., Suh M., Woo Y. K. Determination of the elastic modulus set of foliated rocks from ultrasonic velocity measurements. Engineering Geology, Vol. 72, Issue 3, 2004, p. 293-308.
-
Shi G., Sheng L. D., Wang J. X. Experimental study on compaction effect of rock acoustic wave. Journal of Peking University, Vol. 40, Issue 2, 2004, p. 177-183.
-
Shi G., Yang D. Q. Study on the difference between rock wave porosity and mud content. Journal of Peking University, Vol. 37, Issue 3, 2001, p. 379-384.
-
Fei H. L., Bao S. J., Yang Z. G. Influence of oblique incidence of stress wave on the joint end of rock mass. Yantu Lixue/Rock and Soil Mechanics, Vol. 39, Issue 7, 2018, p. 2327-2335.
About this article

The authors acknowledge the financial supports from National Natural Science Foundation of China (41807245), Natural Science Foundation of Shaanxi Province (2019JQ218), Key R&D and Conversion Projects of Qinghai Provincial Science and Technology Department in 2020 (2020-SF-C35) and National Key R&D Program of China (2016YFC0401801).
