Abstract
The algorithm of curve smoothing for diesel indicator diagram is introduced, and the concrete implementation process is expounded in detail. First, the multi cyclic mean value operation of indicator diagram data is performed. By probable error of calculating indicator diagram data, if probable error is greater than a specific value, and the predicted value is used instead of the singular point data. The average operation of the indicator diagram data is processed again. Finally, the five-point cubic smoothing method is used to smooth the indicator curve, and the smooth, continuous and gradual indicator diagram curve is obtained. The experiments show that the algorithm described in the paper can effectively filter the noise of cylinder pressure signal, and obtain a smooth indicator diagram curve, which verifies the effectiveness of the algorithm described in the paper.
1. Introduction
In reference [1-3], the indicator diagram of diesel engine is an important basis for studying the perfection of diesel working process, the fault judgement of diesel engine and the combustion process of diesel engine. The rule of heat release, the power of diesel engine and the temperature in the cylinder of diesel engine can be studied by the indicator diagram of diesel engine. In reference [2, 4], the indicator diagram of diesel engine shows the working process in cylinder intuitively in the form of curve, and the working performance of diesel engine can be judged exactly by the calculation and analysis results of the indicator diagram, and the diesel engine can be adjusted properly. In the process of obtaining the cylinder pressure data of diesel engine, it is affected by channel effect, power frequency interference and random error, etc. The curve that leads to the dynamometer is not a continuous, smooth, gradual curve, but rather a jagged burr. The existence of these disturbances has a great influence on the numerical calculation of thermodynamic processes. If these data are directly used to calculate the exothermic rate based on the indicator diagram of diesel engine, the exothermic curve will be greatly distorted and will not reflect the exothermic law accurately, and the combustion process in cylinder can’t be judged accurately. Therefore, before calculating the exothermic process, it is necessary to smooth the indicator curve of diesel engine, eliminate the interference signal as much as possible, and obtain the original indicator diagram data with relatively small error.
In reference [5], the direct filtering method of pressure signal is used to smooth the curve of indicator diagram, which effectively reduces the fluctuation of the curve; in reference [6], the Lagrange multiplier method is used to smooth the curve of indicator diagram, which effectively solves the problem that some points on the curve are not differentiable, and reduces the error to 0.5 %; in reference [2, 3, 7, 8], the application of five point quadratic fairing, five point cubic fairing, seven point cubic fairing and spline function fairing has achieved good results, but there are problems such as interference signals can’t be completely filtered, or sampling points are reduced.
The algorithm described in the paper can filter the interference signal on the curve of indicator diagram as much as possible without reducing the number of sampling points, and obtain a relatively smooth and continuous curve of indicator diagram.
2. The overall structure of indicator diagram data acquisition system
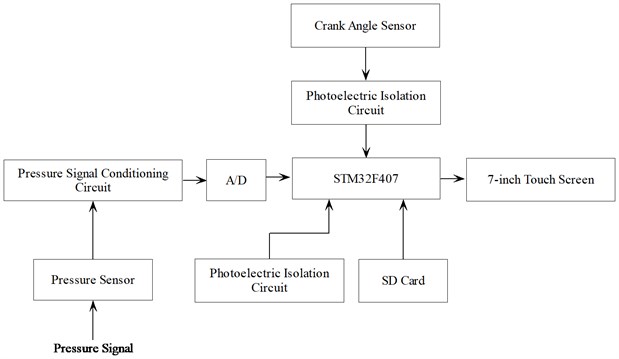
General structure of data acquisition system for indicator diagram. The data acquisition system of indicator diagram is composed of pressure sensor, pressure signal conditioning circuit, upper stop point sensor, crankshaft angle sensor, photoelectric isolation circuit, touch screen display module, STM32F407 control system. The hardware architecture block diagram is shown in Fig. 1.
Fig. 1Hardware structure block diagram
3. Indicator diagram data preprocessing algorithm
In the process of collecting the cylinder pressure data of diesel engine, there are random error data because of some unanticipated interference factors, which lead to the acquisition of the cylinder pressure data. Therefore, in order to reduce random error data, enough complete cylinder working cycle data must be collected when collecting data, However, the more the complete cylinder working cycle data is collected, the more complete the cycle data is, the lower the running efficiency of the system. In reference [9, 10], too little complete cycle data, cannot eliminate random error data, general diesel engine indicator diagram data collection 20-100 complete cycle data to draw indicator diagram. In order to keep the original shape of the curve as long as possible, to reduce the error caused by the data processing, and to ensure that the number of sampling points of the cylinder pressure data does not decrease, the, Multi-cycle cylinder pressure data average processing, singular point data prediction and median filtering are used in the data preprocessing algorithm of indicator diagram.
3.1. Calculation of average pressure data
The average pressure data of each point under the same crankshaft angle is calculated according to the Eq. (1):
where : mean value of pressure data for different cycles at the same crankshaft angle; : pressure data for different cycles at the same crankshaft angle loop number; : loop number.
The pressure data of a complete cycle is obtained by the mean of the Eq. (1).
3.2. Average pressure for the same cycle
where : average pressure data for the same cycle; : mean of pressure data for different cycles at the same crankshaft angle; : number of sampling points.
3.3. Calculation of probable error
The probable error of the same cyclic pressure data is calculated according to the Eq. (3):
3.4. Judgement and alternative handling of pressure data
Because of the existence of singular point data, the data after mean operation will increase the error of numerical value, so we must eliminate these data. In the system, the probable error is calculated, and singular point data is eliminated by judging probable error is greater than a specific value and the prediction value is replaced by the singular point data, and the sampling point number of the data is kept constant.
The pressure data corresponding to the turning angle of a crankshaft is judged in the form Eq. (4). If the value of the form Eq. (4) is greater than 3.3, the pressure data is discarded and the predicted value of the form Eq. (5) is replaced by the discarded singular point data:
The predicted value of the pressure data corresponding to the crankshaft angle at a certain point is shown in form Eq. (5):
where : the predicted data at time ; : data from the previous interview at time ; : data from a later interview at time .
3.5. Median filter processing
In the actual measurement process, the pressure data collected from the cylinder often have the more prominent peak presence, And the duration is short, the signal is processed by the median filter, which will get the ideal effect and lay the foundation for the smoothing algorithm.
The principle of median filtering:
For the input continuous digital signal , take the length of the signal as the center, take a signal of length ,and the interval is , the middle value of the interval, which is calculated as the new output value.
4. Smoothing algorithm of indicator diagram curve
It is difficult to obtain reliable data if -indicator diagram is drawn directly from the preprocessed data. Because in the process of cylinder pressure data acquisition, random noise data will be mixed, in reference [11, 12], in order to reduce the impact of the error, besides the pretreatment of indicator diagram data, the smoothing algorithm of indicator diagram curve is also needed to improve the smoothness of indicator diagram curve. In order to obtain a smooth and continuous indicator diagram curve, a five-point cubic fairing method is used to smooth the indicator diagram curve, and good results are obtained.
The five-point cubic smoothing formula is shown in Eq. (6):
where : indicator diagram data before fairing; : indicator diagram data after fairing; : number of data.
5. Experiments and analysis
The main parameters of model 4190ZLC diesel engine are shown in Table 1.
Table 1Basic parameters of model 4910ZLC diesel engine
Number and arrangement of cylinders | 4 cylinders, straight line |
Type | Four-stroke, water-cooled, pressurized intercooled and direct injection combustion chamber |
Cylinder diameter | 190 mm |
Piston stroke | 210 mm |
Total displacement | 23.82 L |
Compression ratio | 14:1 |
Rated speed | 1000 rpm |
Rated torque | 2100 N.m |
Rated power | 180 KW |
Operating conditions of the system: 945rpm speed of diesel engine, load rate 20.
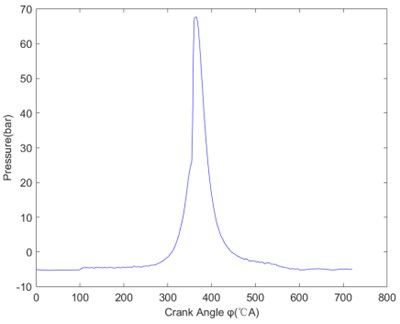
Twenty circulation cylinder pressure data are collected by the dynamometer data acquisition system designed in the paper, and the output of the single cycle dynamometer diagram is shown in Fig. 2 after the mean of the multi-cycle is calculated by the Eq. (1). Using the Eqs. (2-5) to judge the selection of pressure data and the indicator diagram after substitution treatment is shown in Fig. 3. After the median filtering operation, the indicator diagram is shown in Fig. 4. After pre-processing, the indicator diagram curve is shown in Fig. 5 after the five-point cubic fairing method.
As you can see in Fig. 4, after the median filter, the interference signal near the sampling point is 180 °CA, The interference signal on the upper side of the curve is filtered, and the amplitude of the interference signal on the lower side of the curve is obviously decreased, and the random noise is basically filtered. The amplitude of the useful signal is restored to the amplitude of the original signal, but the smoothness of the curve is deficient. As you can see from Fig. 5, after pre-processing of indicator data, The curve of indicator diagram is smooth and continuous by five-point cubic smoothing method, and the shape of curve and the change trend of curve have hardly changed. Thus, the validity of the algorithm described in the paper is verified. After the processing of the above-mentioned algorithm, there is still a small burr, but it has no effect on using the indicator diagram to judge the working state of diesel engine and related thermodynamic operation.
Fig. 2The indicator diagram of a single cycle after the mean operation
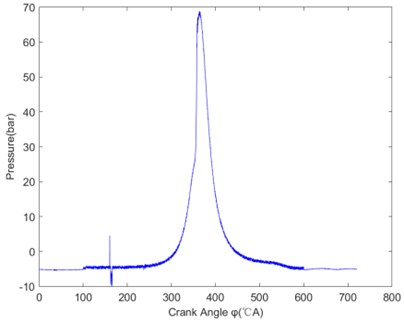
Fig. 3The indicator diagram after the decision of the choice of data
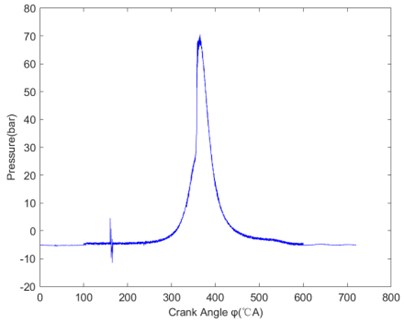
Fig. 4Indicator diagram after median filtering
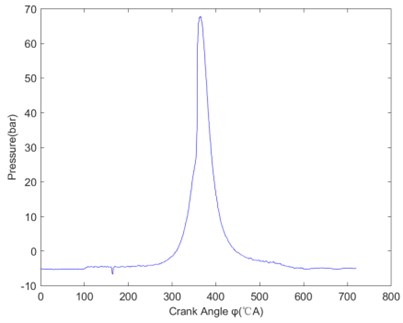
Fig. 5The indicator curve after smoothing
6. Conclusions
In the paper, the general structure of diesel engine indicator is described, and the cylinder pressure data of diesel engine is acquired by it. In the process of collecting the cylinder pressure signal of diesel engine, interference signal is unavoidable, so digital processing algorithm is needed to process the collected data. The paper first preprocesses the indicator diagram data, and then smooth the indicator diagram data by five-point cubic smoothing method to obtain a smooth and continuous indicator diagram curve. By comparing the indicator diagram curves before and after treatment, the curve after treatment is smooth, continuous and less distortion. The original characteristics of the indicator diagram are basically preserved, and the effectiveness of the algorithm is verified.
References
-
Cao Guohao, Yu Yonghua, Yang Jianguo Development of a indicator diagram measurement system based on microcontroller for a marine diesel engine. Ship and Ocean Engineering, Vol. 39, Issue 1, 2010, p. 84-87.
-
Lin Minqiu The Research of Marine Diesel Engine Dynamometer Data Acquisition and Combustion Analysis System, Da Lian.
-
Xiao Huichao Development and Research of Marine Diesel Engine Operating Parameters Acquisition and Analysis System. Tianjin University of Technology, Tian Jin, 2015.
-
Xu Youlin, Chen Dandan, Xiong Ling Design and implementation of in-cylinder working processes monitoring system for marine diesel engines. Ship and Ocean Engineering, Vol. 34, Issue 4, 2015, p. 54-56.
-
Tan Z. C., Reitz R. D. An ignition and combustion model based on the level-set method for spark ignition engine multidimensional modeling. Combustion and Flame, Vol. 145, Issues 1-2, 2006, p. 1-15.
-
Rakopoulos C. D., Giakoumis E. G. Second-law analyses applied to internal combustion engines operation. Progress in Energy and Combustion Science, Vol. 32, 2006, p. 42-47.
-
Yang Kun, Fan Huanyu, Ouyang Guangyao Method and correction of combustion law of marine diesel engine. Ship and Ocean Engineering, Vol. 47, Issue 1, 2018, p. 65-70.
-
Xu Guanjie Engine Combustion Analysis Based on Test System. Jiangsu University, Zhen Jiang, 2016.
-
Chang Minghe, Wu Naiming The software development of indicator diagram experiment's data acquisition system. Journal of Foshan University (Natural Science Edition), Vol. 30, Issue 2, 2012, p. 57-63.
-
Liao Borong Study on Combustion Characteristics of Gasoline Engine under Accelerated Transient Operating Conditions. Changsha University of Science and Technology, Chang Sha, 2015.
-
Yang Sheng Development and Application Research of the Combustion and Emission Analysis System in Intenal Combustion Engines. Guang Xi University, Nan Ning, 2016.
-
Wang Ke, Tang Zhonghui, Sun Xingwei A curve fairing processing algorithms of point cloud data. Modular Machine Tool and Automatic Manufacturing Technique, Vol. 2, 2013, p. 64-66.
About this article

The work was supported by Jilin Provincial Science and Technology Program (No. 20180201090GX); The Education Department of Jilin Province Science and Technology Program (No. JJKH20200778KJ).
