Abstract
Development of devices for the visually impaired people equipped with a vibrating interface was the motivation of the research presented in the paper. Knowledge about discriminative ability of touch is crucial when designing devices which use tactile interfaces. The paper presents results of psychophysical studies on determining the vibrotactile frequency discrimination threshold on the wrist of blind and partially sighted people. The transformed adaptive method 1 up/2 down was used in the presented research. Thresholds were obtained on the ventral wrist at 5 frequencies: 25, 31.5, 63, 125 and 250 Hz. Results were examined to find factors which could influence the threshold value. Additionally, the guidelines for devices with vibrating interfaces supporting spatial orientation of the blind and partially sighted people was developed based on results and analysis
Highlights
- Vibrotactile frequency discrimination thresholds for frequencies 25; 31.5; 63; 125 and 250 Hz were determined.
- The psychoacoustic adaptive 1 up/2 down method and three interval forced-choice procedure was used.
- There were no statistically significant differences between thresholds values for men and women.
- There were no statistically significant differences between thresholds values for blind, partially sighted and normally sighted people.
1. Introduction
According to last World report on vision prepared by World Health Organization [1] at least 2.2 billion people have a vision impairment or blindness. At the same time visual stimuli constitute approximately 80 % of all the information reaching the human brain [2]. Therefore, the development of devices supporting people with sight disabilities is very important. Such devices should use vibration interfaces and leave user’s hands free because of the role of touch in movement, but also for practical reasons [3]. Designing such a device – a vibrating bracelet – became the inspiration for the research presented in the paper.
The purpose of the psychophysical test series was to investigate mechanism of vibration perception on the wrist. The starting point of the described tests was results of measurements of absolute vibration thresholds on the proximal phalange and ventral wrist [4, 5]. The paper presents research examined the ability to identify the changes of the vibration frequency on the wrist for selected frequency. The measurements were carried out using the adaptive method 1 up/2 down on a measuring stand designed for testing vibrotactile discrimination thresholds.
2. Methodology
2.1. Psychophysical adaptive procedure
Discrimination of changes in the vibration frequency is the ability of the sense of feeling to perceive changes in vibration frequency over time. In other words, this ability allows a person to notice the difference in frequency of two vibration signals [6].
The vibrotactile frequency discrimination threshold on the wrist were examined using the adaptive up/down method [7, 8]. The procedure was selected based on pilot studies carried out using the method of constant stimuli. The study was performed for five frequencies: 25; 31.5; 63; 125; 250 Hz. The frequencies were selected based on results and analyses of absolute vibration thresholds on the ventral wrist described by Wiciak et al. [5]. Vibrations of selected frequencies stimulate FAI mechanoreceptors (25; 31.5 and 63 Hz) and FAII mechanoreceptors (125 and 250 Hz).
Changes of vibration signal frequency are poorly recognized by the human sensory system. Therefore, the up/down method with three interval forced-choice (3IFC) was chosen. With 3IFC subject receives three signals and must recognize one different signal from two the same. The algorithm of up/down method with three interval forced-choice (3IFC) was implemented in the LabVIEW environment [9]. The difference between the standard (reference) and variable (compared) stimulus in each first attempt was such that the subjects clearly felt it and provided the correct answer. In this phase of the algorithm, after each correct answer there was a reduction of the difference between the standard and variable stimulus by a double step value. After the first incorrect answer (first reversal), the main phase of procedure 1 up/2 down followed (Fig. 1).
In the following attempt, the difference between the stimuli was greater by the value of the step. From now on, the reduction of the difference between stimuli in the trial could only take place after two successive correct answers and was the value of the step. However, after each wrong answer, or a sequence of correct and wrong answer, the difference between the stimuli in the sample was increased by the step value. The end of the study occurred after 8 retreats. The test conditions are summarized in Table 1.
Fig. 1Vibration frequency discrimination – trial sequences of three interval forced-choice (3IFC) procedure
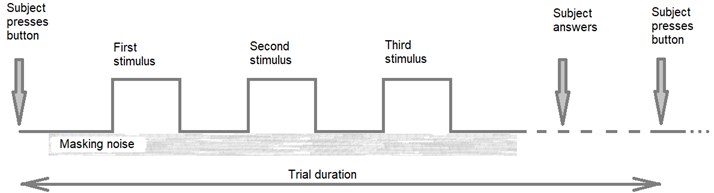
Table 1Test conditions for measurement of vibrotactile frequency discrimination threshold [10]
Vibrotactile frequency discrimination threshold | ||
Stimulus | Standard stimulus | Sinusoidal signal with frequencies 25; 31.5; 63; 125; 250 Hz and intensities equal to the vibrotactile perception threshold for a given frequency |
Variable stimulus | Frequencies varying between 100 – 150 % of the standard stimulus frequency | |
Probe | Flat cylinder with a diameter of 5 mm, without surroundings, with controlled skin contact force in the range of 0.1-0.2 N | |
Method | Adaptive method 1 up/2 down | |
Task | Three interval forced-choice (3IFC) procedure | |
Analysis | Vibrotactile frequency discrimination threshold for each tested frequency was calculated as the arithmetic mean of the stimulus reversal values without the first | |
Measure | Hz | |
2.2. Measuring stand
A special measuring stand was designed to examine the vibrotactile amplitude and frequency discrimination thresholds on the wrist using the adaptive method 1 up/2 down [10]. The schematic diagram of the stand is shown in Fig. 2. The computer with LabVIEW software control measuring procedure. Vibration stimuli were sent through 4-channel voltage output module NI 9263 (National Instrument) to Apart MB-150 amplifier and generated by the mini modal shaker TMS 2004E (The Modal Shop). The measurement conditions were controlled by the accelerometer PCB M354C03 and pressure sensor and connected with the computer through the 4-channel input module NI 9234. The masking signal (pink noise) was sent through the computer sound card to the Beyerdynamic DT 770 pro headphones. The pressure of the wrist on the probe was constant (0.1-0.2 N) and controlled by pressure sensor.
Fig. 2The measuring stand for testing the differential vibration thresholds on the wrist – the schematic diagram [10]. A – probe, B – support of the subject’s forearm, C – accelerometer PCB M354C03, D – modal shaker TMS 2004E, E – pressure sensor, F – vibration insulation, G – amplifier Apart MB-150, H – closed headphones Beyerdynamic DT 770 pro, I – 4-channel input module NI 9234, J – 4-channel voltage output module NI 9263, K – computer with LabVIEW software
![The measuring stand for testing the differential vibration thresholds on the wrist – the schematic diagram [10]. A – probe, B – support of the subject’s forearm, C – accelerometer PCB M354C03, D – modal shaker TMS 2004E, E – pressure sensor, F – vibration insulation, G – amplifier Apart MB-150, H – closed headphones Beyerdynamic DT 770 pro, I – 4-channel input module NI 9234, J – 4-channel voltage output module NI 9263, K – computer with LabVIEW software](https://static-01.extrica.com/articles/21231/21231-img2.jpg)
3. Results analysis and discussion
Thirty people took part in the study: ten blind people, ten partially sighted people and ten normally sighted people. Each group consisted of 5 women and 5 men aged between 18 to 28 years. A sample results of examination of vibrotactile frequency discrimination thresholds on the wrist using the adaptive method 1 up/2 down is shown in Fig. 3. Median value of the frequency discrimination threshold received for 30 people is shown in Fig. 4.
The main purpose of the results analysis was to check if the values of vibrotactile frequency discrimination thresholds for blind people differ from those for people with normal sight. To check whether the frequency and the gender of the subject affects the value of the vibrotactile frequency discrimination threshold additional analysis was conducted. The obtained threshold values do not follow the normal distribution therefore nonparametric tests were used for the analysis. The influence of individual factors such as the degree of visual disability of the subjects as well as stimulus frequency (more than two groups) were tested using the Kruskal-Wallis test and gender (two groups) were tested using the Kolmogorov-Smirnov test [11].
Additionally, the guidelines for devices with vibration interfaces supporting spatial orientation of the blind and partially sighted people was developed based on results and analysis.
Fig. 4 shows the median value of vibrotactile frequency discrimination thresholds depending on the frequency. Comparing threshold values in Hz is difficult. It is better to compare the values expressed using the Weber fraction. Weber fraction is equal to the ratio of the just noticeable difference (discrimination threshold value) to the frequency of a stimulus . Fig. 5 shows a Weber fraction values for each tested frequency. The weber fraction graph has the characteristic shape of an inverted U letter. The value of the Weber fraction increases with the frequency in the frequency range of 25 to 63 Hz. However, the value of the Weber fraction decrease with the frequency in the frequency range of 125 to 250 Hz. This may mean different sensitivity to changes in the vibration frequency of different types of mechanoreceptors. To check if there are statistically significant differences between the results for the five frequencies the Kruskal-Wallis test was performed. The analysed results follow the assumptions required to perform the Kruskal-Wallis test. The null hypothesis () and the alternative hypothesis () were stated as follows:
– values of vibrotactile frequency discrimination thresholds do not depend on the frequency;
– values of vibrotactile frequency discrimination thresholds depend on the frequency in at least two of the observed groups.
Value 57.70360 (0.0000 is less than 0.05) is in the critical area of statistics. As a result, the null hypothesis can be rejected, and it can be assumed that there is a statistical difference between vibrotactile frequency discrimination thresholds for different frequencies, for at least two measured frequencies. Further analyses (Table 2) showed statistically significant lower thresholds for 25, 31.5 and 250 Hz versus 63 and 125 Hz. No statistically significant differences were found between the other frequency pairs [5]. The value of the Weber fraction increases with the frequency up to 125 Hz. For frequency 250, a decrease in was observed. Similar studies that can be found in the literature showed an increase in the Weber fraction with increasing frequency or a constant value regardless of frequency [12].
Fig. 3Examination of vibrotactile frequency discrimination thresholds on the wrist using the adaptive method 1 up/2 down – sample results [10]
![Examination of vibrotactile frequency discrimination thresholds on the wrist using the adaptive method 1 up/2 down – sample results [10]](https://static-01.extrica.com/articles/21231/21231-img3.jpg)
Fig. 4Median value of vibrotactile frequency discrimination thresholds measured on the wrist [10]
![Median value of vibrotactile frequency discrimination thresholds measured on the wrist [10]](https://static-01.extrica.com/articles/21231/21231-img4.jpg)
Fig. 5Weber fraction for detecting a change in vibration frequency on the wrist
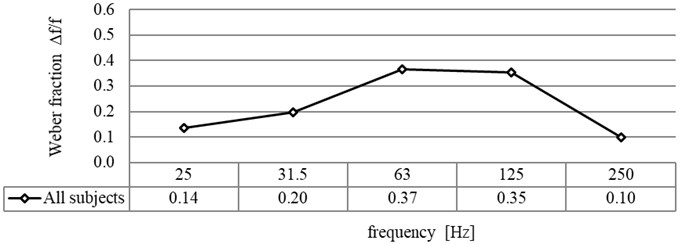
Table 2P-value for multiple (two-sided) comparisons. Kruskal-Wallis Test: H= 57.70360, p= 0.0000
25 Hz | 31.5 Hz | 63 Hz | 125 Hz | 250 Hz | |
25 Hz | 1.000000 | 0.000038* | 0.000006* | 1.000000 | |
31.5 Hz | 1.000000 | 0.014714* | 0.003961* | 0.129143 | |
63 Hz | 0.000038* | 0.014714* | 1.000000 | 0.000000* | |
125 Hz | 0.000006* | 0.003961* | 1.000000 | 0.000000* | |
250 Hz | 1.000000 | 0.129143 | 0.000000* | 0.000000* | |
Note: *0.05 ( – the pre-specified significance level) | |||||
Fig. 6 compares the median values of vibrotactile frequency discrimination thresholds for men and women. There are differences in the values obtained for individual groups for high frequencies (received by FAII mechanoreceptors).
The Kolmogorov-Smirnov test was performed to check whether the observed differences of thresholds in individual groups were statistically significant.
The null hypothesis () and the alternative hypothesis () were stated as follows:
– values of vibrotactile frequency discrimination thresholds do not differ between women and men;
– values of vibrotactile frequency discrimination thresholds differ between women and men.
Fig. 6Median value of vibrotactile frequency discrimination thresholds measured on the wrist depending on the gender of the subjects
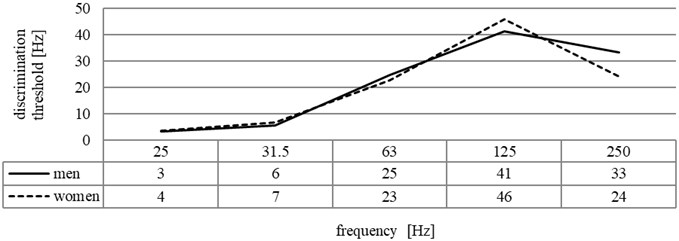
According to the Kolmogorov-Smirnov test the p value for comparison between different frequencies is greater than 0.1 (0.05). Therefore, the null hypothesis could not be rejected. It was found that for all tested frequencies the observed differences in the results of men and women are not statistically significant. Further analyses were conducted for all subjects without considering the division by gender.
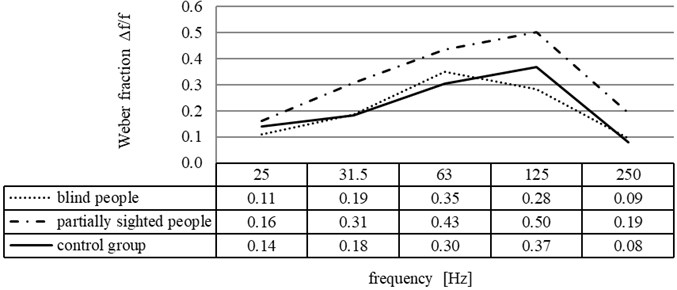
Fig. 7 shows the median values of vibrotactile frequency discrimination thresholds for the blind, partially sighted and normally sighted people. In frequencies 25 and 31.5 Hz threshold for different groups are almost equal. While in frequencies 63, 125 and 250 Hz thresholds for partially sighted people are much higher than for blind and normally sighted people. Additionally, Weber fraction for detecting a change in vibration frequency for different group was analysed (Fig. 8). It was noticed that partially sighted people reach higher vibrotactile frequency discrimination thresholds for all frequencies except 25 Hz.
Fig. 7Median value of vibrotactile frequency discrimination thresholds measured on wrist depending on the degree of visual disability of the subjects
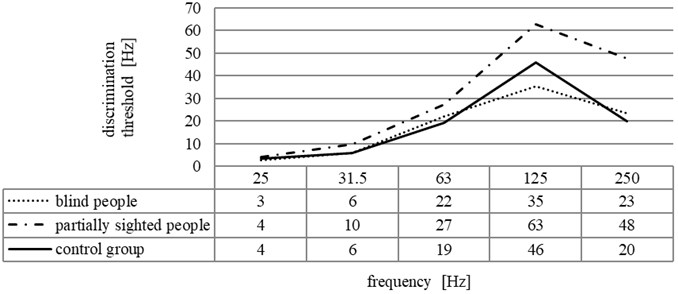
Fig. 8Weber fraction for detecting a change in vibration frequency on the wrist depending on the degree of visual disability of the subjects
To check if there were statistically significant differences between the results for the blind, partially sighted and normally sighted people the Kruskal-Wallis test was performed. The null hypothesis () and the alternative hypothesis () were stated as follows:
– values of vibrotactile frequency discrimination thresholds do not depend on the degree of visual disability of the subjects;
– values of vibrotactile frequency discrimination thresholds depend on the degree of visual disability of the subjects in at least two of the observed groups.
For all tested frequencies the value of is outside the critical range (Table 3). As a result, null hypothesis cannot be rejected, and it can be assumed that values of vibrotactile frequency discrimination thresholds do not depend on the degree of visual disability of the subjects for following frequencies: 25; 31.5; 63; 125 and 250 Hz.
The obtained results were compared with the values obtained by Mahns et al. [13] in the experiment carried out by the method of constant stimuli. The study described in the Journal of Neurophysiology was attended by 5 people (while in the own research 30 people). vibrotactile frequency discrimination thresholds were determined for four standard frequencies: 20, 50, 100 and 200 Hz. The summary of results obtained in own research and in research carried out by Mahns et al. is presented in Figs. 9-10.
Table 3P-value for multiple (two-sided) comparisons. Kruskal-Wallis Test: H= 57.70360, p= 0.0000
Frequency | Kruskal-Wallis Test – grouping variable – degree of visual disability |
25 Hz | (2, 30) = 2.600871 0.2724 |
31.5 Hz | (2, 30) = 5.633935 0.0598 |
63 Hz | (2, 28) = 3.084752 0.2139 |
125 Hz | (2, 28) = 2.850041 0.2405 |
250 Hz | (2, 29) = 4.800121 0.0907 |
Fig. 9A summary of results obtained in own research and in research conducted by Mahns et al. – discrimination threshold [13]
![A summary of results obtained in own research and in research conducted by Mahns et al. – discrimination threshold [13]](https://static-01.extrica.com/articles/21231/21231-img9.jpg)
Fig. 10A summary of results obtained in own research and in research conducted by Mahns et al. – Weber fraction [13]
![A summary of results obtained in own research and in research conducted by Mahns et al. – Weber fraction [13]](https://static-01.extrica.com/articles/21231/21231-img10.jpg)
The threshold values, determined in the Mahns’ study, were compared with the values obtained in the own study. Mahns’ and own study were not performed for vibration stimuli of the same frequency. Hence threshold values were compared for frequencies close to each other and activating the same mechanoreceptors. It has been noticed that for frequencies above 50 Hz the thresholds have similar values in the group of the blind, sighted and Mahns’, while they differ in the group of the visually impaired. The thresholds for frequencies below 40 Hz obtained in own study differ significantly from those obtained by Mahns.
4. Conclusions
The paper presents the third part of results of the research on vibration perception on the wrist of blind, partially sighted and normally sighted people. Earlier, absolute vibrotactile thresholds [4, 5] and vibrotactile amplitude discrimination thresholds [10, 14] studies were published. Base on research presented in the paper vibrotactile frequency discrimination thresholds for frequencies 25; 31.5; 63; 125 and 250 Hz were determined. Dependence of vibrotactile frequency discrimination thresholds on standard stimulus frequency has been confirmed. The value of the Weber fraction increases with the frequency from 25 Hz up to 125 Hz. For frequency 250 Hz a decrease in Weber fraction was observed.
In summary, analysis of the effects of frequency, gender and degree of visual disability of the subject on the value of vibrotactile frequency discrimination threshold have shown that:
– there are some statistically significant differences between the vibrotactile frequency discrimination thresholds for tested frequency pairs. There are statistically significant lower thresholds for 25, 31.5 and 250 Hz versus 63 and 125 Hz;
– there is no statistically significant difference between values of vibrotactile frequency discrimination thresholds for men and women;
– there is no statistically significant difference between values of vibrotactile frequency discrimination thresholds for blind, partially sighted and normally sighted people.
In addition, it was stated that using signals that differ only in frequency to give different information to the wrist is unfavourable, because changes of this vibration signal parameter are poorly recognized by the human sensory system.
References
-
World Report on Vision. World Health Organization, 2019.
-
Majewski T. Methodological Guide for Teachers Working with Children with Vision Impairment in the Integration System. PWN, Warsaw, 1997.
-
Wiciak J., Borkowski B., Czopek D. A system for determination of areas hazardous for blind people using wave-vibration markers final conclusions and technical. Application Acta Physica Polonica A, Vol. 123, Issue 6, 2013, p. 1101-1105.
-
Bogusz E., Mrozik G., Skrodzka E. Investigation of vibratory perceptron thresholds in blind and visually handicapped people in chosen areas of the palm and the wrist. Acta Physica Polonica A, Vol. 121, Issue 1, 2012, p. 19-23.
-
Wiciak J., Borkowski B., Czopek D., Trojanowski R., Okarmus A., Zalewska L., Bogusz E., Furman A., Skrodzka E. Blind in a Big City: System for Determination of Hazardous and Important Areas for Blind and Visually Impaired People Using Wave-Vibration Markers. AGH publishing houses, Kraków, 2012.
-
Ozimek E. Sound and Its Perception. Physical and psychoacoustic aspects. PWN, Warsaw-Poznan, 2002.
-
Levitt H. Transformed up-down methods in psychoacoustics. The Journal of the Acoustical Society of America, Vol. 49, Issue2, 1970, p. 467-477.
-
Kingdom F. A., Prins N. Psychophysics. Practical Introduction, Academic Press, 2010.
-
Chruściel M. LabVIEW in Practice. BTC Publishing House, Legionowo, 2008.
-
Czopek D., Korbiel T., Kukulski B., Małecki P., Pawlik P., Stępień B., Wszołek T., Wszołek W. New Methods of Signal Processing in the Selected Vibroacoustics Problems. Department of Process Automation of the AGH in Krakow 2016.
-
McClave S. Probability and Statistics for Engineers. PWS-KENT Publishing Company, Boston, 1986.
-
Bensmaïa S., Hollins M. I., Yau J. Vibrotactile intensity and frequency information in the Pacinian system: A psychophysical model. Perception and Psychophysics, Vol. 67, Issue 5, 2005, p. 828-841.
-
Mahns D. A., Perkins N. M., Sahai V., Robinson L. I., Rowe M. J. Vibrotactile frequency discrimination in human hairy skin. Journal of Neurophysiology, Vol. 95, 2006, p. 1442-1450.
-
Czopek D., Wiciak J. Vibrotactile amplitude discrimination on the wrist of visually impaired people. Vibrations in Physical Systems, Vol. 30, Issue 1, 2019, p. 49-56.
About this article

The project described in this paper has been executed within the project No. 16.16.130.942 in Department of Mechanics and Vibroacoustics of AGH University of Science and Technology in Cracow, Poland.
